47
Chapter 8: Time and Time-Related Variables in Engineering
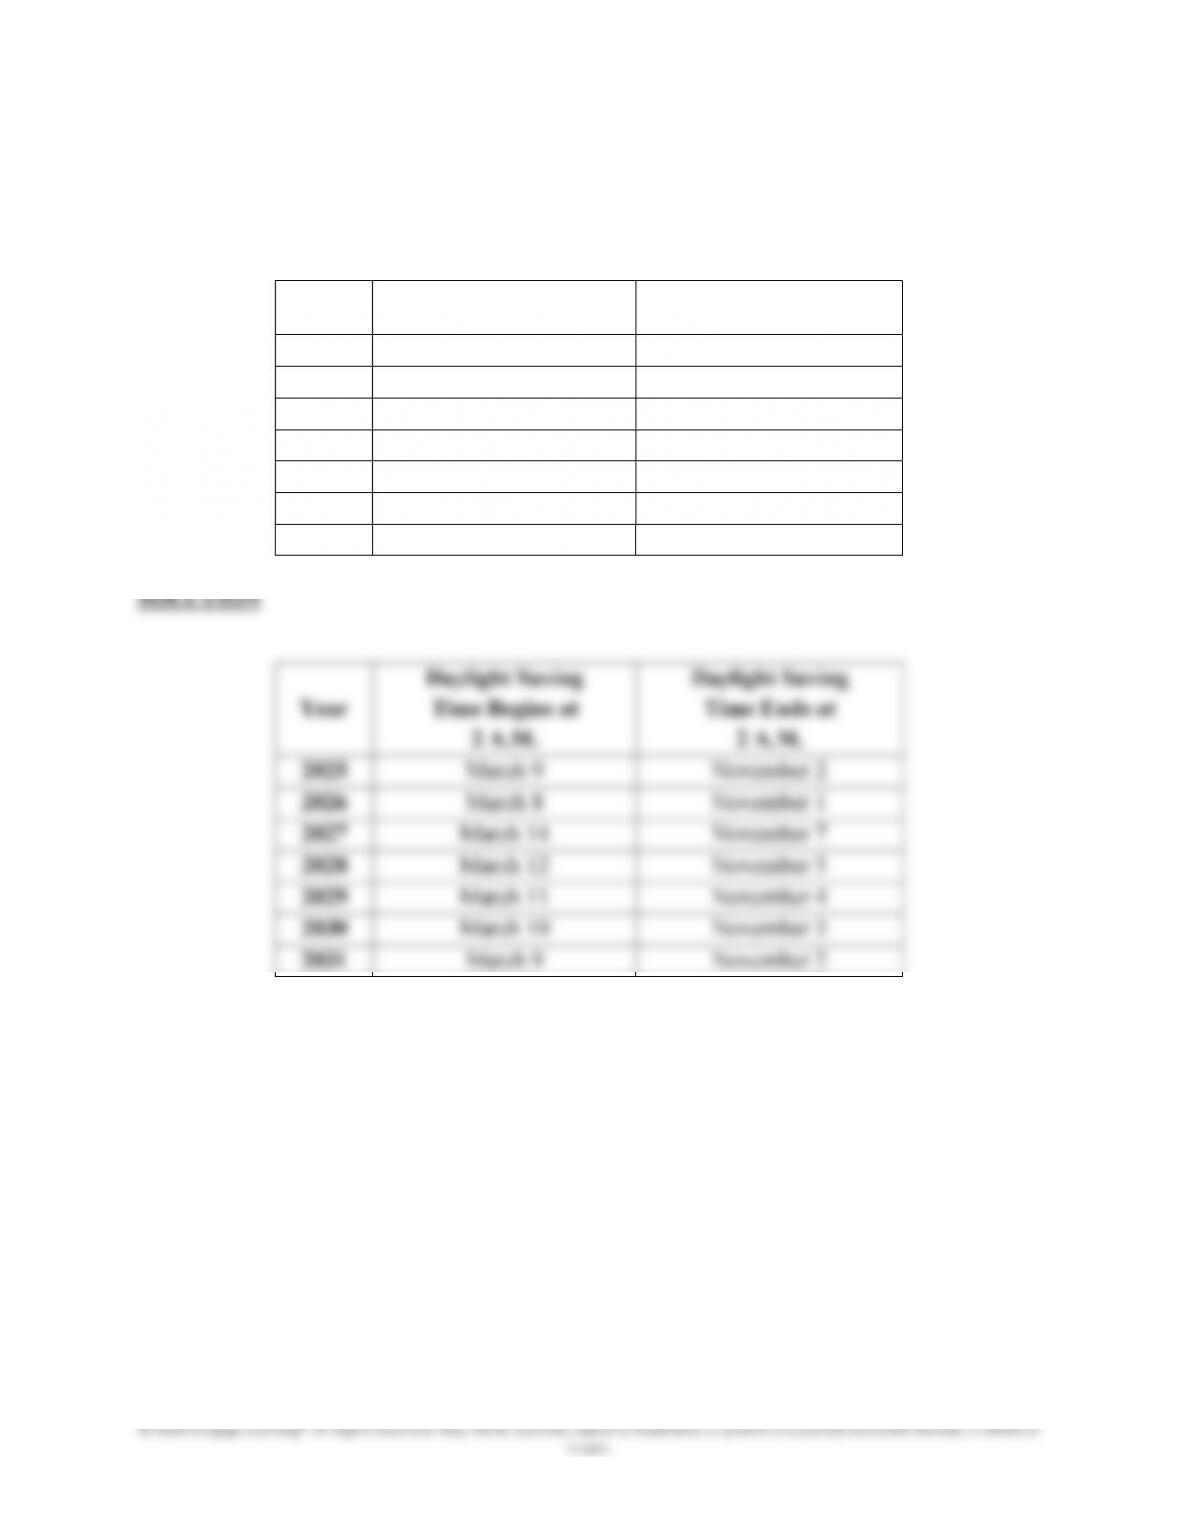
8.1 Create a calendar showing the beginning and the end of daylight savings time for years
2025-2031.
Year Daylight Savings Time
Begins at 2:00
A.M
.
Daylight Savings Time
Ends at 2:00
A.M
.
2025
2026
2027
2028
2029
2030
2031
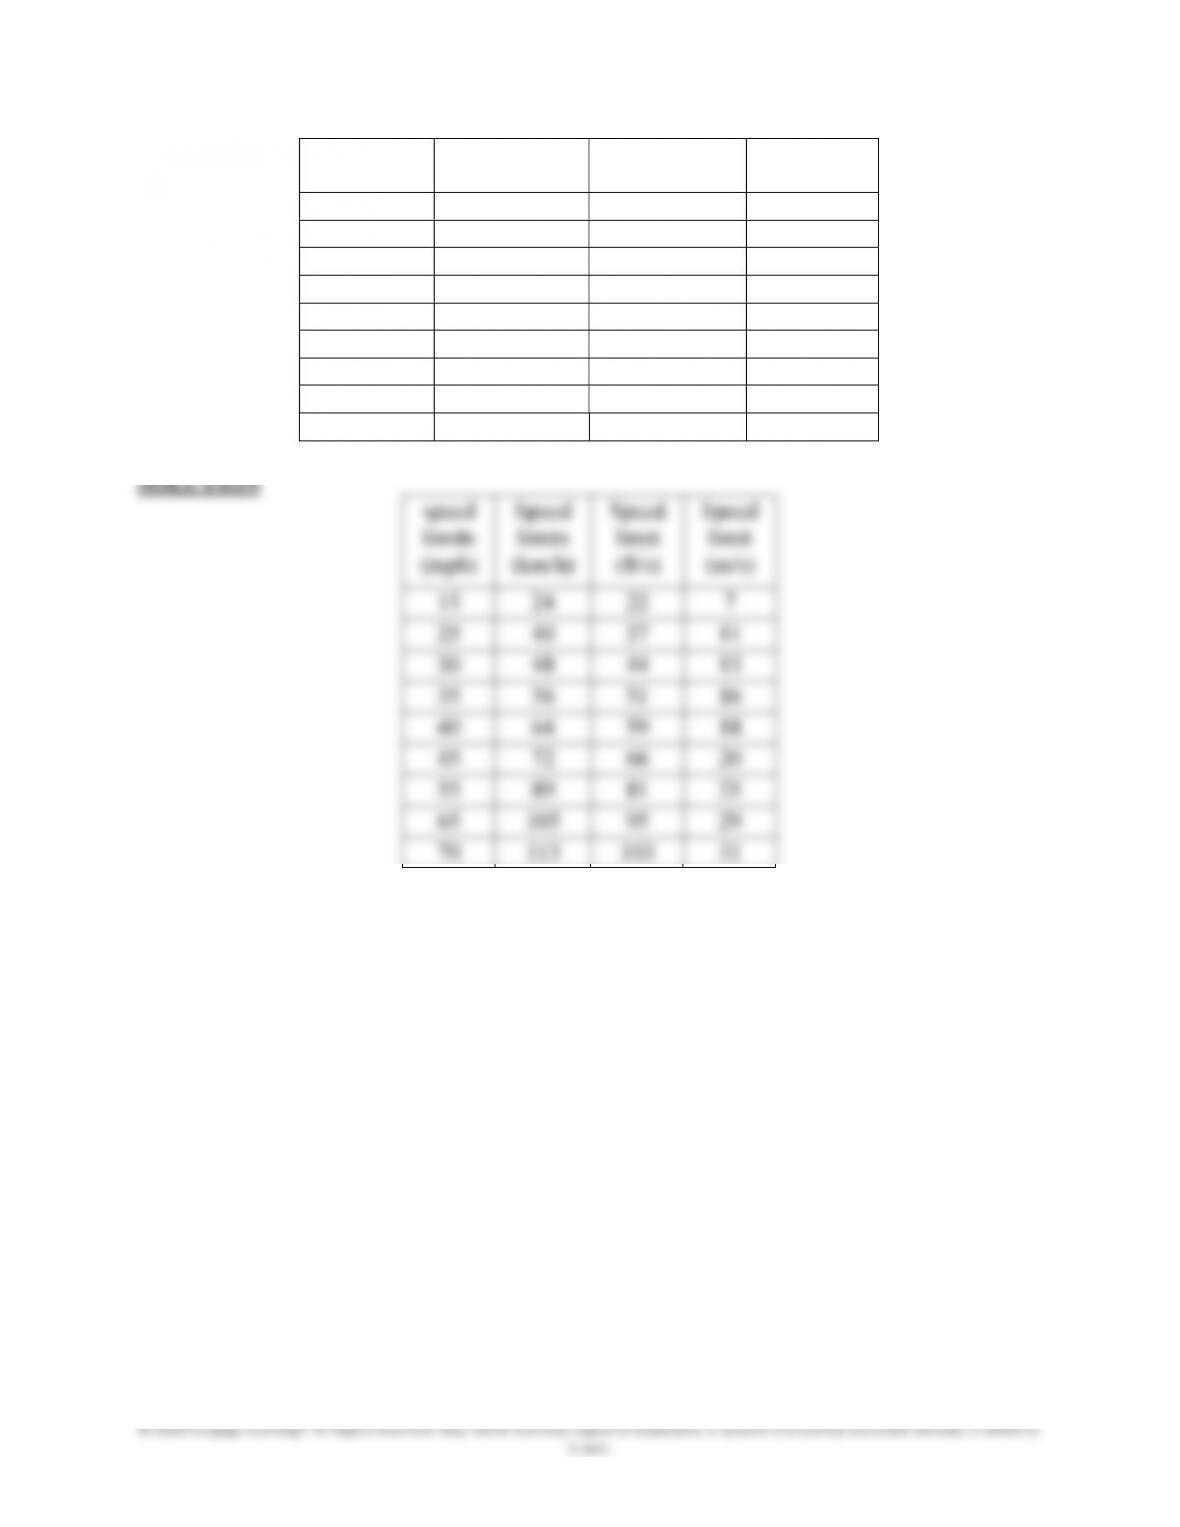
8.10 Convert the following speed limits from miles per hour (mph) to kilometers per hour
(km/h), and from feet per second (ft/s) to meters per second (m/s). Think about the
relative magnitude of values as you go from mph to ft/s, and as you go from km/h to m/s.
You may use Excel to solve this problem.
48
speed limits
(mph)
Speed limits
(km/h)
Speed limit
(ft/s)
Speed limit
(m/s)
15
25
30
35
40
45
55
65
70
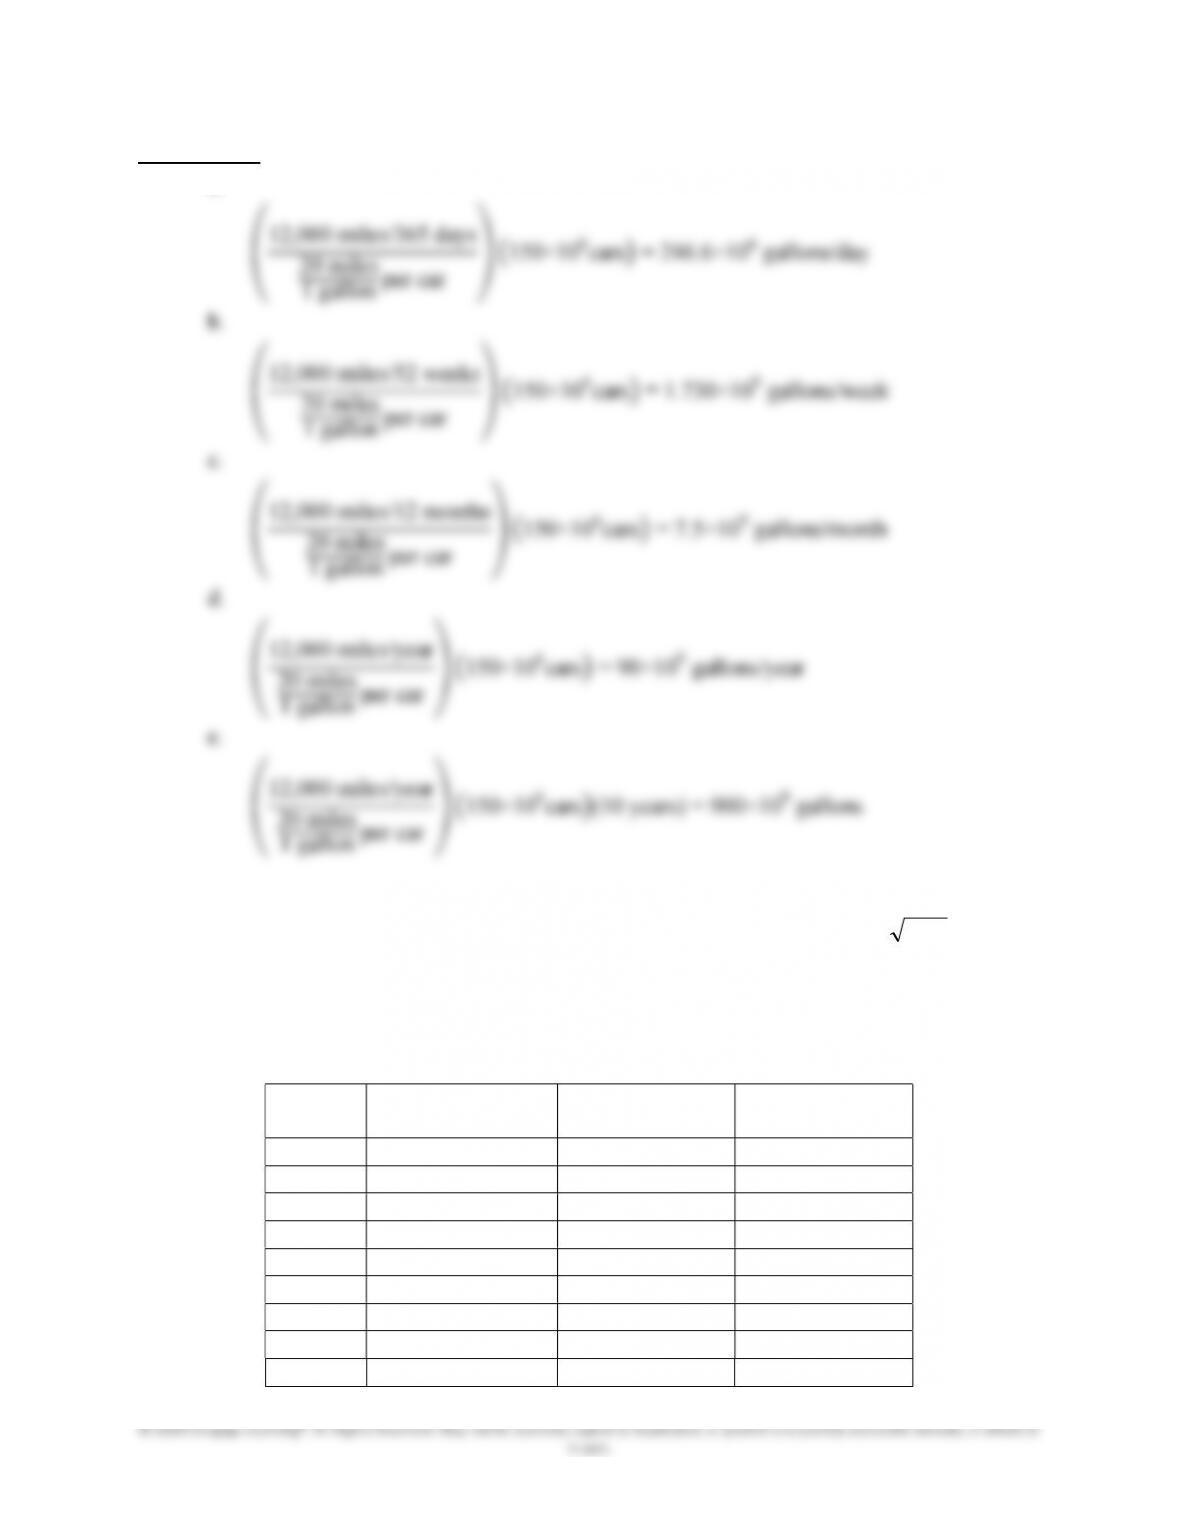
8.11 Most car owners drive their cars an average of 12,000 miles a year. Assuming a 20
miles/gallon gas consumption rate, determine the amount of fuel consumed by 150
million car owners on the following time bases:
a. average daily basis
b. average weekly basis
c. average monthly basis
d. average yearly basis
e. over a period of ten years
Express your results in gallons and liters.
49
SOLUTION
a. 12,000 miles/365 days
8.12 Calculate the speed of sound for the U.S. standard atmosphere using, kRTc where c
represents the speed of sound in m/s, k is the specific heat ratio for air (k = 1.4), and R is
the gas constant for the air (R = 286.9 J/kg·K) and T represents the temperature of the air
in Kelvin. The speed of sound in atmosphere is the speed at which sound propagates
through the air. You may use Excel to solve this problem.
Altitude
(m)
Air Temperature
(K)
Speed of Sound
(m/s)
Speed of Sound
(km/h)
500
284.9
1,000
281.7
2,000
275.2
5,000
255.7
10,000
223.3
15,000
216.7
20,000
216.7
40,000
250.4
50,000
270.7
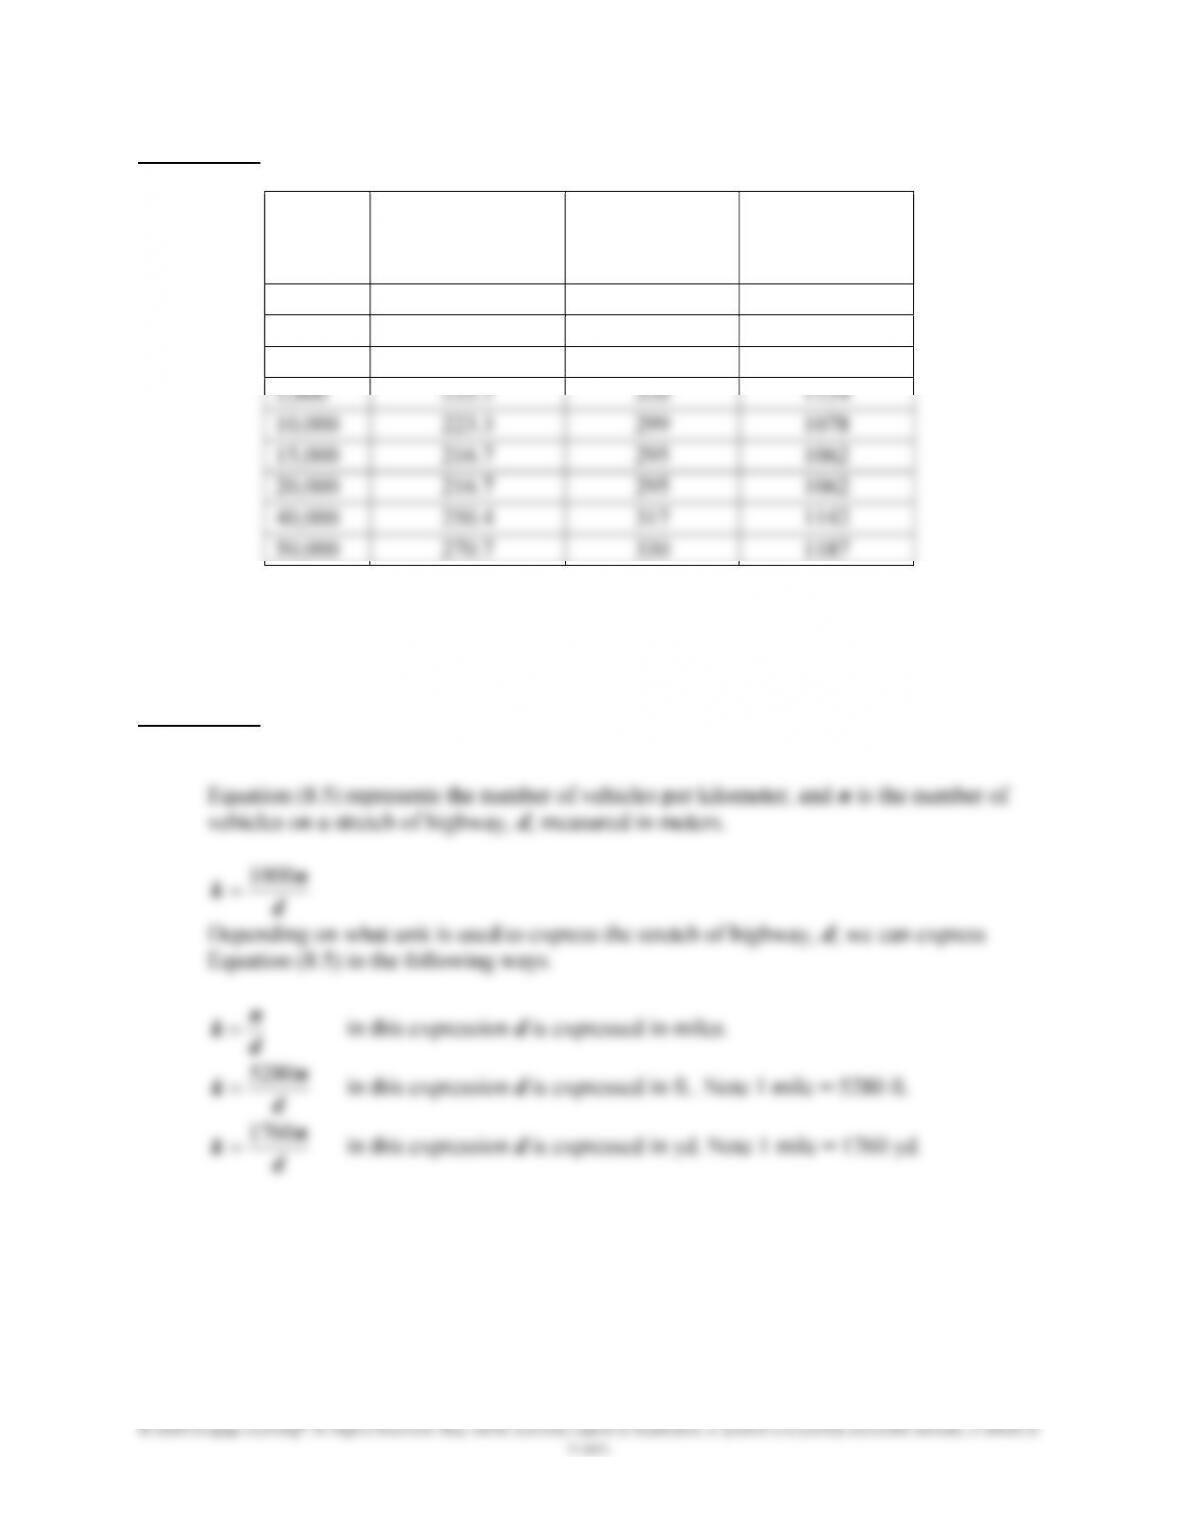
50
SOLUTION
Altitude
(m)
Air Temperature
(K)
Speed of Sound
(m/s)
Speed of Sound
(km/h)
500 284.9 338 1218
1,000 281.7 336 1211
2,000 275.2 332 1197
8.13 Express Equation (8.5), the traffic density in terms of number of vehicles per mile.
SOLUTION
8.14 Express the angular speed of the earth in rad/s and rpm.
SOLUTION
8.15 What is the magnitude of the speed of a person at the equator due to rotational speed of
the earth?
2
rev 1
h 24
8.18 Determine the speed of a point on the earth surface in ft/s, m/s, mph, km/h. State your
assumptions.
2
rev 1
h 24
52
© 2020 Cengage Learning®. All Rights Reserved. May not be scanned, copied or duplicated, or posted to a publicly accessible website, in whole or
in part.
m/s 464
s 3600
h 1
km 1
m 1000
h
km
1669
V
ft/s 1522
m 1
ft 3.28
s
m
464
V
mph 1037
h 1
s 3600
ft 5280
mile 1
s
ft
1522
V
8.19 Into how many time zones is the United states and its territories divided into?
8.21 Determine the natural frequency of a pendulum whose length is 15 ft.
SOLUTION
s
29
.
4
T
8.22 Determine the spring constant for Example 8.1 if the system is to oscillate with a natural
frequency of 5 Hz.
SOLUTION
53
© 2020 Cengage Learning®. All Rights Reserved. May not be scanned, copied or duplicated, or posted to a publicly accessible website, in whole or
in part.
m
k
fn
2
1
kg 2
N/m
2 Hz5
kg 2
N/m
2
1
Hz5 2kk
and solving for k, we get
N/cm 19.74N/m 1974
k
8.23 Determine the traffic flow if 100 cars pass a known location during 10 seconds.
10
8.24 A conveyer belt runs on 4-in. drums that are driven by a motor. If it takes 5 s for the belt
to go from zero to the speed of 4 ft/s, calculate the final angular speed of the drum and its
angular acceleration. Assume constant acceleration.
SOLUTION
2
in. 12
54
© 2020 Cengage Learning®. All Rights Reserved. May not be scanned, copied or duplicated, or posted to a publicly accessible website, in whole or
in part.
change in angular speed
angular accleration
time
2
rad/s 8.4
s
5
rad/s 0 –24
onacceleratiangular
8.25 Chinook, a military helicopter has two three-blade rotor systems, each turning in opposite
direction. Each blade has a diameter of approximately 41 ft. The blades can spin at
angular speeds of up to 225 rpm. Determine the translational speed of a particle located at
the tip of a blade. Express your answer in ft/s, mph, m/s, and km/h.
SOLUTION
h 1
m 1000
s
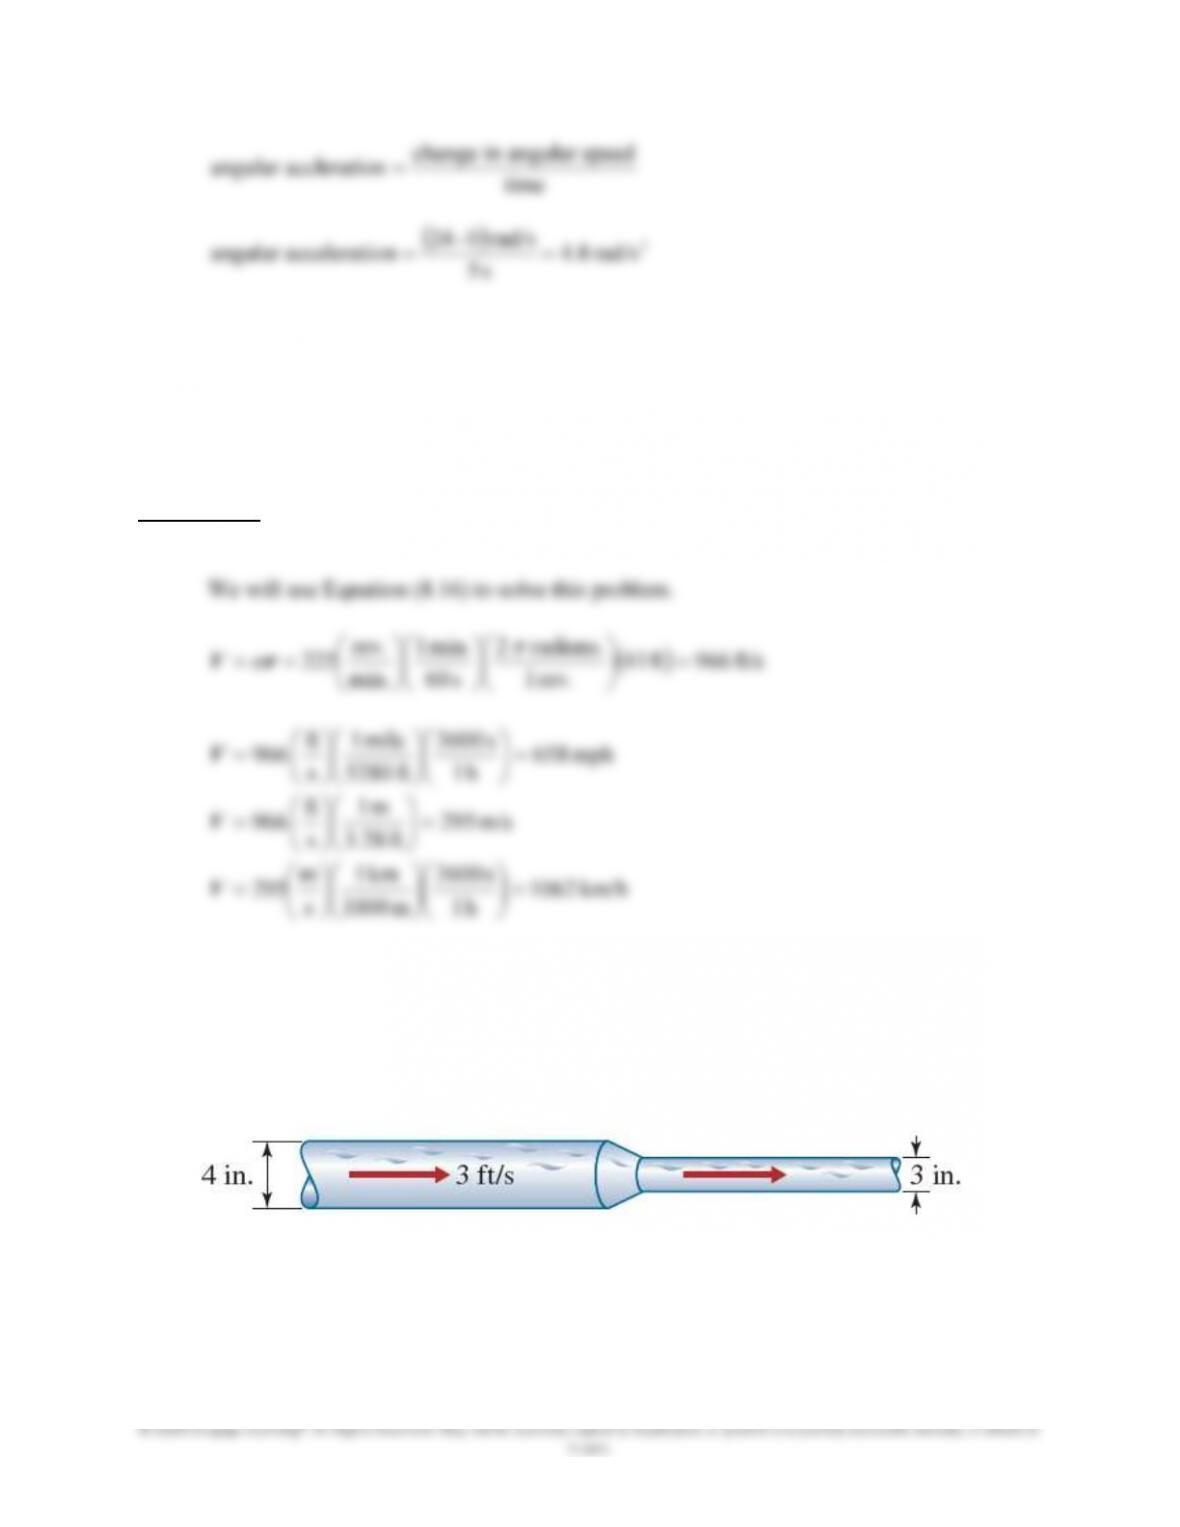
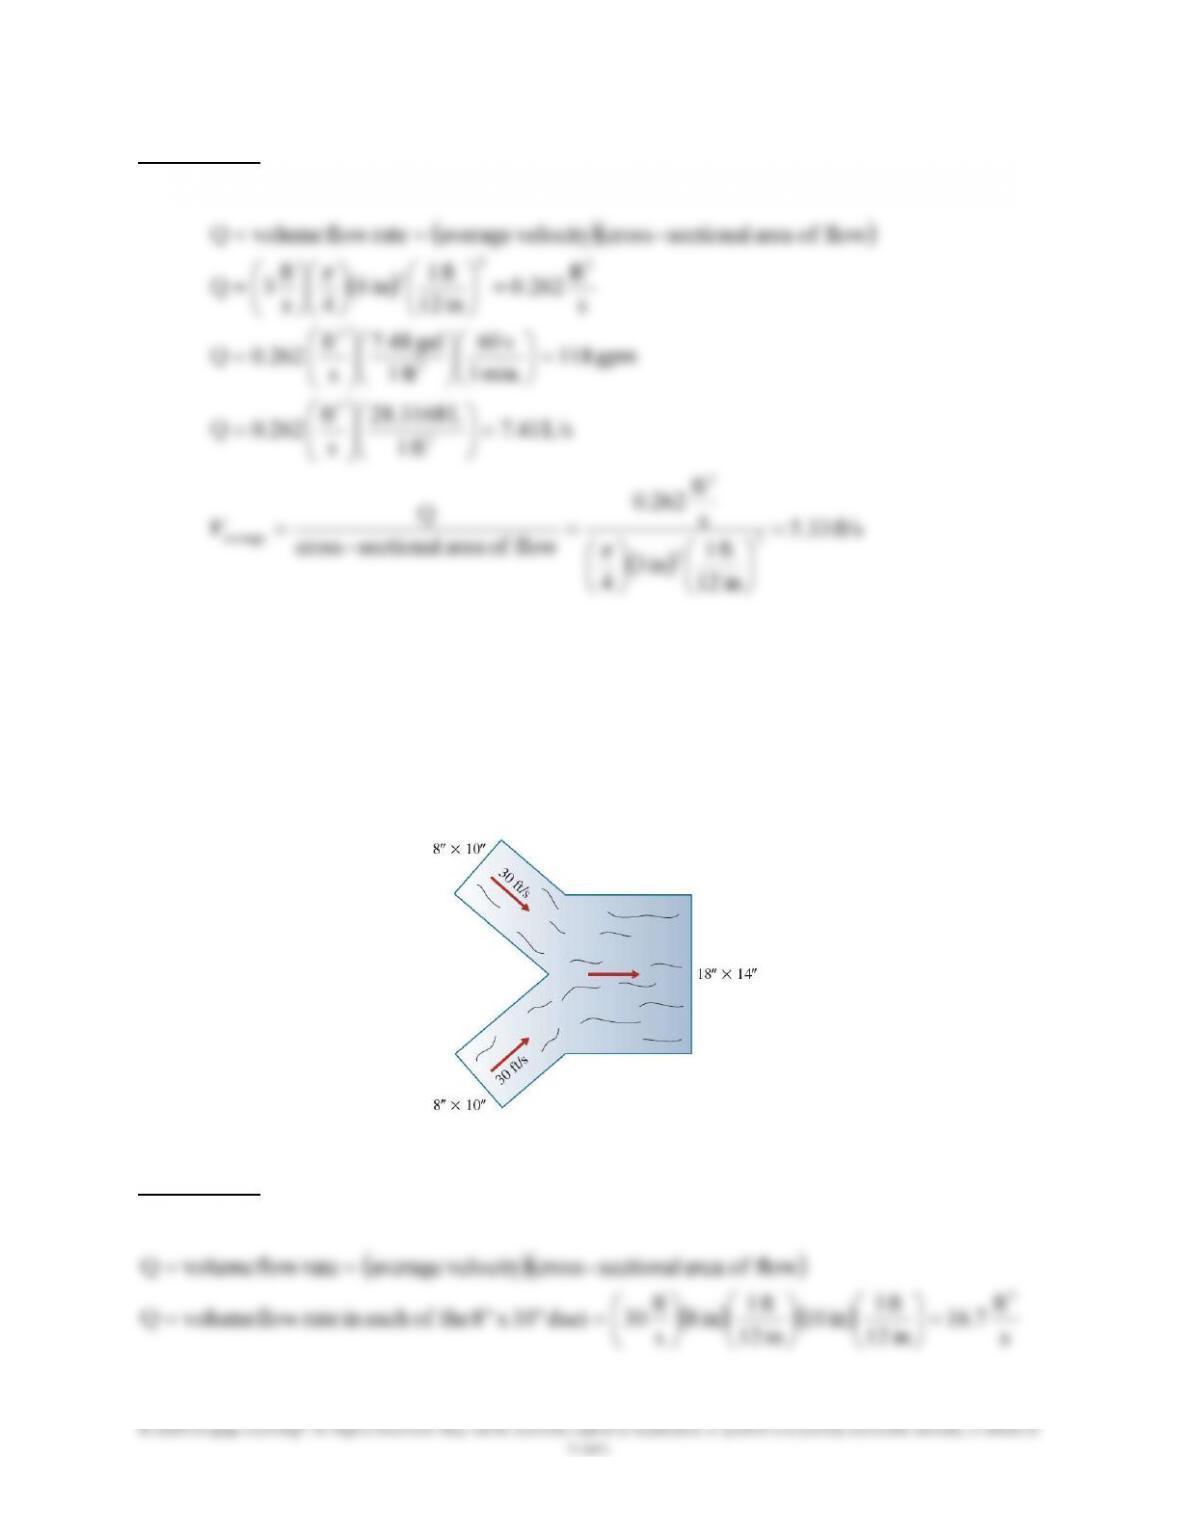
8.26 Consider the piping system shown in the accompanying figure. The speed of water
flowing through the 4-in.-diameter section of the piping system is 3 ft/s. What is the
volume flow rate of water in the piping system? Express the volume flow rate in ft3/s,
gpm, and L/s. For the case of steady flow of water through the piping system, what is the
speed of water in the 3-in.-diameter section of the system?
55
SOLUTION
in 12
ft 1
in 3
4
flow ofarea sectional–cross
2
2
average
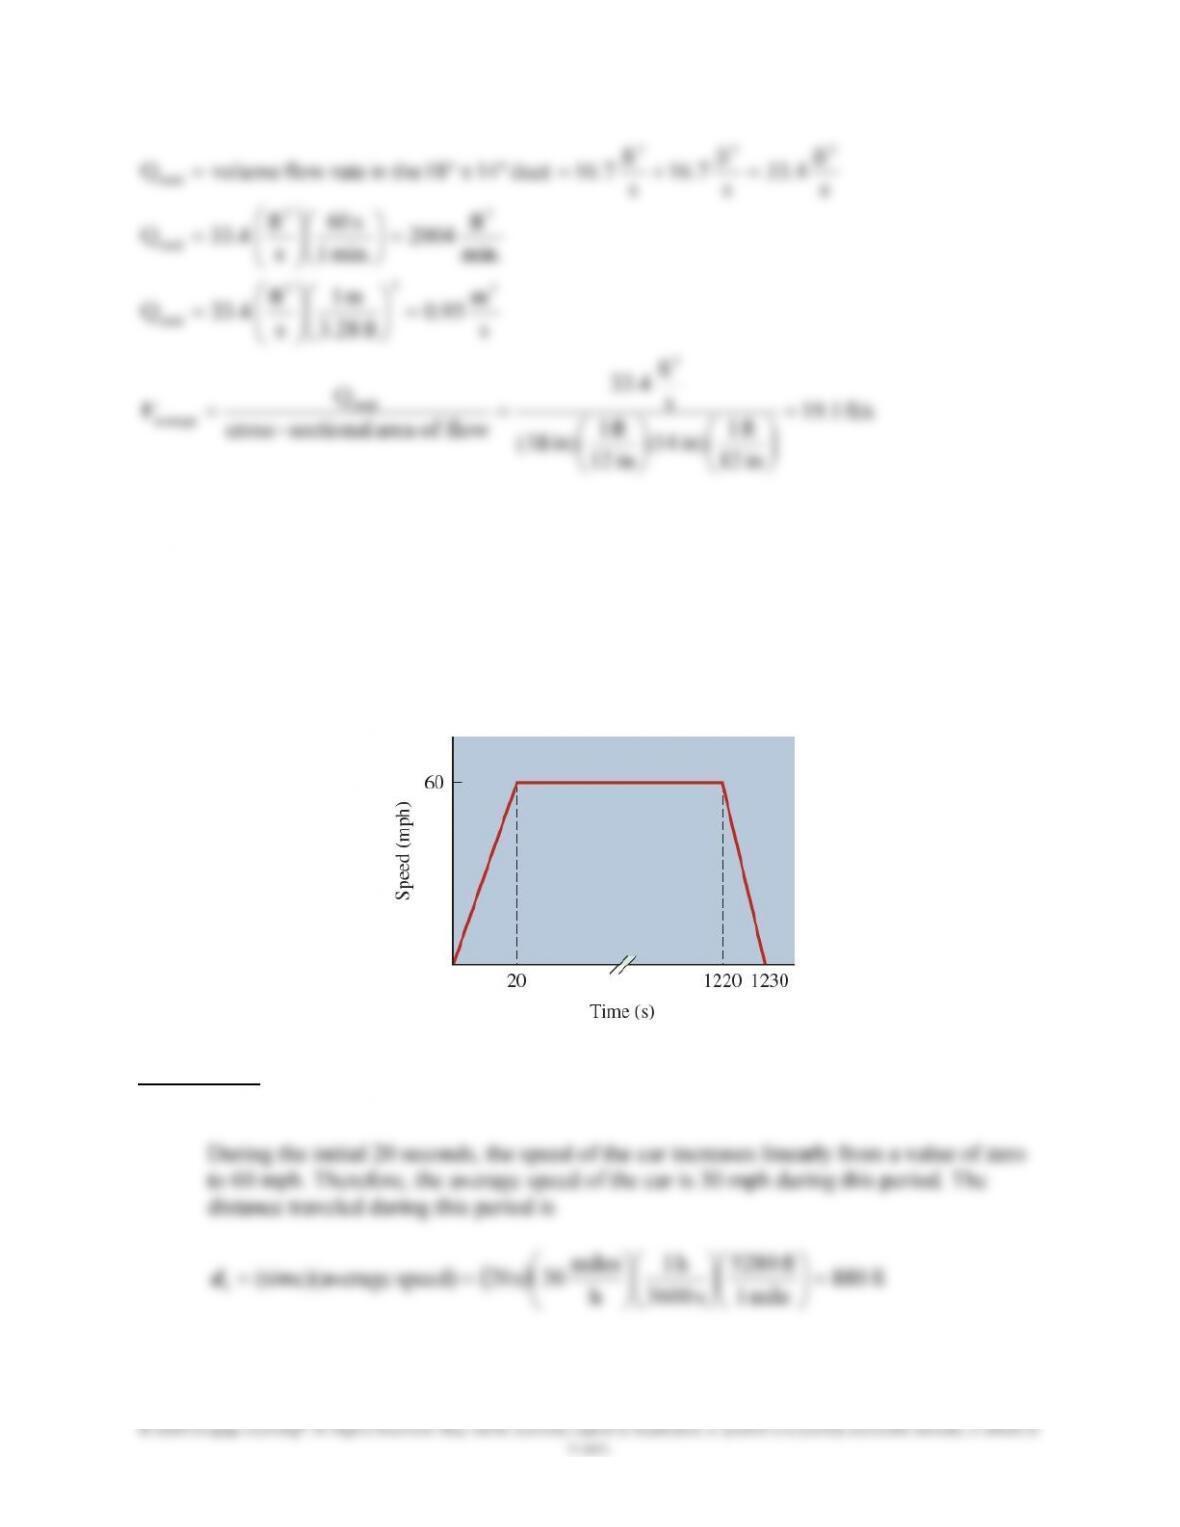
8.27 Consider the duct system shown in the accompanying figure. Air flows through two 8-
in.-by-10-in. ducts that merge into a 18-inch-by-14-inch duct. The average speed of the
air in each of the 8 x 10 duct is 30 ft/s. What is the volume flow rate of air in the 18 × 14
duct? Express the volume flow rate in ft3/s, ft3/min, and m3/s. What is the average speed
of air in the 18 ×14 duct?
SOLUTION
s
in 12
in 12
s
56
© 2020 Cengage Learning®. All Rights Reserved. May not be scanned, copied or duplicated, or posted to a publicly accessible website, in whole or
in part.
s
ft
4.33
s
ft
7.16
s
ft
7.16duct14″x 18″ thein rateflow volumeQ
333
total
min.
ft
2004
min. 1
s 60
s
ft
4.33Q
33
total
s
m
95.0
ft 28.3
m 1
s
ft
4.33Q
3
3
3
total
ft/s 1.19
in 12
ft 1
in) 14(
in 12
ft 1
in) (18
s
ft
4.33
flow ofarea sectional–cross
Q
3
total
average
V
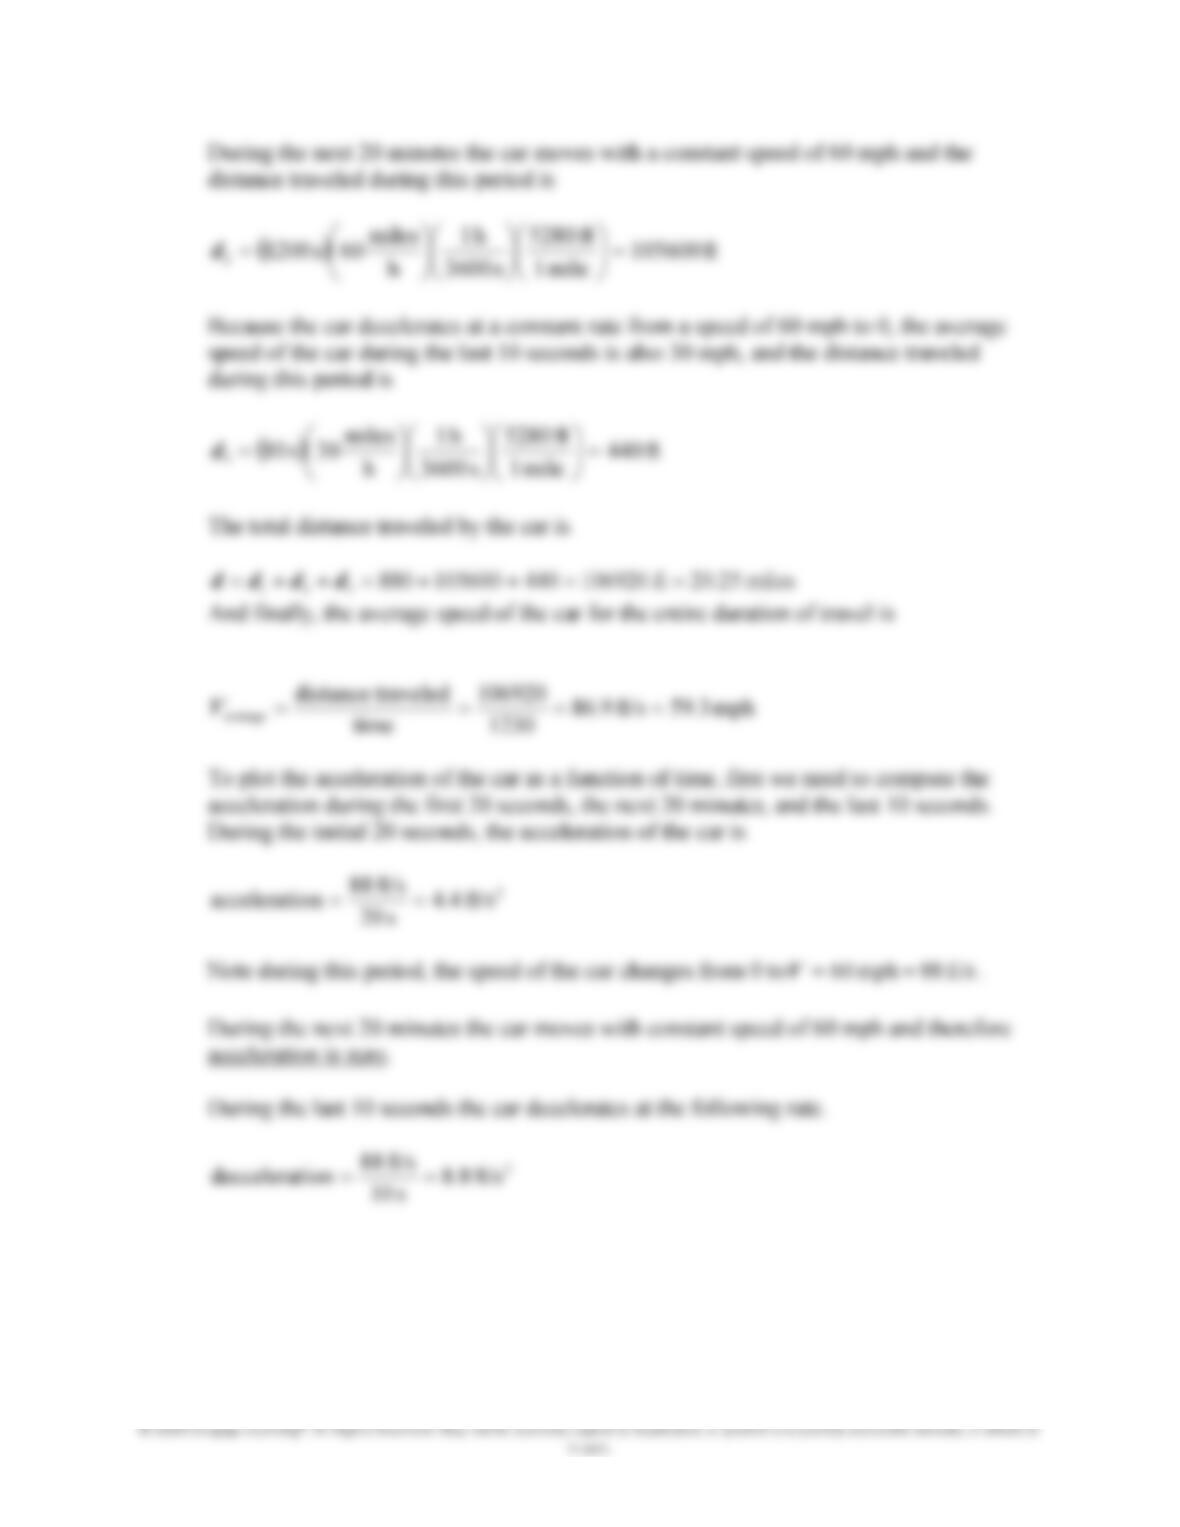
8.28 A car starts from rest and accelerates to a speed of 60 mph in 20 s. The acceleration
during this period is constant. For the next 20 minutes the car moves with the constant
speed of 60 mph. At this time the driver of the car applies the brake and the car
decelerates to a full stop in 10 s. The variation of the speed of the car with time is shown
in the accompanying diagram. Determine the total distance traveled by the car and the
average speed of the car over this distance. Also plot the acceleration of the car as a
function of time.
SOLUTION
57
© 2020 Cengage Learning®. All Rights Reserved. May not be scanned, copied or duplicated, or posted to a publicly accessible website, in whole or
in part.
During the next 20 minutes the car moves with a constant speed of 60 mph and the
distance traveled during this period is
ft 105600
mile 1
ft 5280
s 3600
h 1
h
miles
60s 1200
2
d
Because the car decelerates at a constant rate from a speed of 60 mph to 0, the average
speed of the car during the last 10 seconds is also 30 mph, and the distance traveled
during this period is
ft 440
mile 1
ft 5280
s 3600
h 1
h
miles
30s 10
3
d
The total distance traveled by the car is
miles 20.25 ft 106920440105600880
321 dddd
And finally, the average speed of the car for the entire duration of travel is
mph 59.3ft/s 86.9
1230
106920
time
traveleddistance
average V
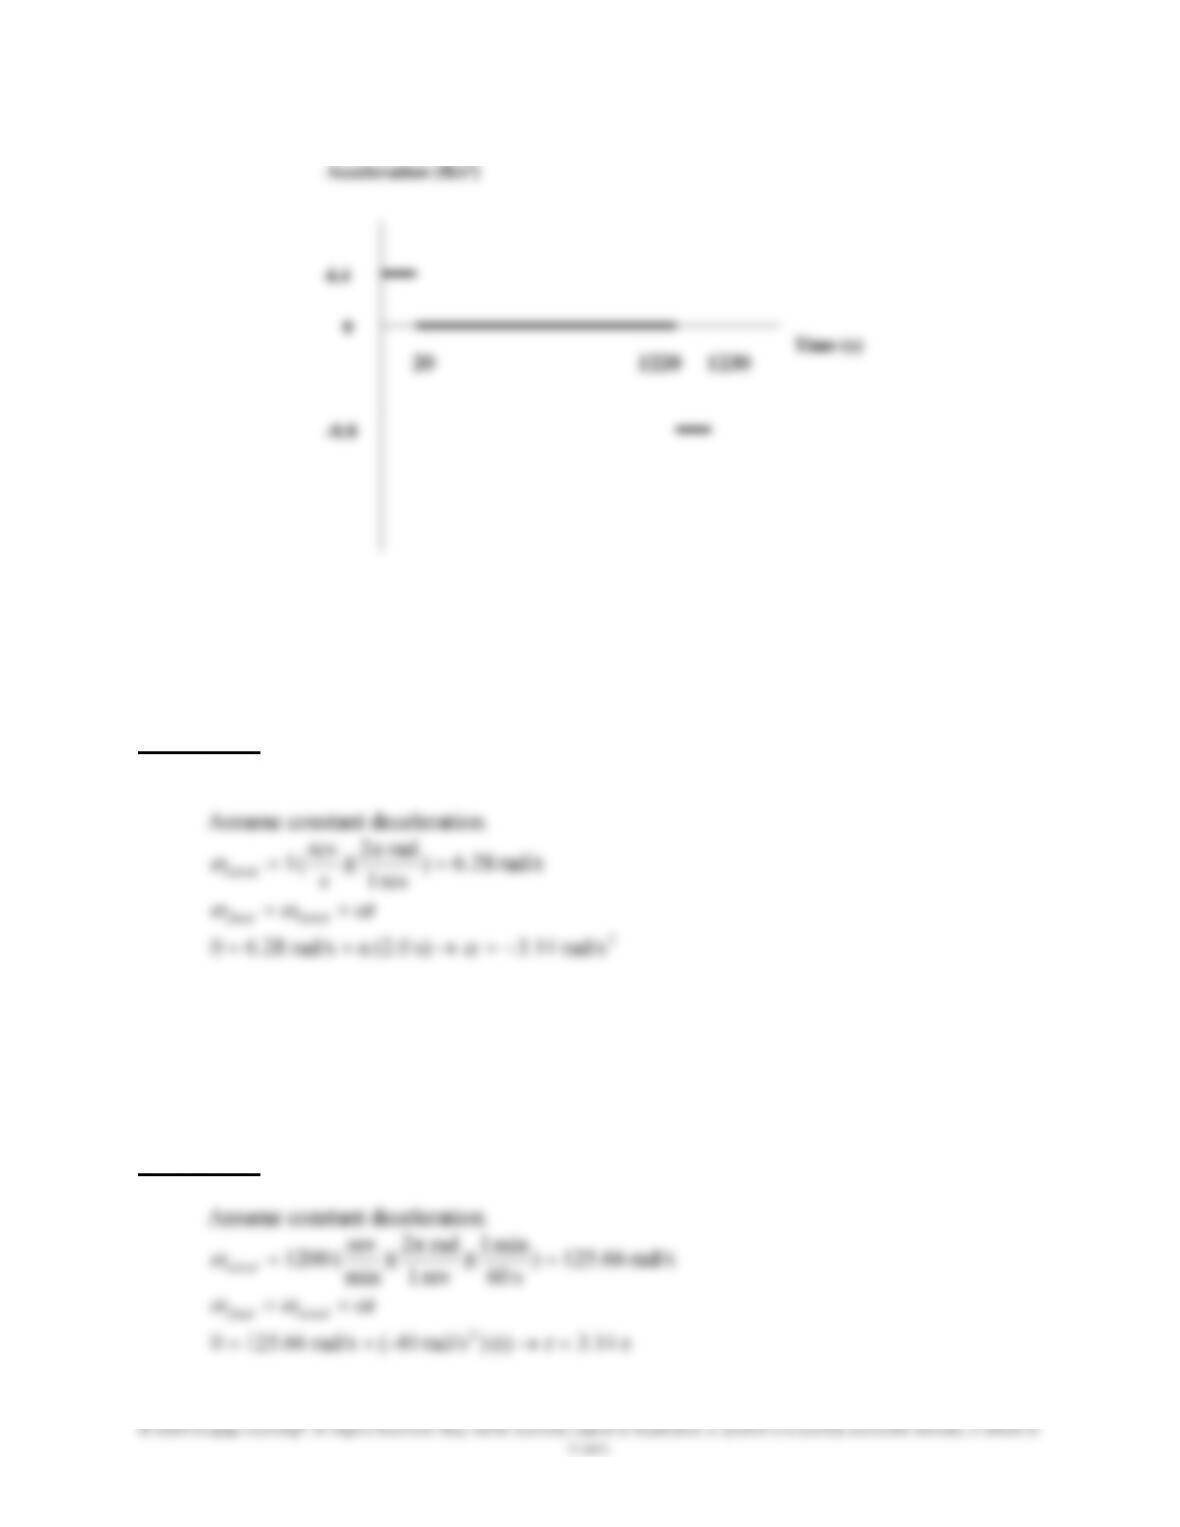
To plot the acceleration of the car as a function of time, first we need to compute the
acceleration during the first 20 seconds, the next 20 minutes, and the last 10 seconds.
During the initial 20 seconds, the acceleration of the car is
2
ft/s 4.4
s
20
ft/s 88
onaccelerati
Note during this period, the speed of the car changes from 0 to ft/s 88 mph 60
V.
During the next 20 minutes the car moves with constant speed of 60 mph and therefore
acceleration is zero.
During the last 10 seconds the car decelerates at the following rate.
2
ft/s 8.8
s
10
ft/s 88
iondeccelerat
Acceleration (ft/s
2
)
59
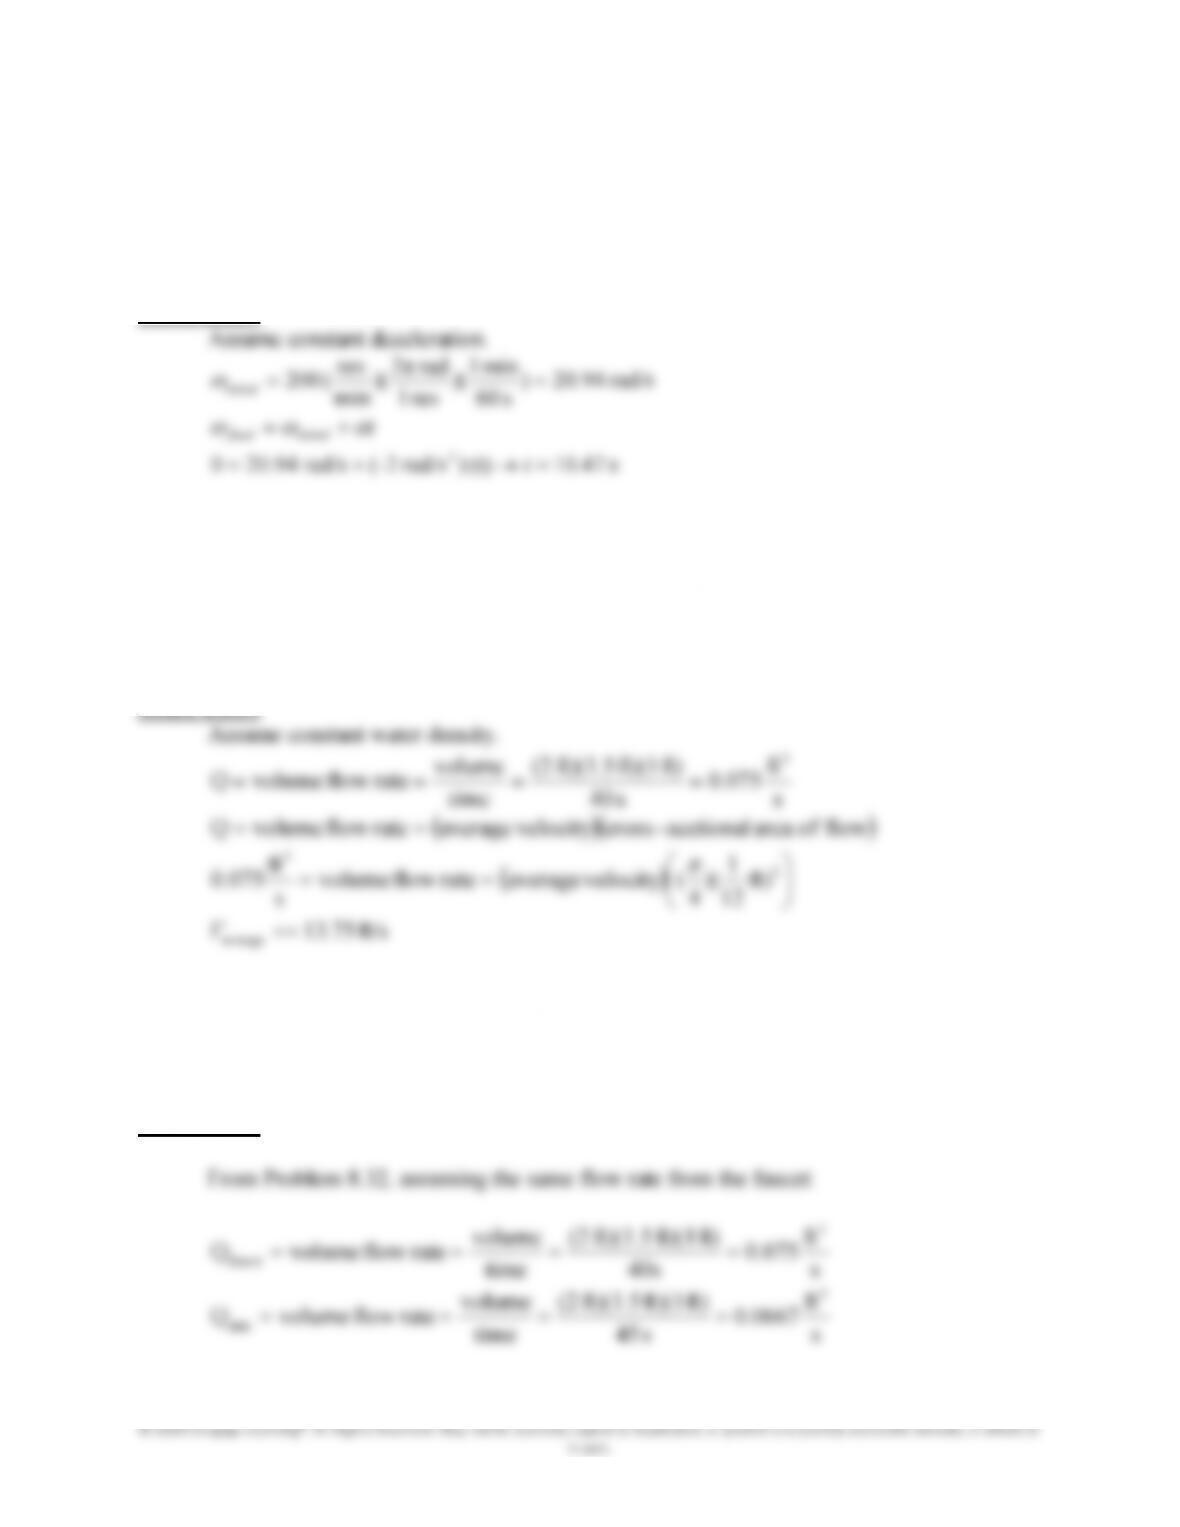
8.31 On a gusty windy day, the blades of a wind turbine are turning at a rate of 200
revolutions per minute, when suddenly brakes are applied to stop the turbine to avoid
failure. If the brakes cause a deceleration of 2 rad/s2, how long would it take for the
blades of the wind turbine to come to rest?
SOLUTION
8.32 A plugged dishwasher sink with the dimensions of 2 ft × 1.5 ft × 1 ft is being filled with
water from a faucet with an inner diameter of 1 in. If it takes 40 seconds to fill the sink to
its rim, estimate the volumetric flow of water coming out of the faucet. What is the
average velocity of water coming out of the faucet?
SOLUTION
12
4
s
average
8.33 Imagine, the plug in the sink described in Problem 8.32 leaks. If it now takes 45 seconds
to fill the sink to its rim, estimate the volumetric flow rate of the leak.
SOLUTION