0.000208
6
0.000468
13
0.000000
0
0.000130
3
7.27
w/c Ratio
Strain (m/m)
Stress
(MPa)
Secant Modulus (GPa)
= [(0.4*ult
stress)/corresponding strain]
0.5
0.000000
0
=0.4*30000000/0.00035=34.3
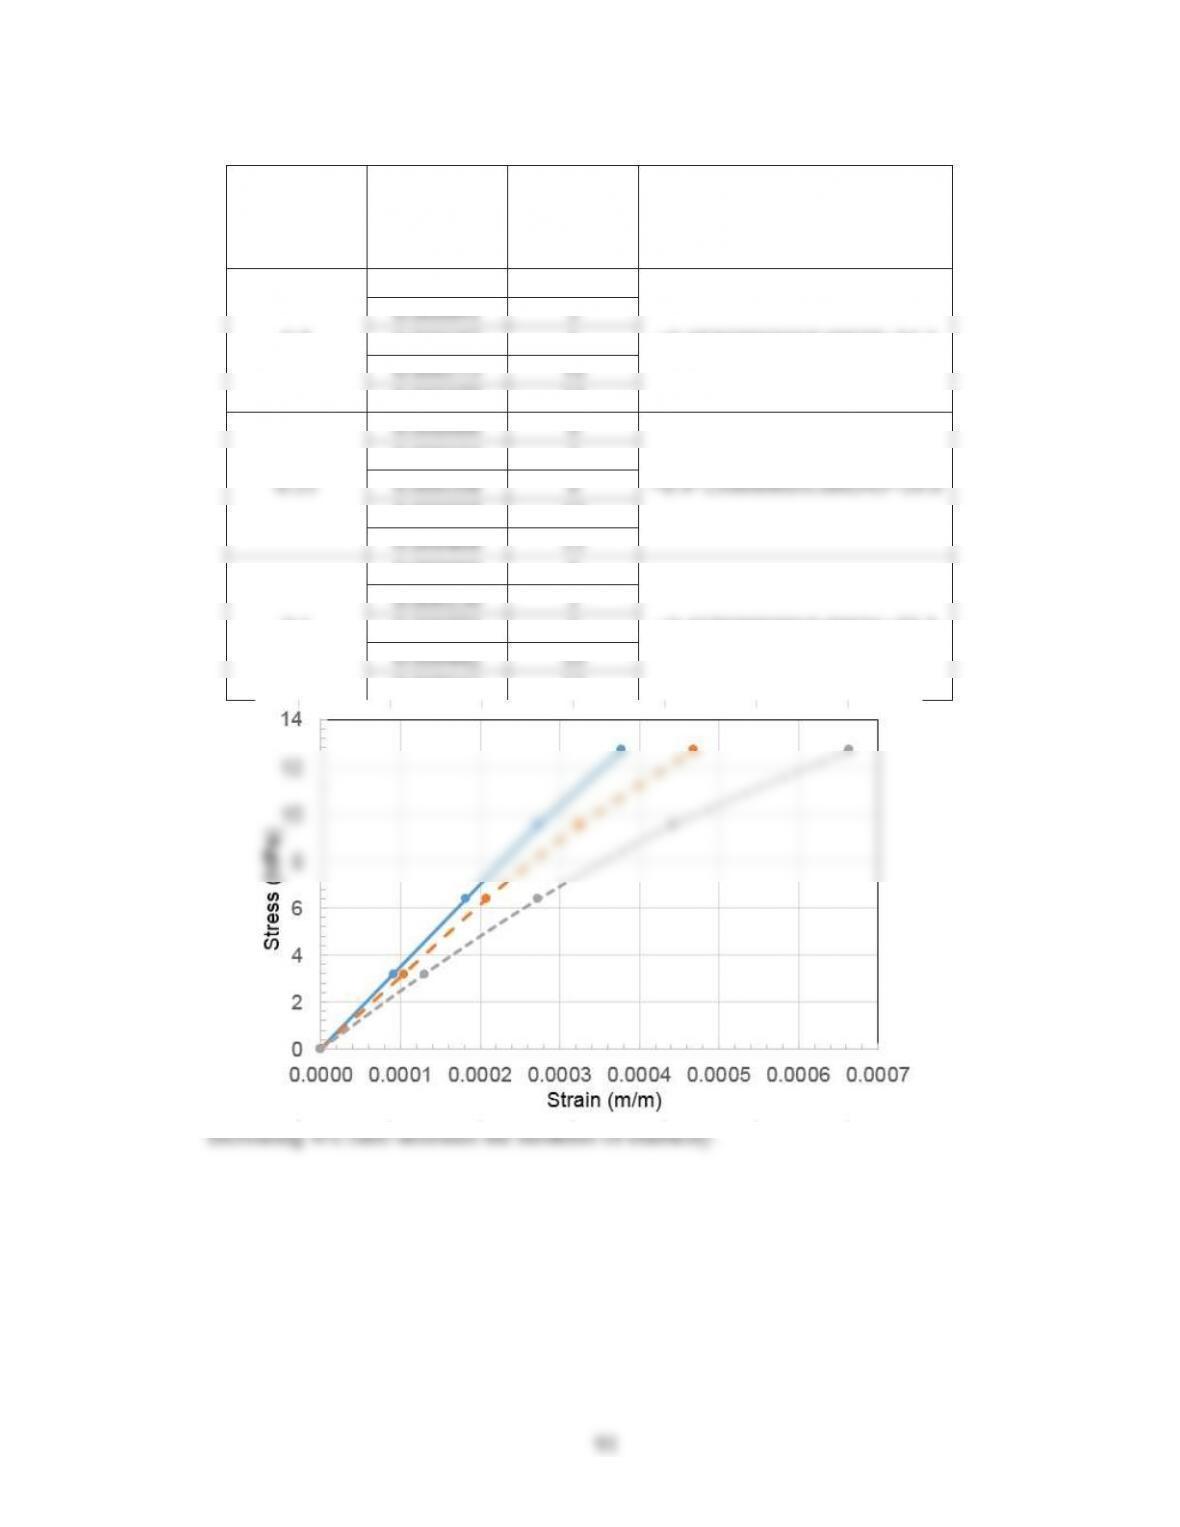
0.000091
3
0.000182
6
0.000273
10
0.000377
13
0.000000
0
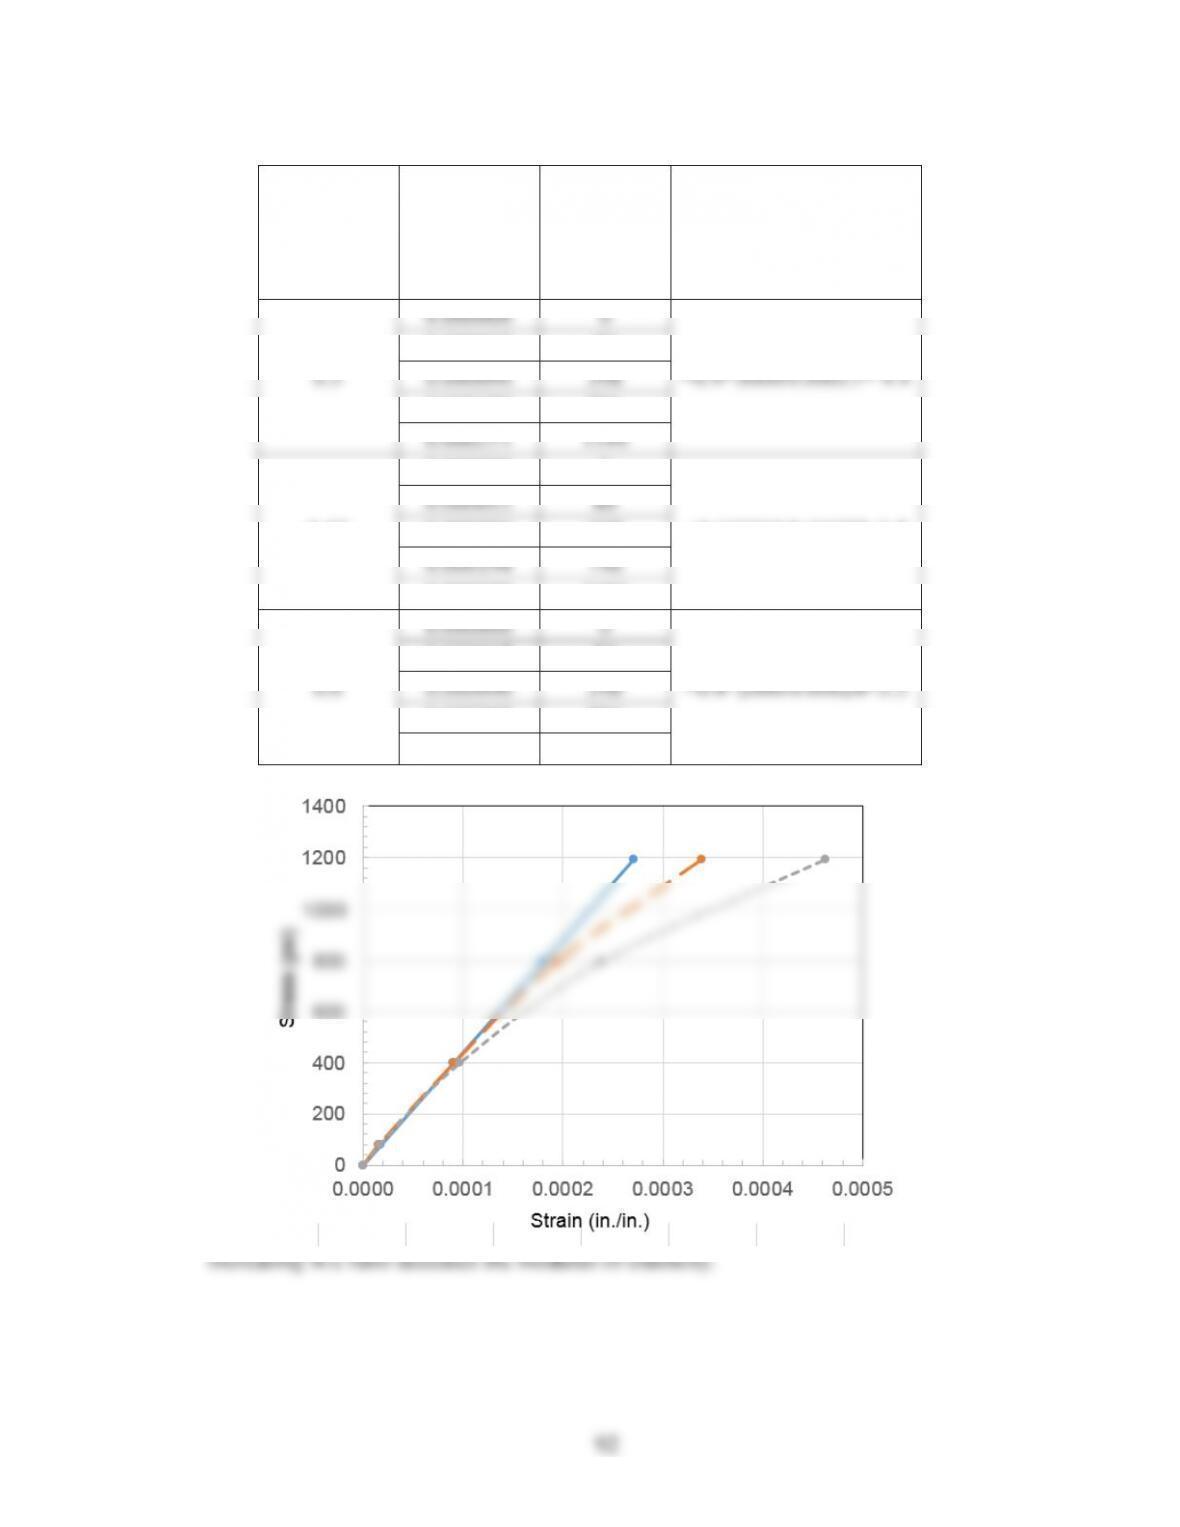
0.000104
3
0.000017
80
0.000096
0.000238
7.28.
w/c Ratio
Strain
(in./in.)
Stress (psi)
Secant Modulus (psi x
106)
= [(0.4*ult
stress)/corresponding
strain]
0.000000
0
0.000018
80
93
7.29.
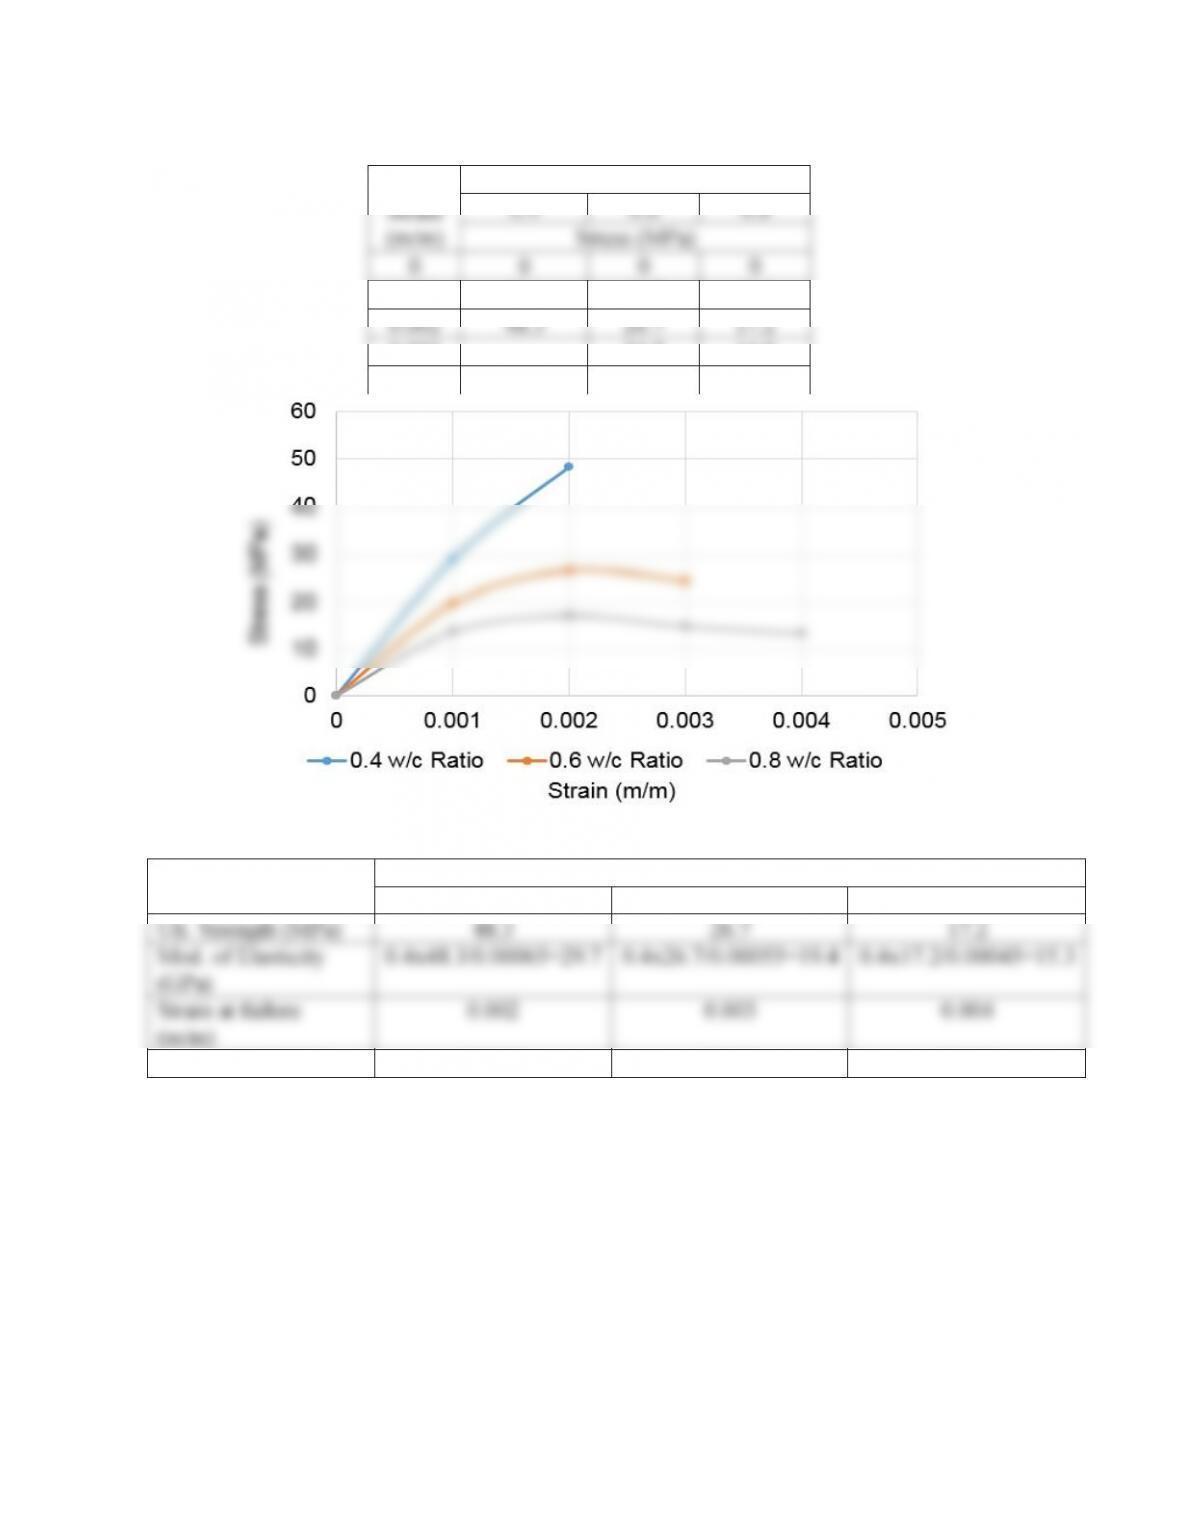
Strain
(m/m)
Water-Cement Ratio
0.4
0.6
0.8
Stress (MPa)
0
0
0
0
0.001
29.1
19.7
13.8
0.002
48.3
26.7
17.2
0.003
24.5
14.9
0.004
13.3
Property
w/c Ratio
0.4
0.6
0.8
Ult. Strength (MPa)
48.3
26.7
17.2
Mod. of Elasticity
(GPa)
0.4×48.3/0.00065=29.7
0.4×26.7/0.00055=19.4
0.4×17.2/0.00045=15.3
Strain at failure
(m/m)
0.002
0.003
0.004
Toughness (MPa)
0.055
0.06
0.05
Increasing w/c ratio decreases ultimate strength, decreases modulus of elasticity, increases
ductility, and does not largely change toughness.
94
7.30.
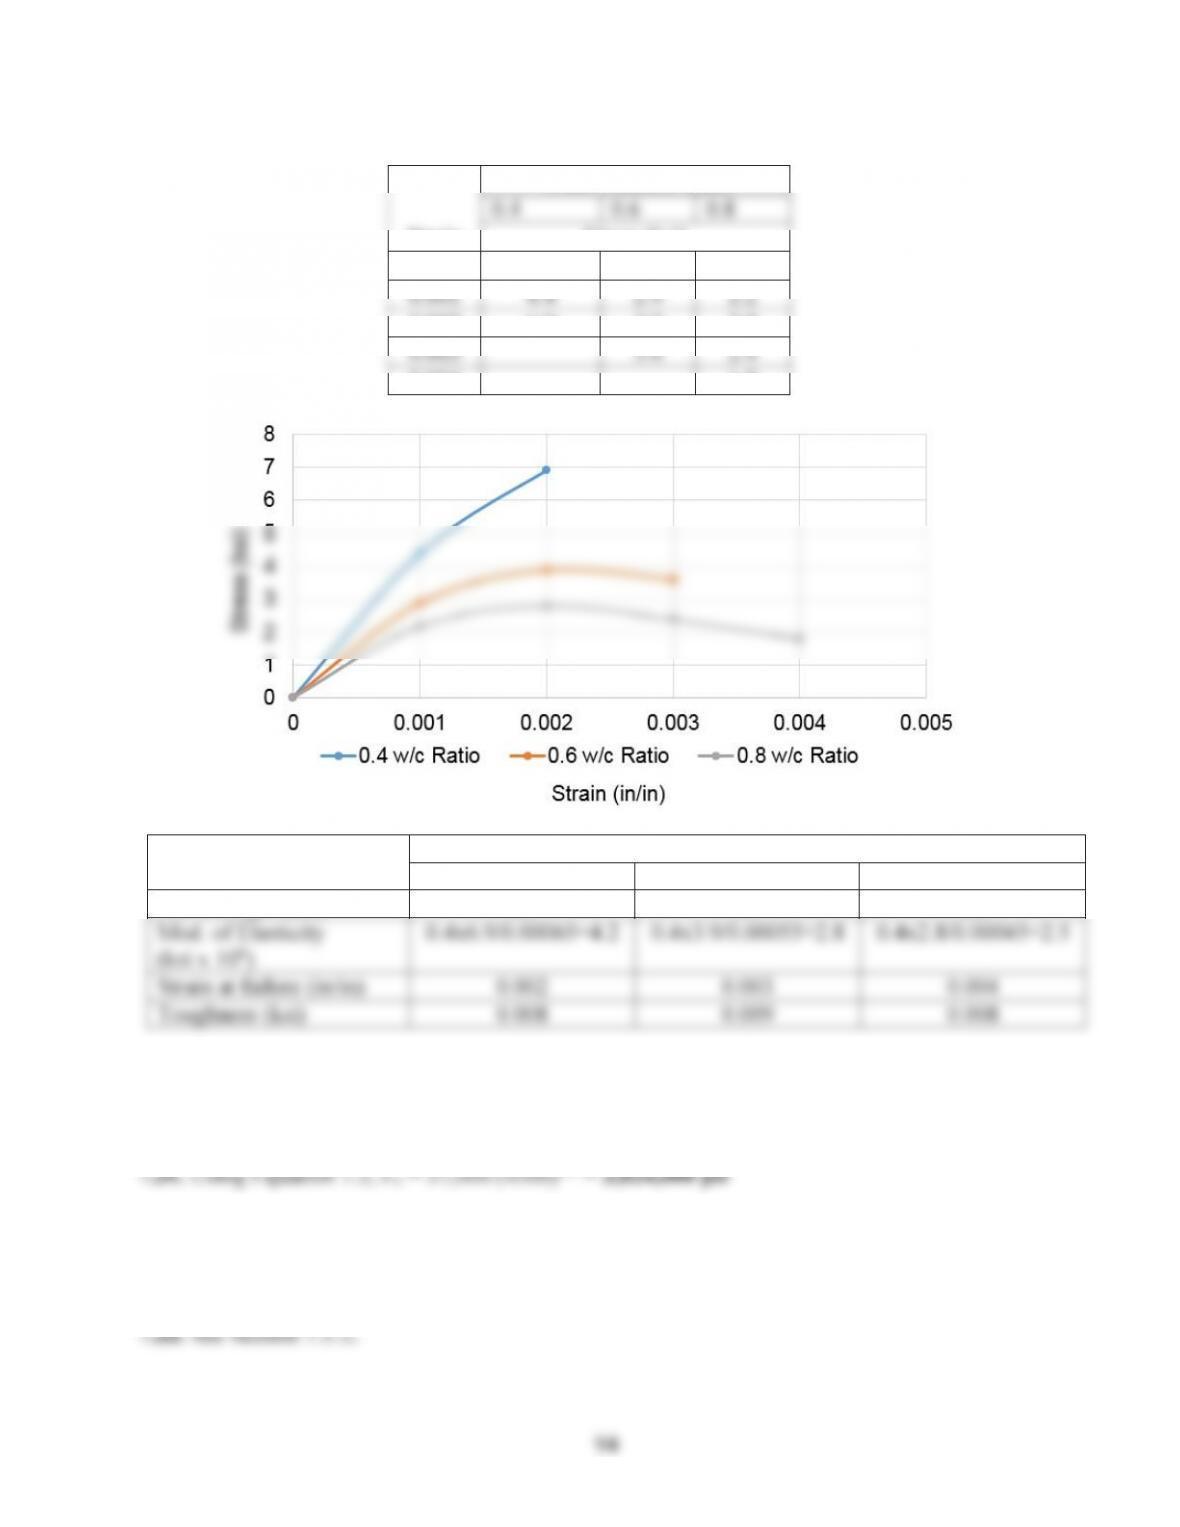
Strain
Water-Cement Ratio
0.4
0.6
0.8
Stress (ksi)
0
0
0
0
0.001
4.4
2.9
2.2
0.002
6.9
3.9
2.8
0.003
3.6
2.4
0.004
1.8
Property
w/c Ratio
0.4
0.6
0.8
Ult. Strength (ksi)
6.9
3.9
2.8
Mod. of Elasticity
(ksi x 10
)
0.4×6.9/0.00065=4.2
0.4×3.9/0.00055=2.8
0.4×2.8/0.00045=2.5
Strain at failure (in/in)
0.002
0.003
0.004
Toughness (ksi)
0.008
0.009
0.008
Increasing w/c ratio decreases ultimate strength, decreases modulus of elasticity, increases
ductility, and does not largely change toughness.
7.32. See Section 7.5.1.
2
35.6
4.75
3
35.0
4.67
7.34. P = (Vx A)/F.S. = (5000 x 12 x 12)/1.2 = 600,000 lb = 600 kips
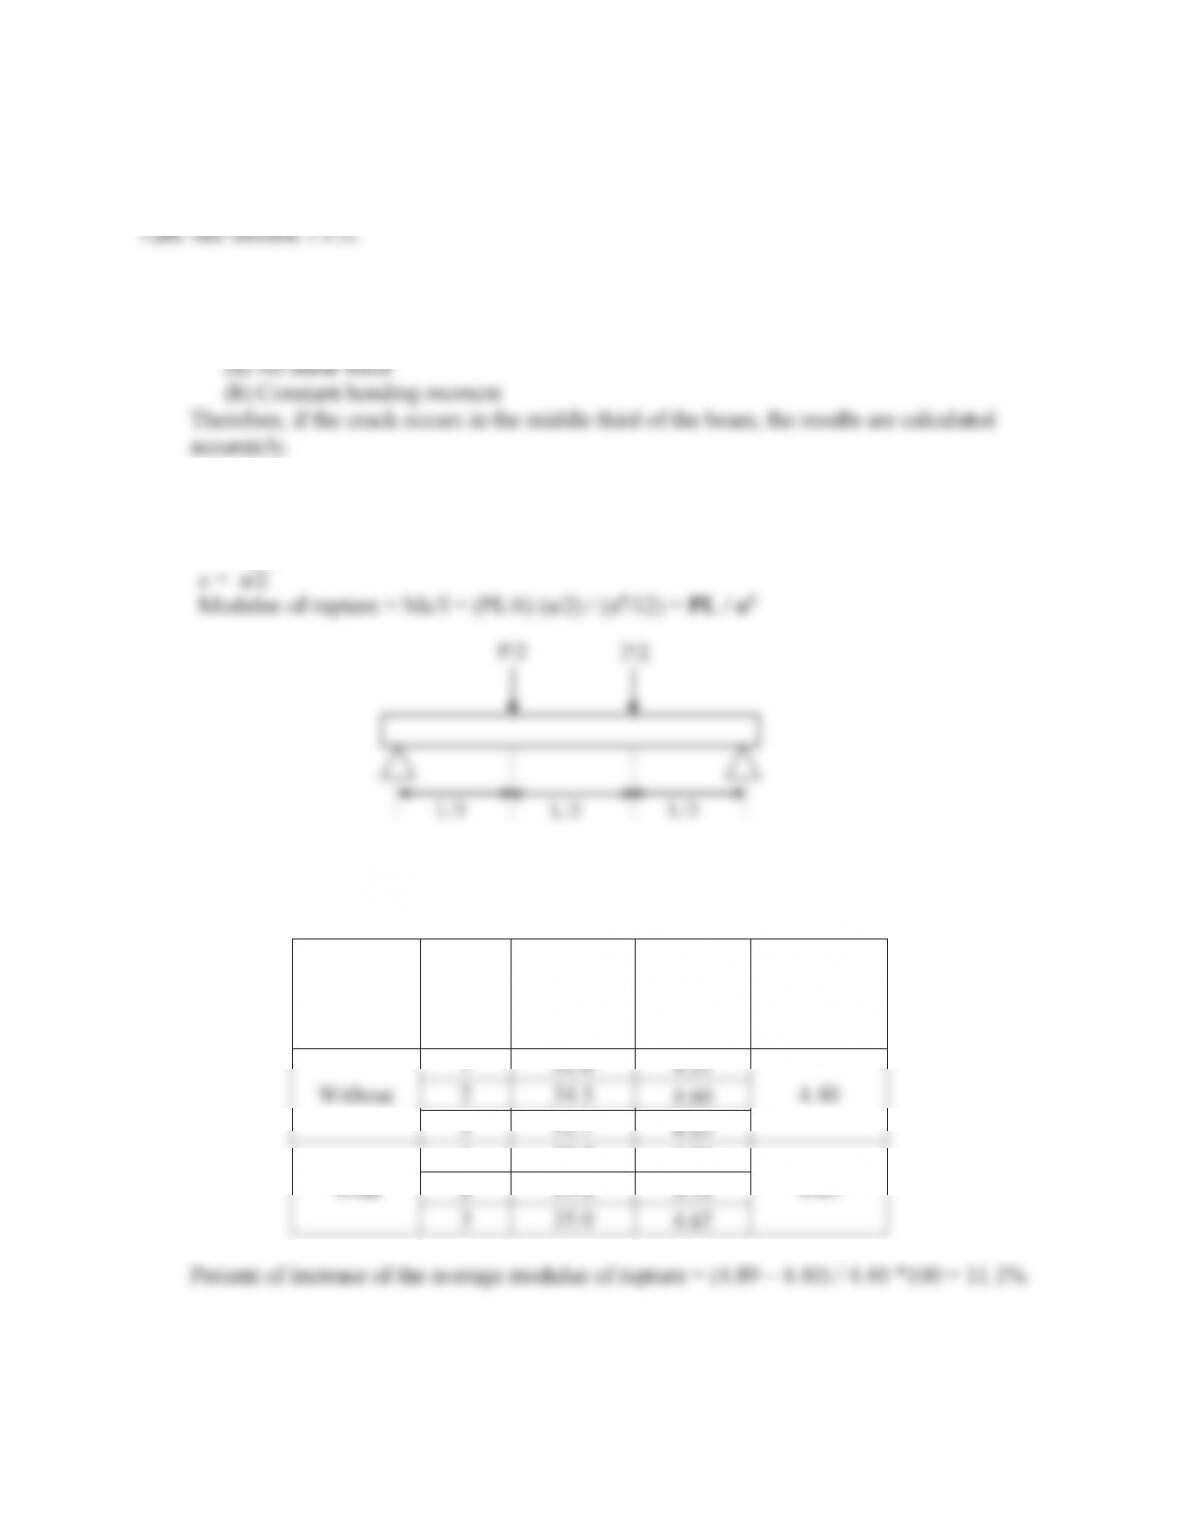
7.36. The third point loading ensures that the following two conditions occur in the middle third
of the beam:
7.37. M = (P/2) (L/3) = PL/6
I = a (a3) / 12 = a4/12
7.38. Modulus of rupture = Mc/I = (PL/6) (a/2) / (a4/12) = PL / a3
Admixture
Beam
No.
Maximum
Load (kN)
R (MPa)
Average R
(MPa)
Without
1
32.8
4.37
4.40
2
34.5
4.60
3
31.7
4.23
1
39.4
5.25
L/3
L/3
L/3
P/2
P/2
96
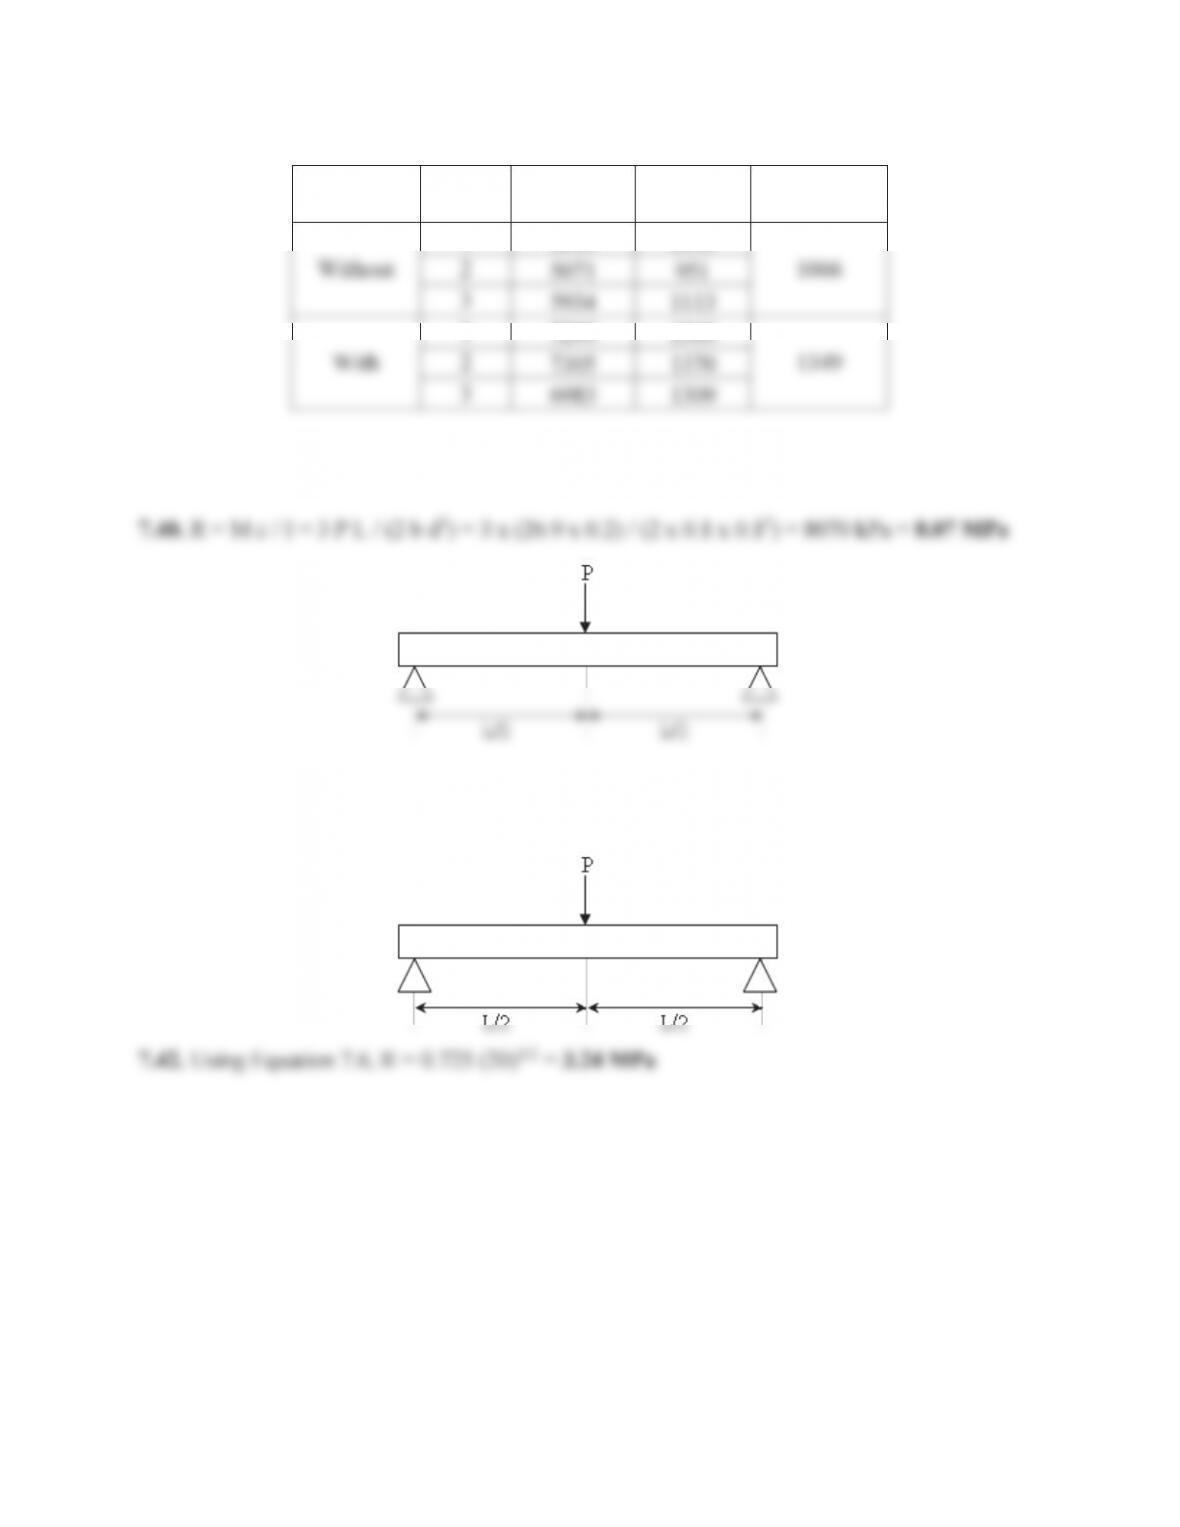
7.39.
Admixture
Beam
No.
Maximum
Load (lb)
R (ksi)
Average R
(ksi)
Without
1
6044
1133
1066
2
5071
951
3
5934
1113
With
1
7299
1369
1349
2
7305
1370
3
6983
1309
Percent of increase of the average modulus of rupture = (1349–1066) / 1066 *100 = 26.5%
7.41. R = M c / I = 3 P L / (2 b d2) = 3 x (6,032 x 8) / (2 x 4 x 42) = 1,131 psi
97
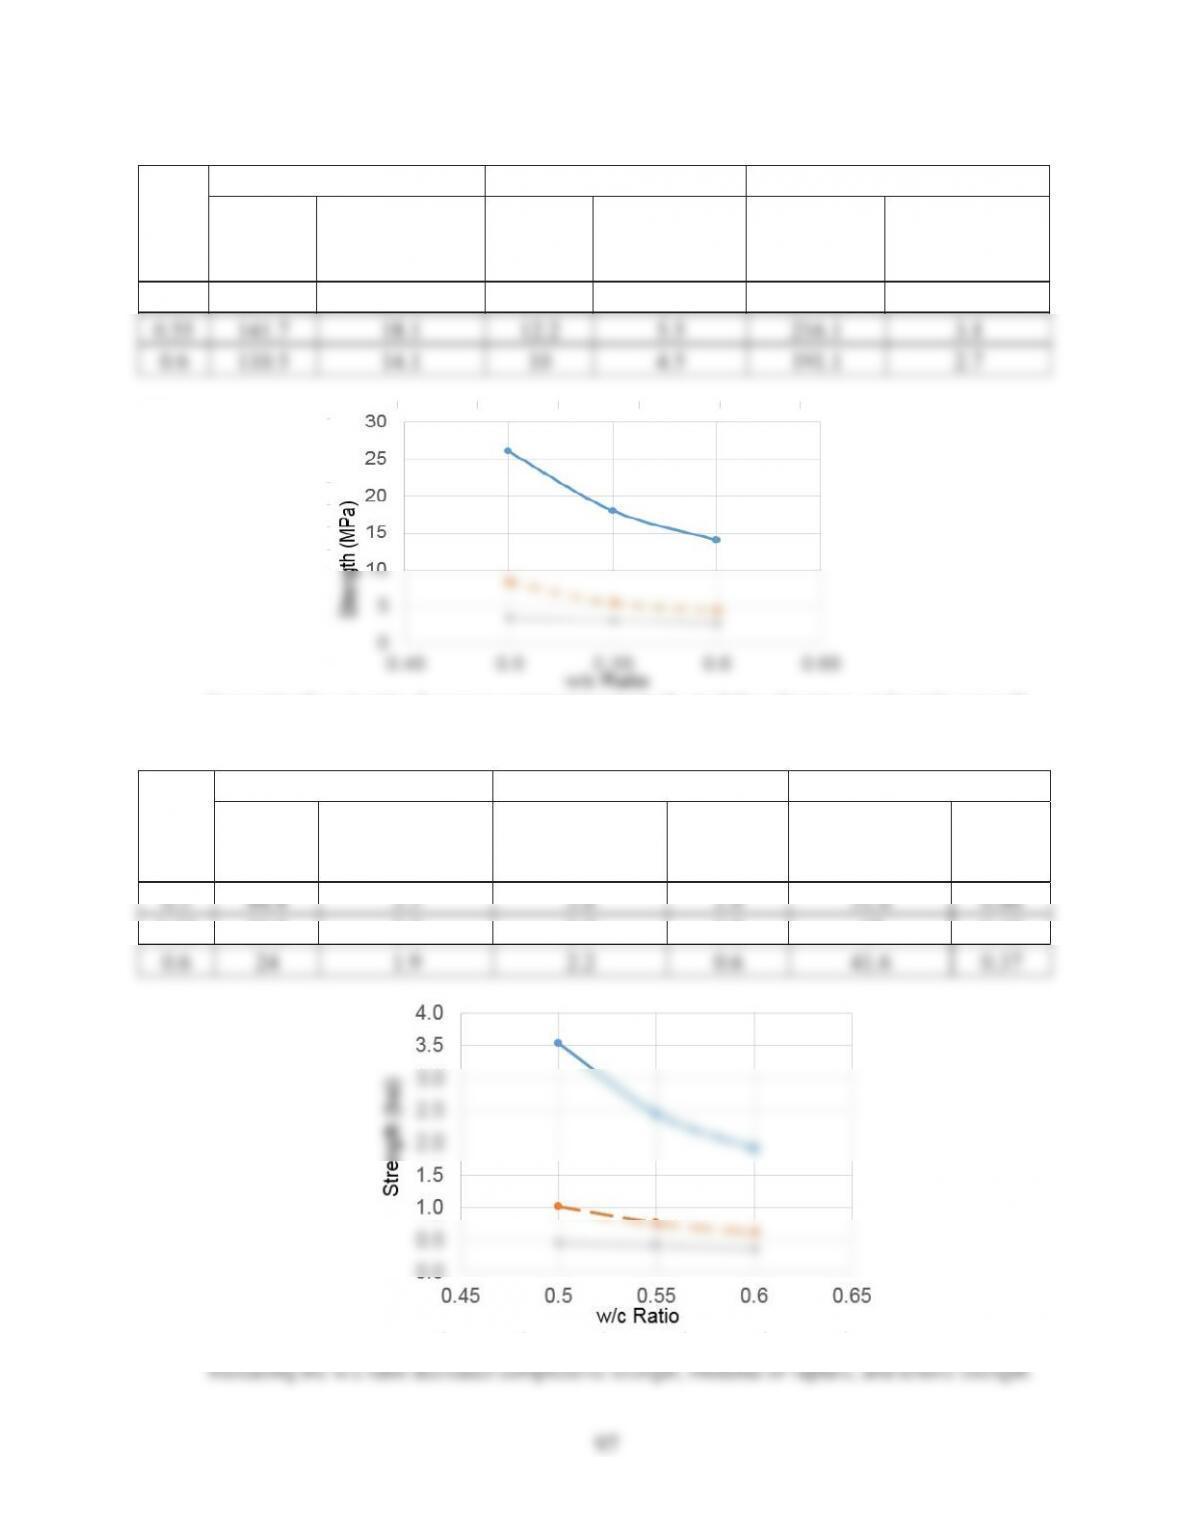
7.43.
w/c
Ratio
Compressive Strength Test
Flexure Test
Split Tension Test
Failure
Load
(kN)
Comp Strength
(MPa)
Failure
Load
(kN)
Modulus of
Rupture
(MPa)
Failure
Load (kN)
Tensile
Strength (MPa)
0.5
204.2
26.0
18.6
8.4
237.2
3.4
0.55
141.7
18.1
12.2
5.5
216.1
3.1
0.6
110.5
14.1
10
4.5
191.1
2.7
Increasing the w/c ratio decreases compressive strength, modulus of rupture, and tensile strength.
7.44.
w/c
Ratio
Compressive Strength Test
Flexure Test
Split Tension Test
Failure
Load
(kips)
Compressive
Strength (ksi)
Failure Load
(kips)
Modulus
of Rupture
(ksi)
Failure Load
(kips)
Tensile
Strength
(ksi)
0.5
44.4
3.5
3.6
1.0
51.6
0.46
0.55
30.8
2.5
2.7
0.8
47
0.42
0.6
24
1.9
2.2
0.6
41.6
0.37
98
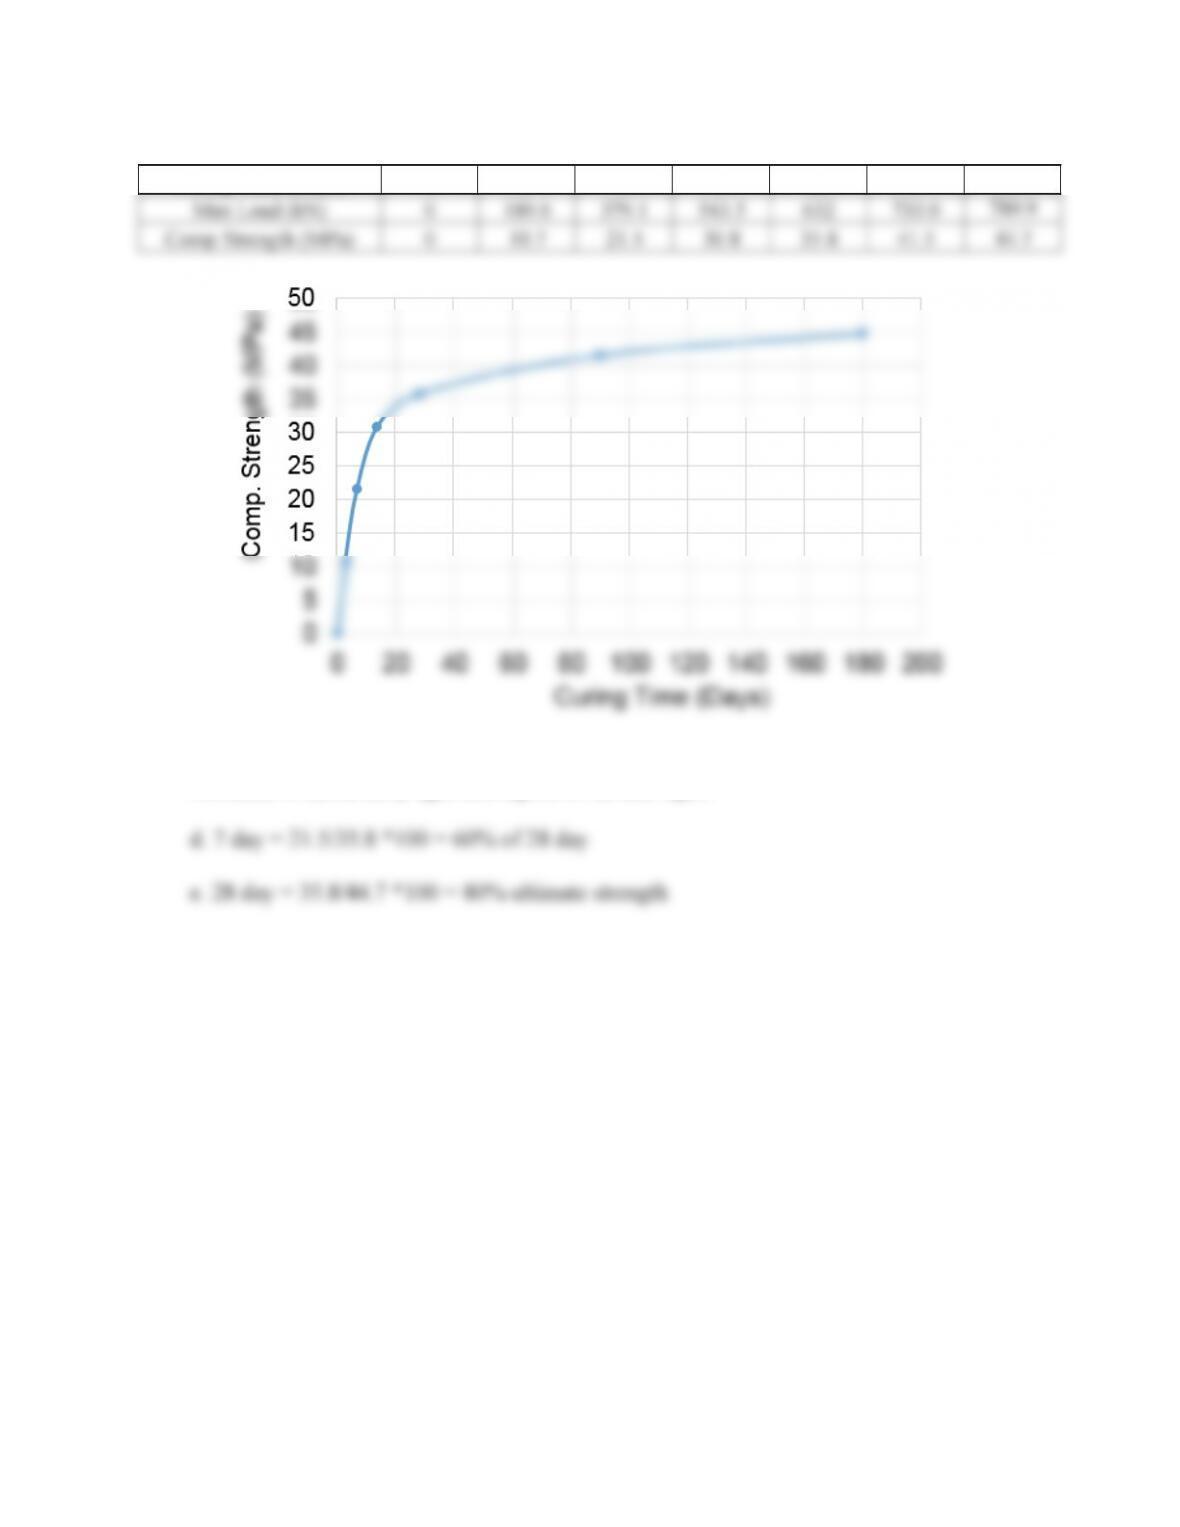
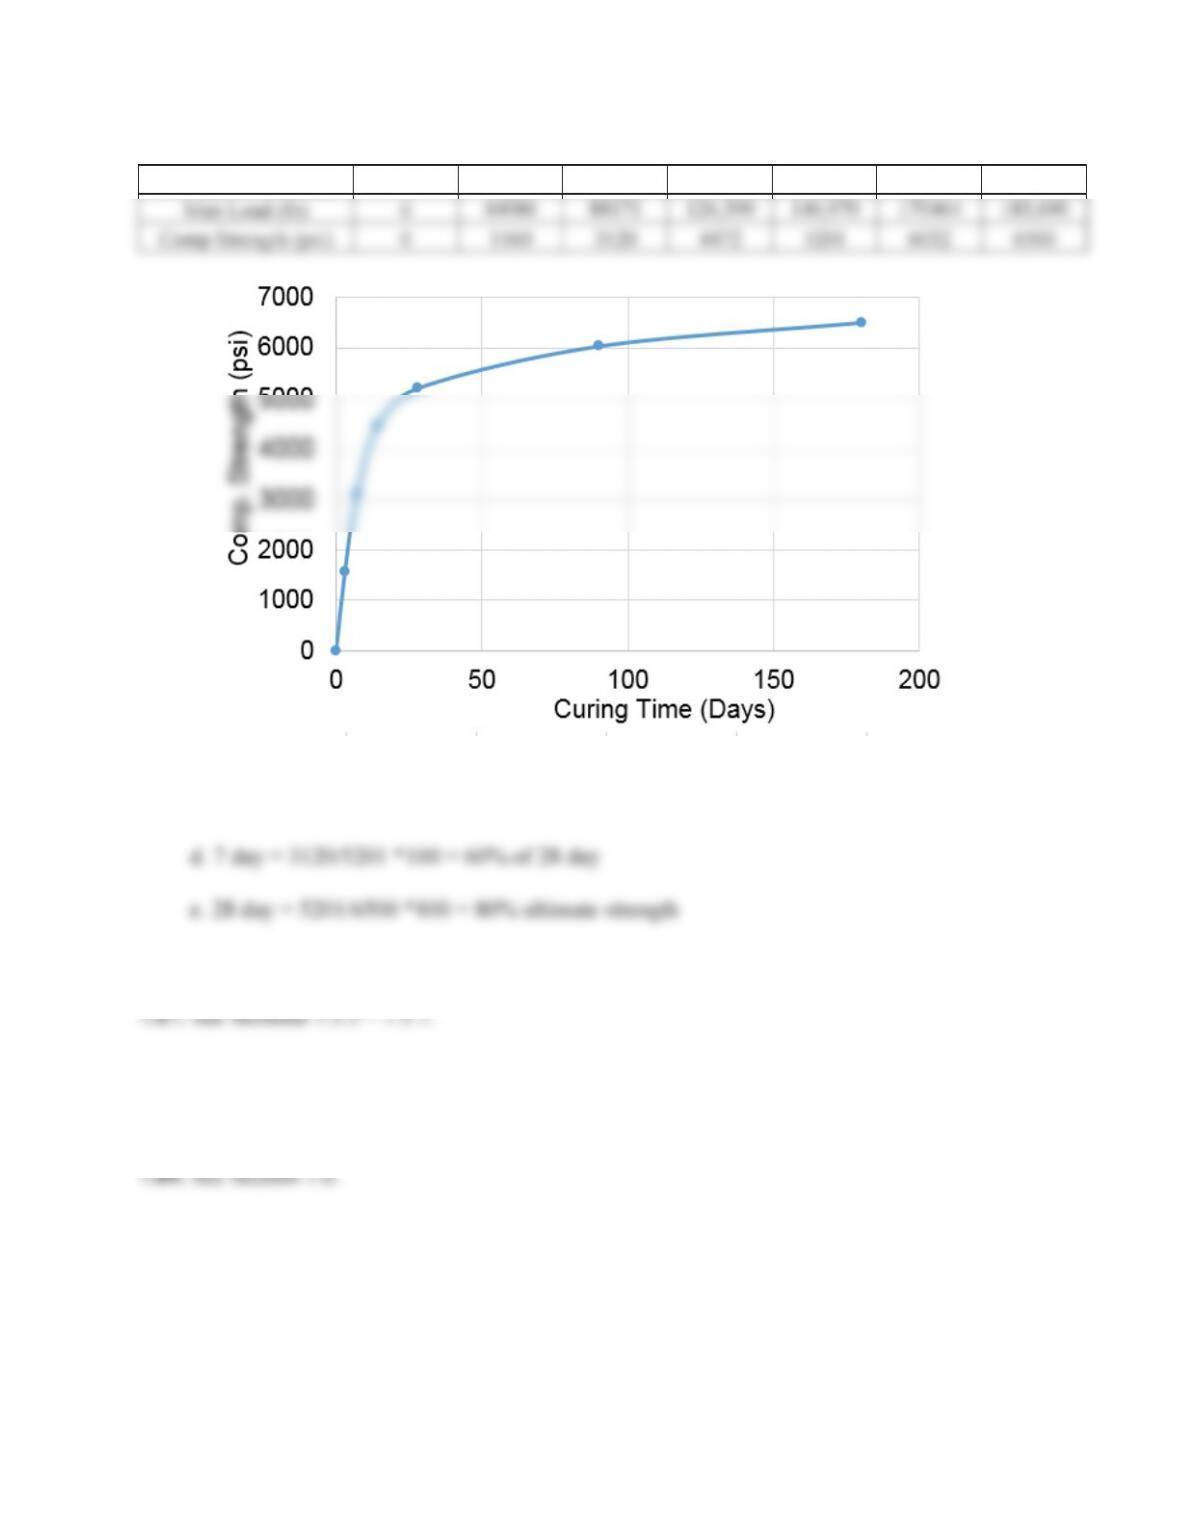
7.45.
Curing Time (Days)
0
3
7
14
28
90
180
Max Load (kN)
0
189.6
379.1
543.5
632
733.0
789.9
Comp Strength (MPa)
0
10.7
21.5
30.8
35.8
41.5
44.7
c. Increasing curing time increases the compressive strength. The compressive strength
increases is fast at early ages and tapers off at later ages.
99
7.46.
Curing Time (Days)
0
3
7
14
28
90
180
Max Load (lb)
0
44086
88171
126,390
146,970
170464
183,690
Comp Strength (psi)
0
1560
3120
4472
5201
6032
6500
c. Increasing curing time increases the compressive strength. The compressive strength
increase is fast at early ages and tapers off at later ages.
7.48. See Section 7.5.7.
7.50. See Section 7.6.1.
7.51. See Section 7.6.2.
100
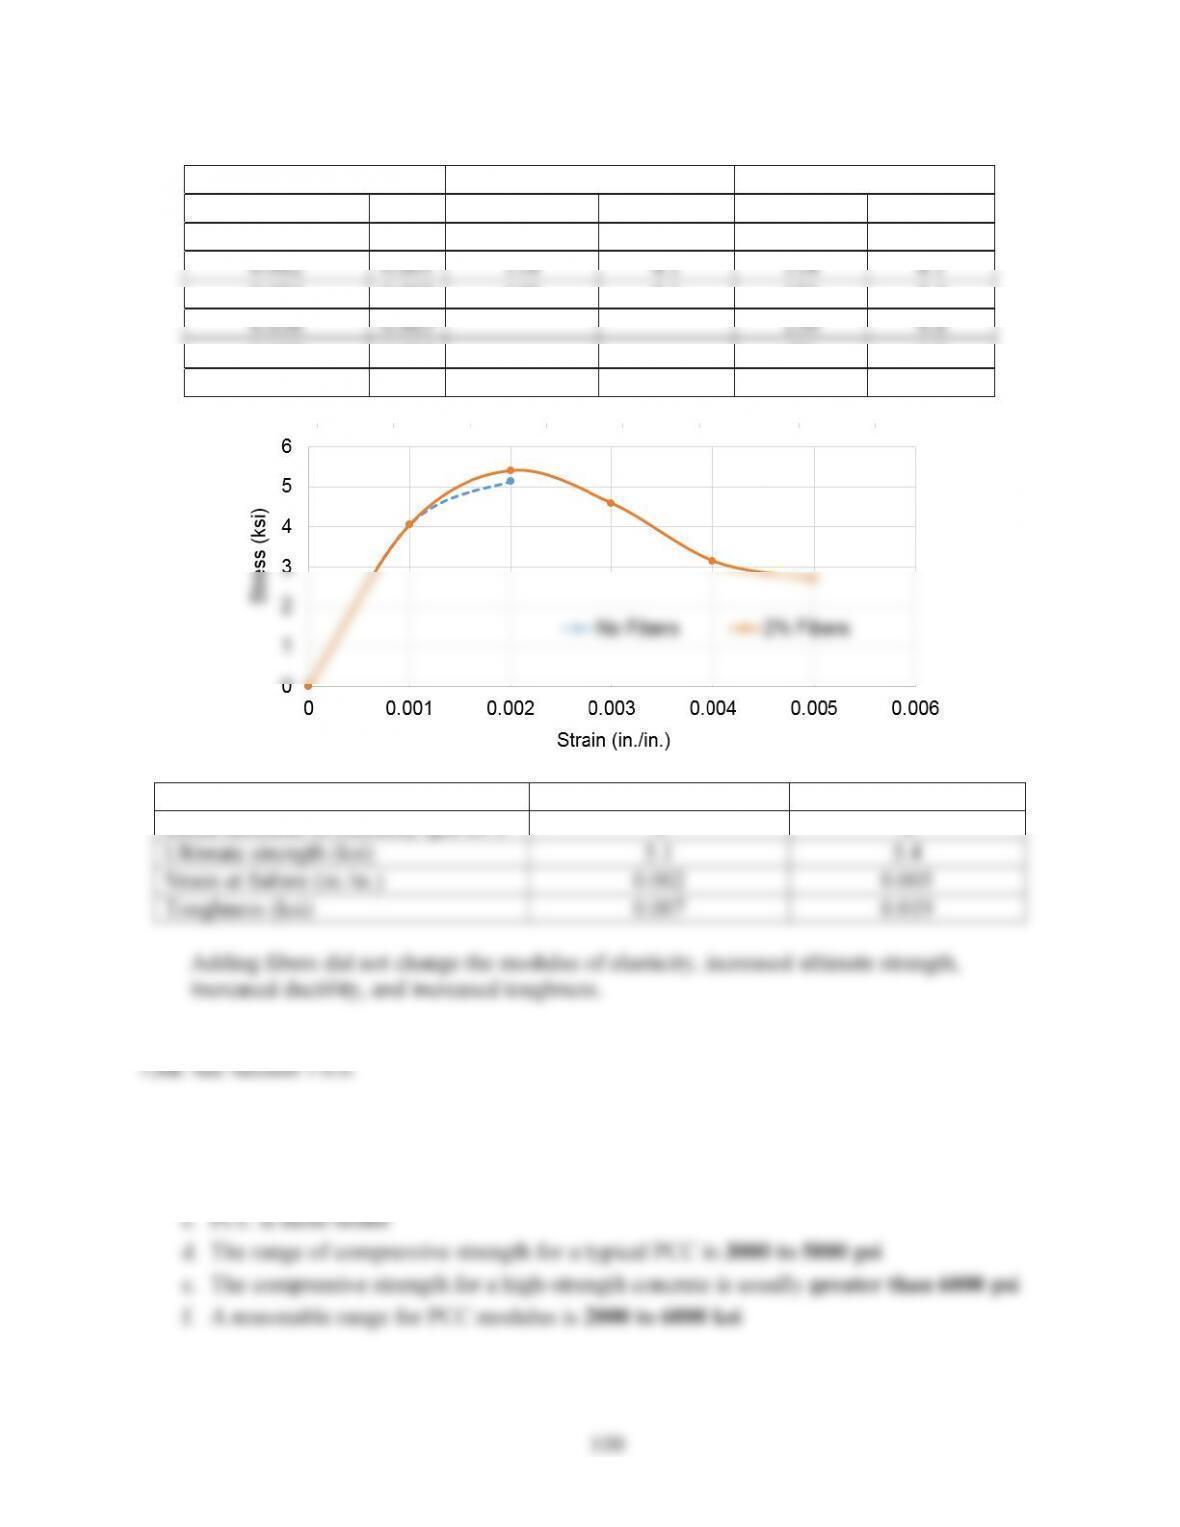
% Fiber
0
2
Defo. (in.)
Strain
Load (kips)
Stress (ksi)
Load (kips)
Stress (ksi)
0
0
0
0.0
0
0.0
0.012
0.001
114
4.1
114
4.1
0.024
0.002
145
5.1
153
5.4
0.036
0.003
130
4.6
0.048
0.004
89
3.2
0.060
0.005
76
2.7
% Fibers
0
2
Initial modulus of elasticity (psi 106)
4
4
Ultimate strength (ksi)
5.1
5.4
Strain at failure (in./in.)
0.002
0.005
Toughness (ksi)
0.007
0.019
Adding fibers did not change the modulus of elasticity, increased ultimate strength,
increased ductility, and increased toughness.
7.53. See Section 7.6.6.
7.54
D
mild steel is stronger than PCC
E
mild steel has a higher modulus
101
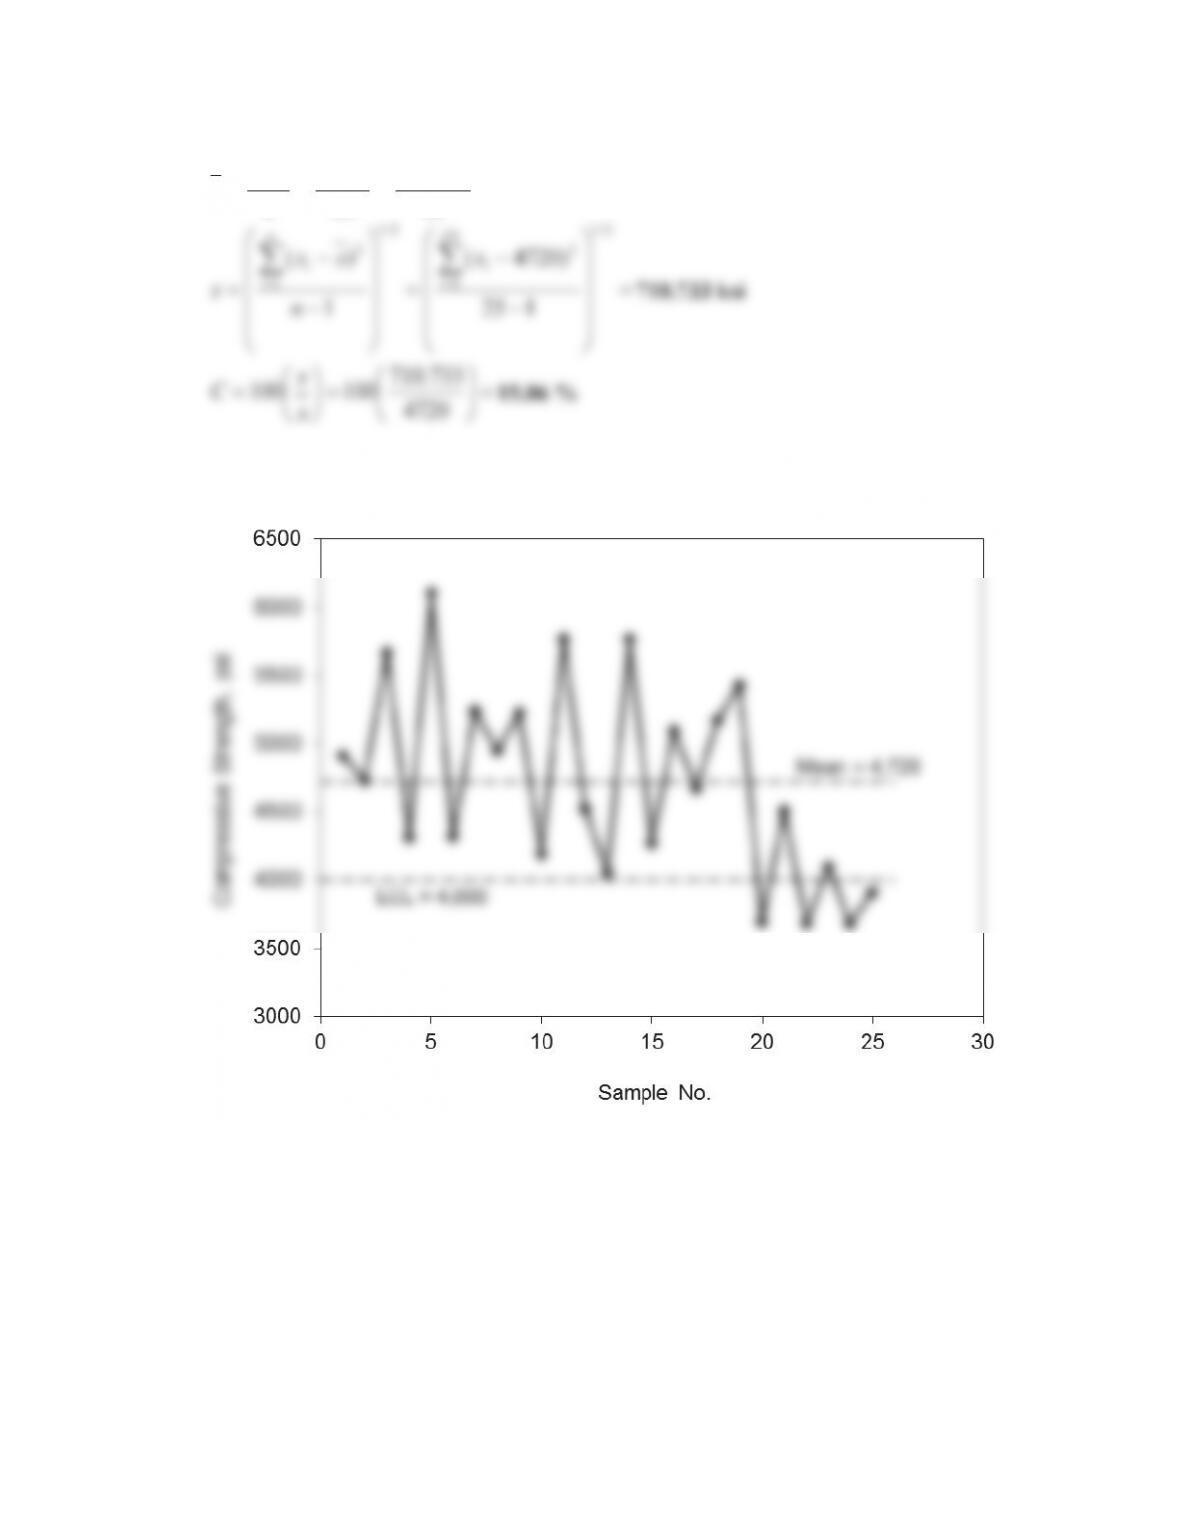
7.55. a.
¦
¦
25
000,118
25
526
11 i
i
n
i
ix
n
x
x
4720 ksi
¸
¸
·
¨
¨
§
¸
¸
·
¨
¨
§
¦¦
2
/
1
25
1
2
2
/
1
1
2
)4720(
)(
i
i
n
i
ix
xx
¹
©
¹
©
b. The flow chart is shown below.
The results of the first 19 sample are higher than the minimum requirement. There was
a sudden change starting with sample 20, indicating that there is something wrong in the
material which needs to be corrected.