71
CHAPTER 6. PORTLAND CEMENT, MIXING WATER AND ADMIXTURES
6.2. See Section 6.1
6.4. See Section 6.5
6.6. See Table 6.1
6.8. See Section 6.6
6.10. See Section 6.7
6.12. See Section 6.10.1
6.13. D Free water (above the SSD condition) (above absorption level)
E 0.4 – 0.5
6.15. See Figure 6.8.
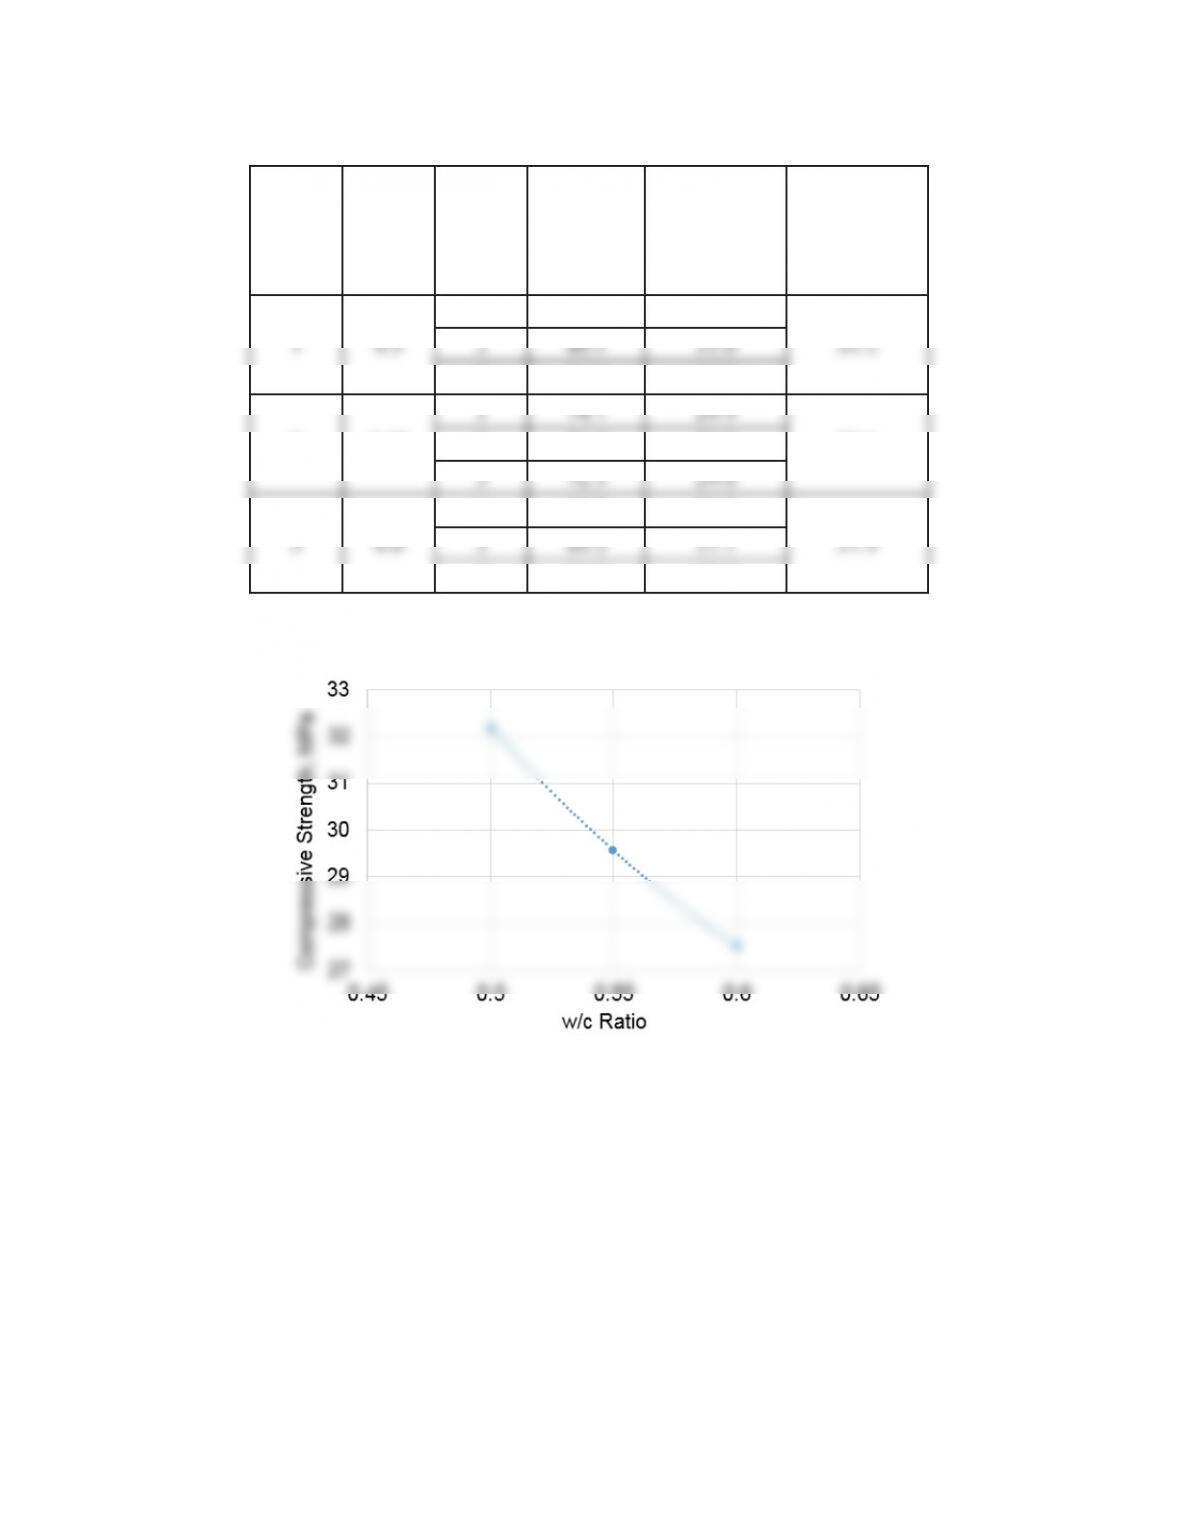
M
ix
No.
w/c
Ratio
Cube
No.
Maximum
Load
(kN)
Compressive
Strength
(MPa)
Average
Compressive
Strength
(MPa)
2
80.1
32.0
1
79.4
31.8
3
81.9
32.8
2
0.55
1
74.7
29.9
29.6
2
74.5
29.8
3
72.5
29.0
1
65.8
26.3
73
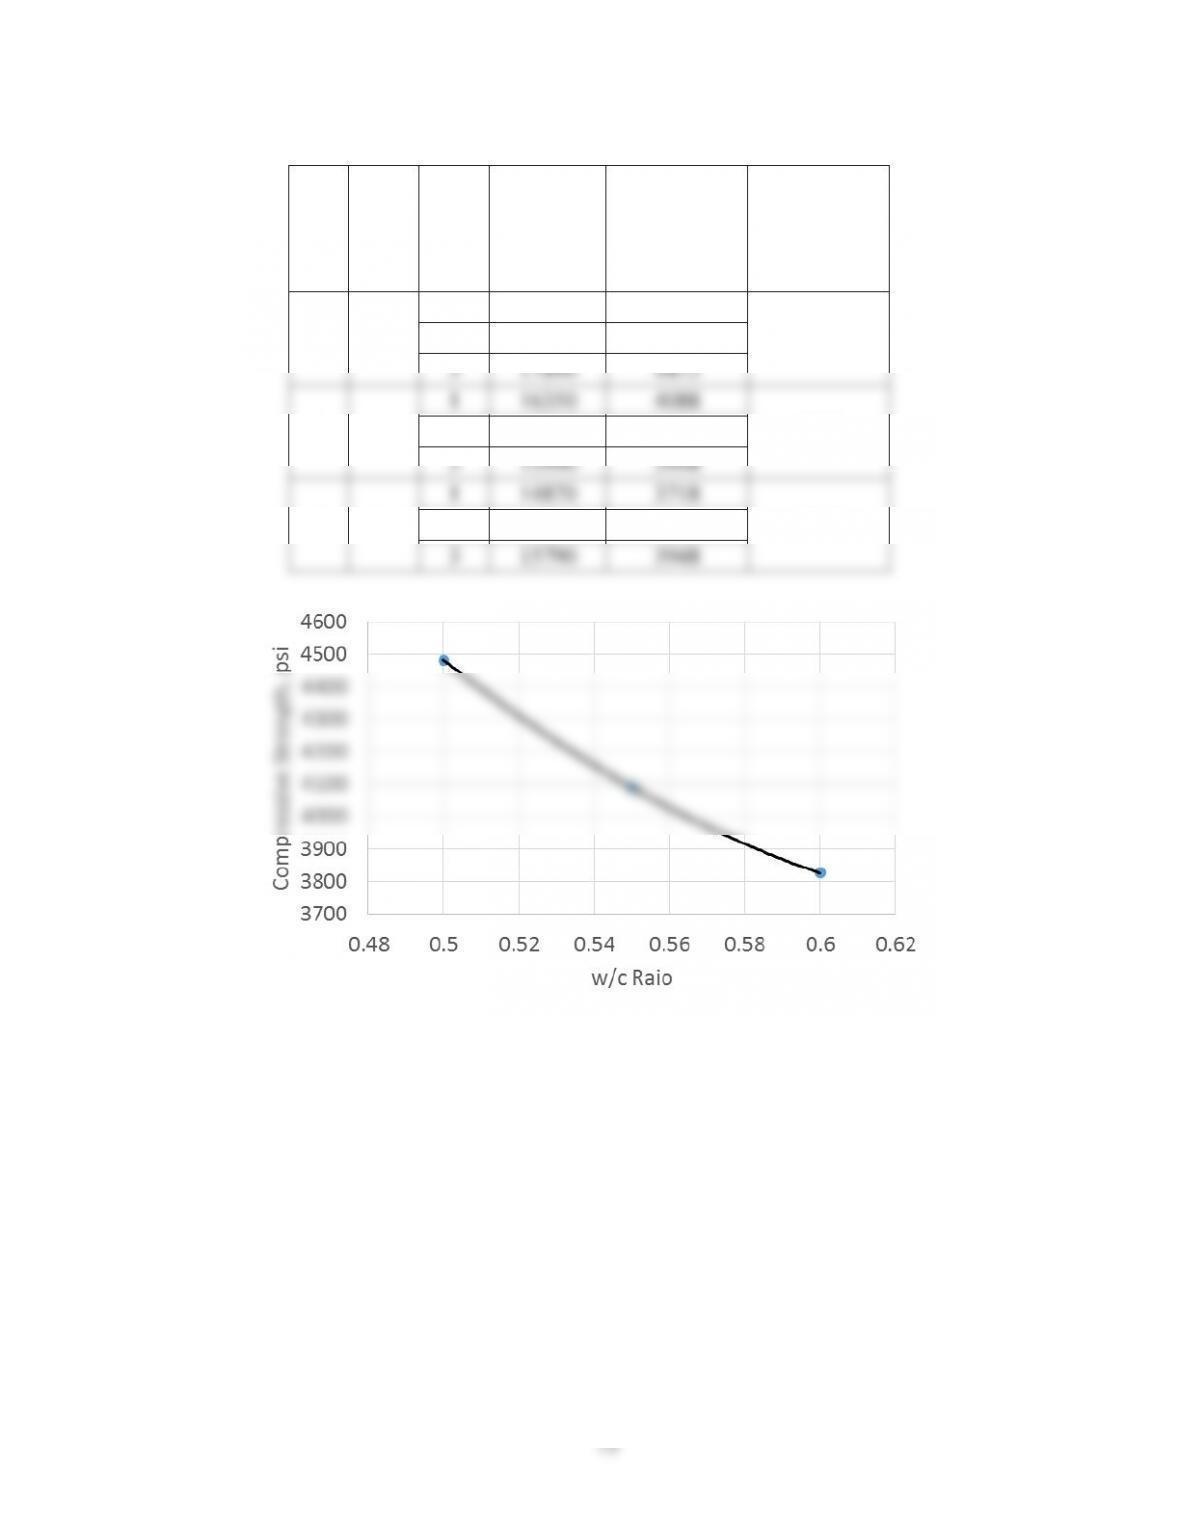
Mix
No.
w/c
Ratio
Cube
No.
Maximum
Load (lb)
Compressive
Strength
(psi)
Average
Compressive
Strength
(psi)
1
0.5
1
17640
4410
4483
2
18270
4568
3
17890
4473
2
0.55
1
16350
4088
4090
2
16740
4185
3
15990
3998
3
0.6
1
14870
3718
3827
2
15260
3815
3
15790
3948
Increasing w/c ratio decreases the compressive strength of the cubes.
74
The two batches are expected to have about the same compressive strength since they have
the same w/c ratio.
See Section 6.9.
6.22. a. Average strength using non-potable water = 14,386 / (2 x 2) = 3,597 psi
b. The set time measured by the Vicat test should not change significantly.
6.23. Average strength of mortar cubes with non-potable average =16,267 / (2 x 2) =4.067 psi
Average strength of mortar cubes with potable average = 17,667 / (2 x 2) = 4,417 psi
6.24. Average failure load of mortar cubes with non-potable average = 6,909 kg.
Average failure load of mortar cubes with potable average = 7,512 kg.
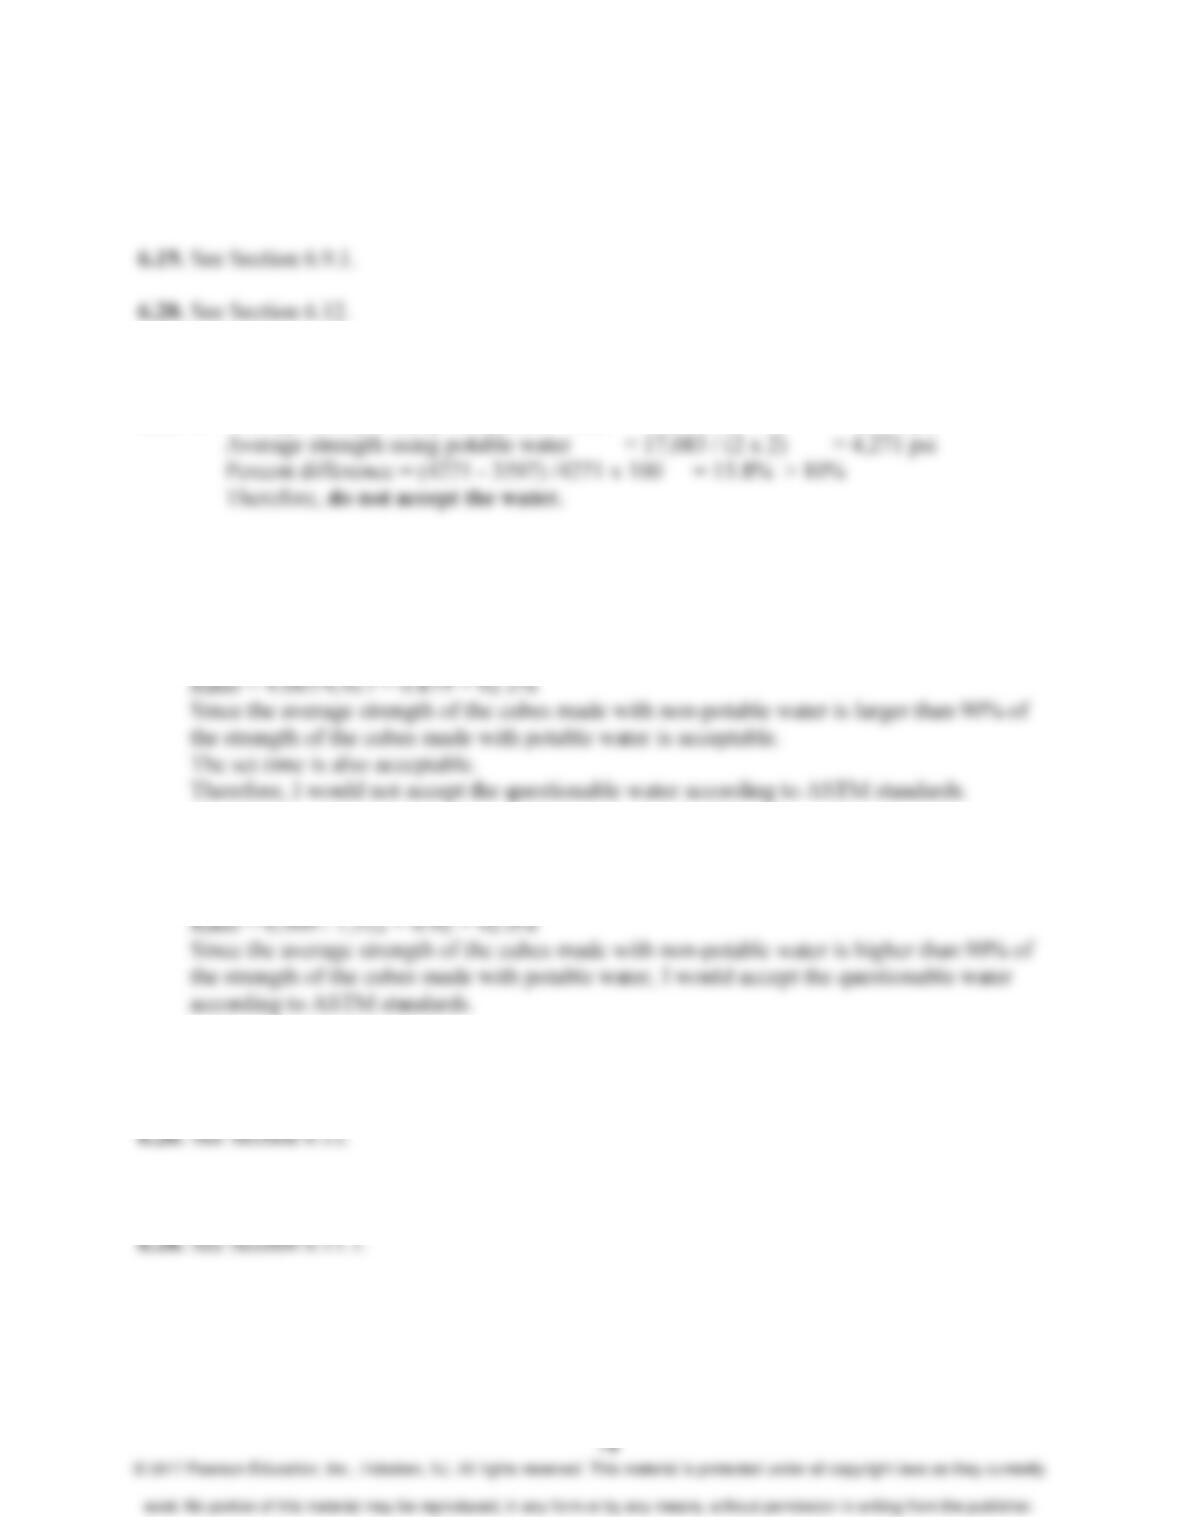
6.25. See Section 6.10.2
6.27. See Section 6.11.1
6.29. See Section 6.11.2
6.30. See Section 6.11.2
75
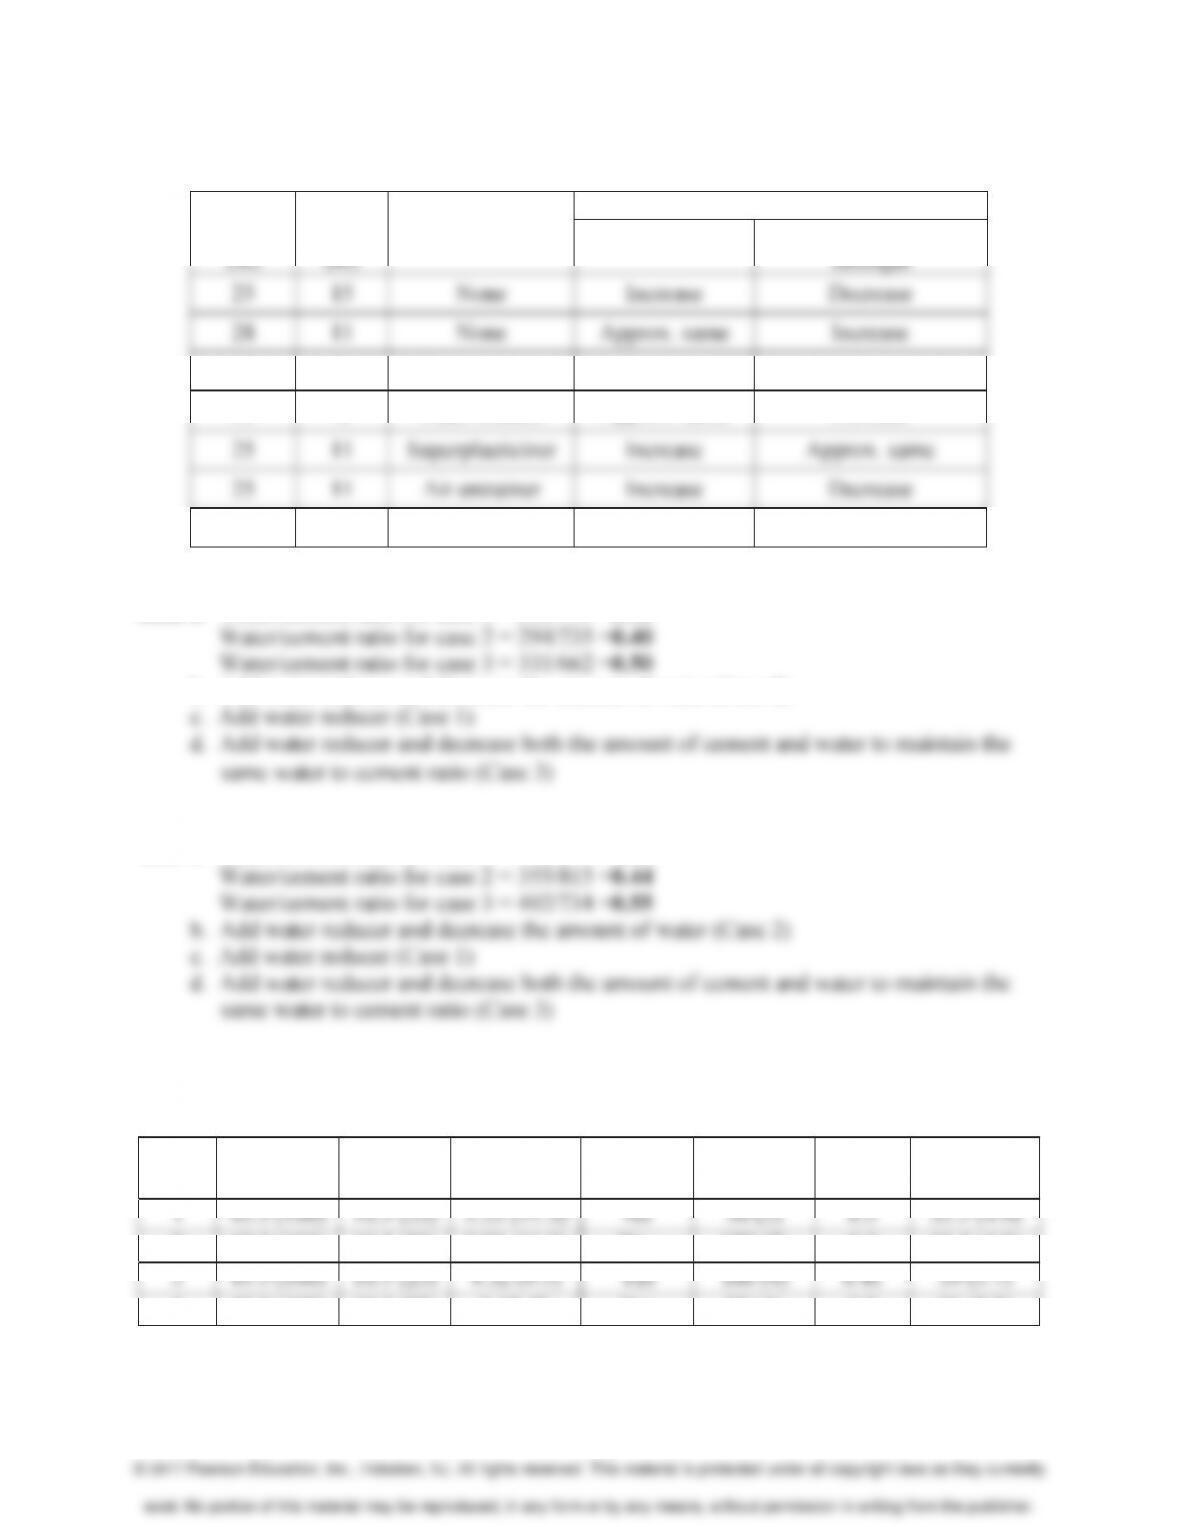
6.31.
Cement
(lb)
Water
(lb)
Admixture
What will happen?
Workability
Ultimate Compressive
Strength
25
15
None
Increase
Decrease
28
11
None
Approx. same
Increase
25
11
Water reducer
Increase
Approx. same
25
8
Water reducer
Approx. same
Increase
25
11
Superplasticizer
Increase
Approx. same
25
11
Air entrainer
Increase
Decrease
25
11
Accelerator
Approx. same
Approx. same
6.32. a. Water/cement ratio for case 1 = 368/735 =0.50
b. Add water reducer and decrease the amount of water (Case 2)
6.33. a. Water/cement ratio for case 1 = 446/815 =0.55
6.34.
Mix
No.
Aggregate,
kg (lb)
Cement,
kg (lb)
Water, kg
(lb)
Water
Reducer?
Slump,
mm (in.)
w/c
Ratio
f
c
’, MPa
(ksi)
1
45.5 (100)
10.5 (23)
5.23 (11.5)
No
50 (2)
0.5
33.5 (4.9)
2
45.5 (100)
10.5 (23)
5.23 (11.5)
Yes
175 (7)
0.5
33.5 (4.9)
3
45.5 (100)
10.5 (23)
4.32 (9.5)
Yes
100 (4)
0.41
39 (5.7)
4
45.5 (100)
10.5 (23)
3.18 (7)
Yes
25 (1)
0.3
51 (7.2)
76
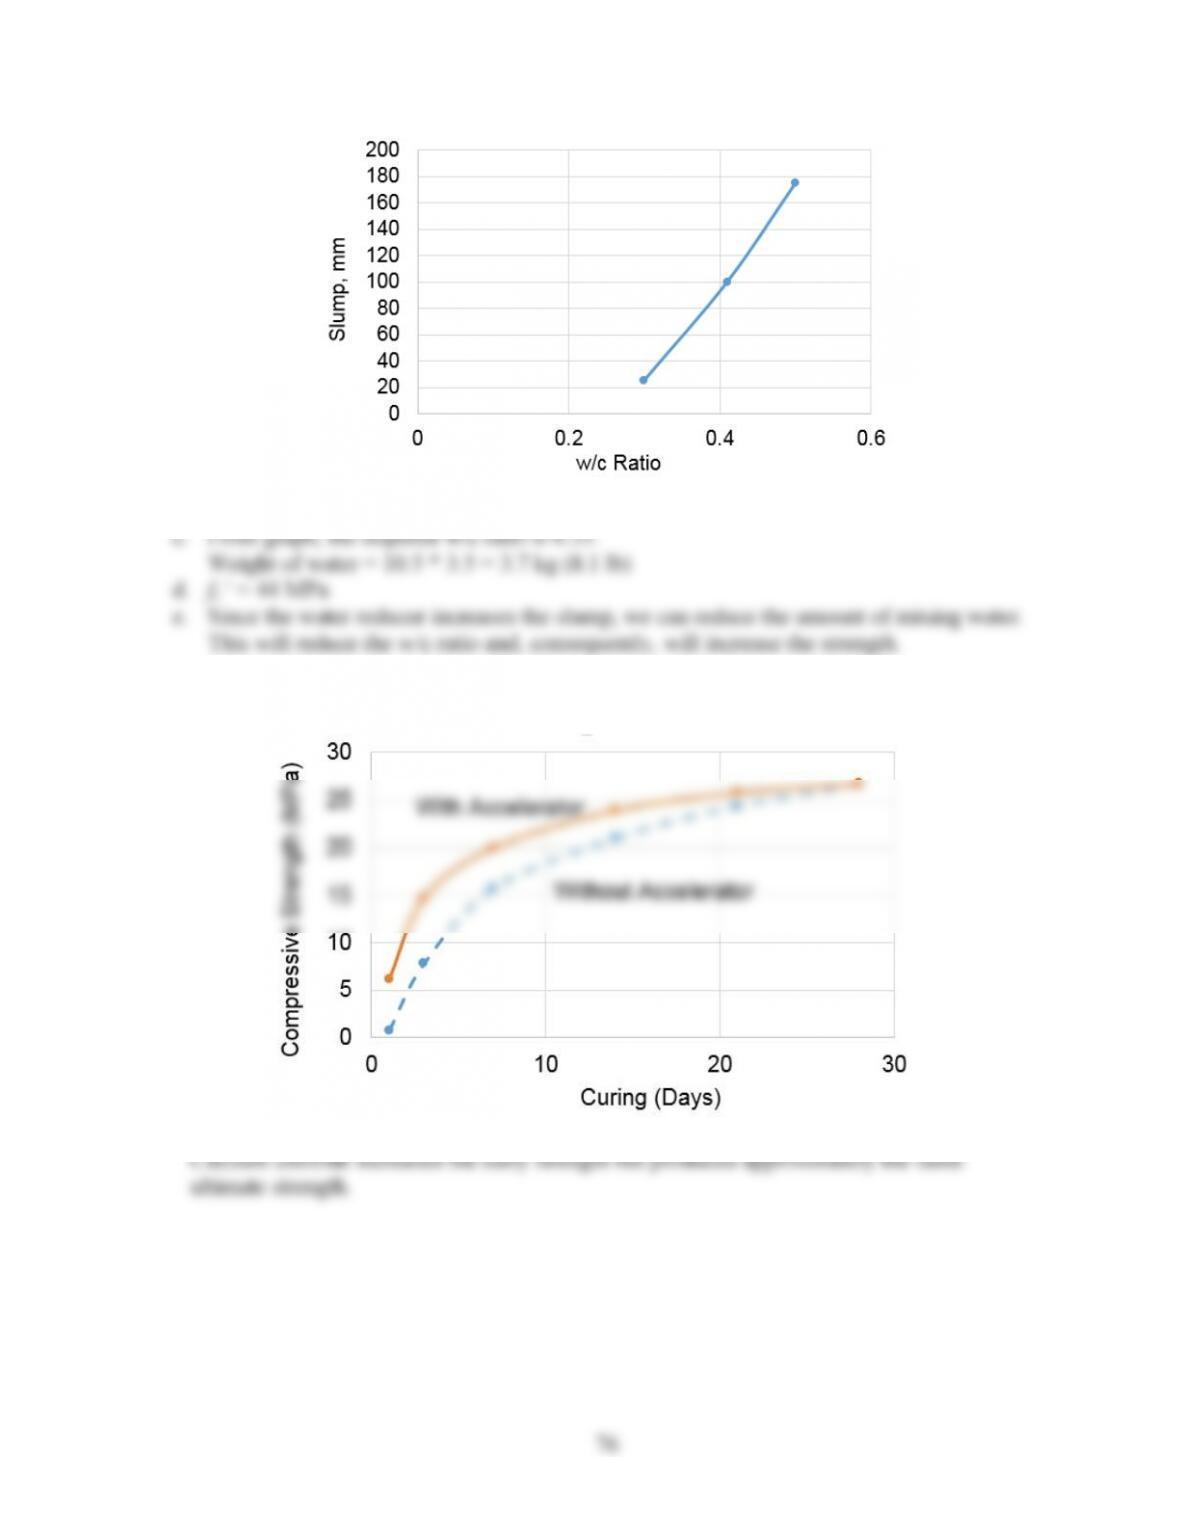
c. From graph, the required w/c ratio is 0.35.
Weight of water = 10.5 * 3.5 = 3.7 kg (8.1 lb)
d. fc’ = 44 MPa
e. Since the water reducer increases the slump, we can reduce the amount of mixing water.
This will reduce the w/c ratio and, consequently, will increase the strength.
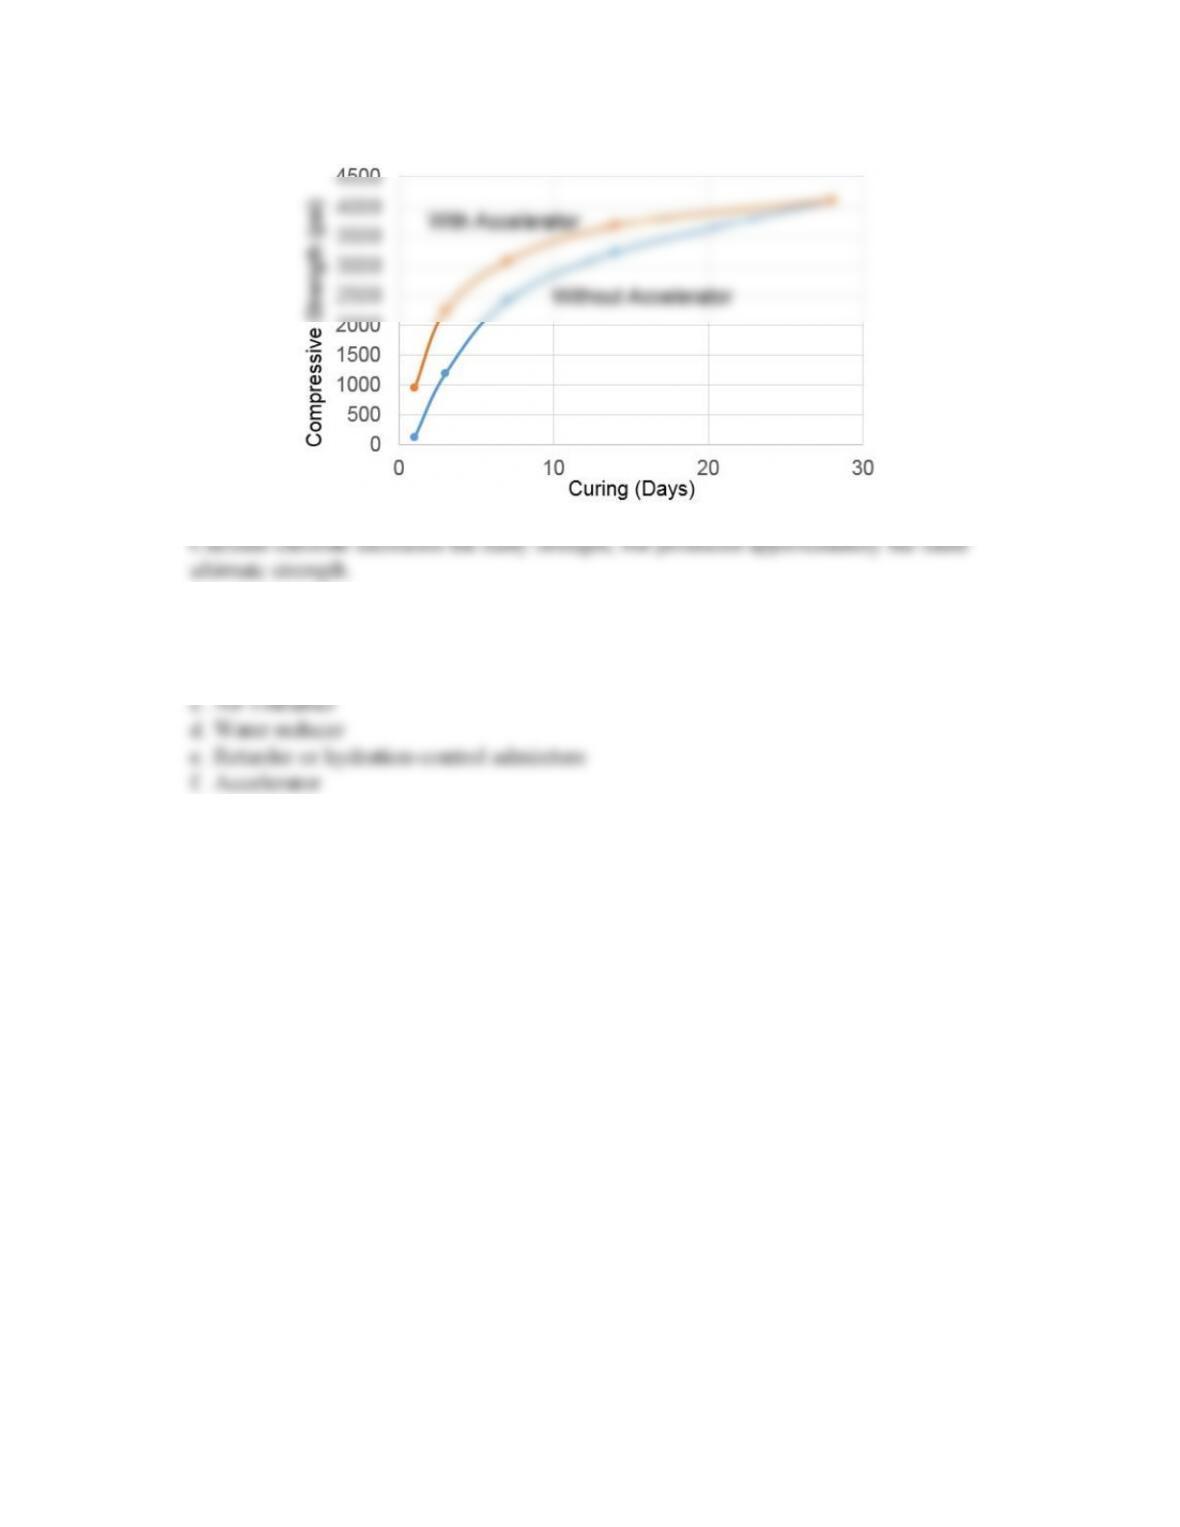
6.35
77
6.36.
6.37. a. Hydration-control admixture (stabilizer)
b. Retarder
6.38. See Section 6.12.
78
6.39. Ho:P1<P2(One-tail test)
H1:
P1tP
2
We reject Ho. Therefore, the admixture does not increase the strength.
79
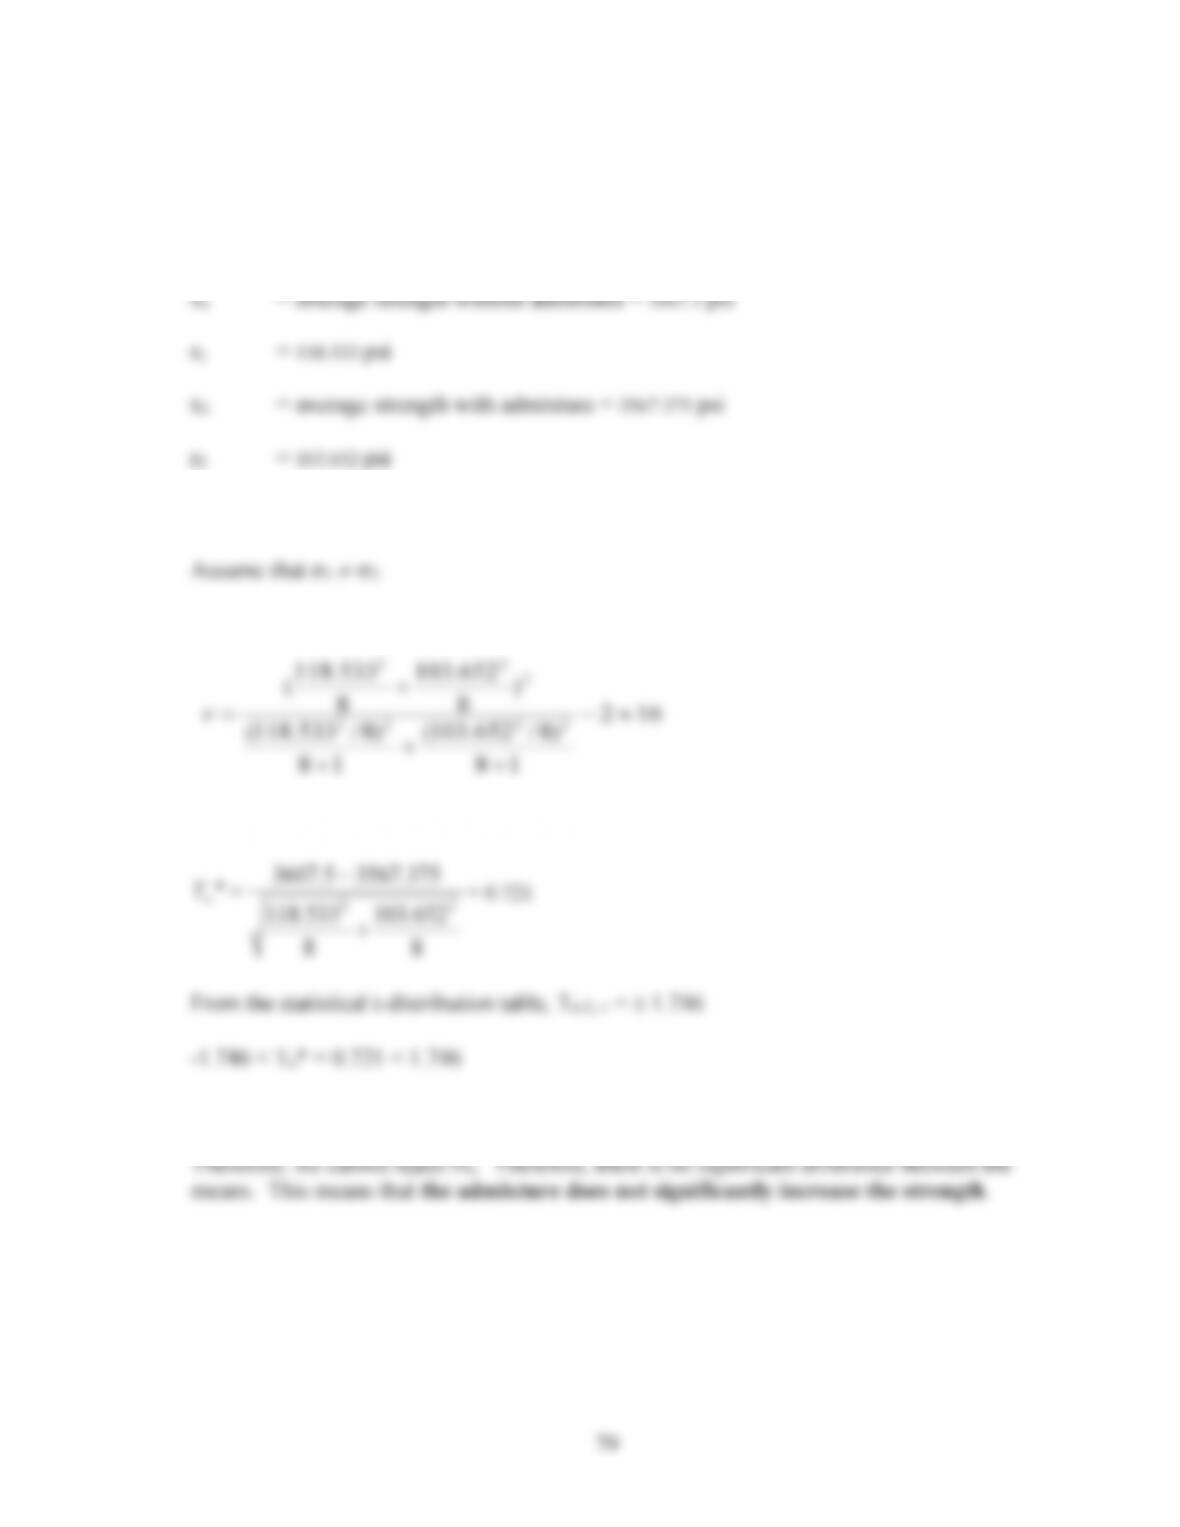
6.40. Ho:P1=P2(2-tail test)
H1:
P1zP
2
D = 0.1
8
652.103
8
533.118
375.35675.3607
*
22
o
T
= 0.721
From the statistical t-distribution table, TD/2, Q=r 1.746
-1.746 < To* = 0.721 < 1.746
Thereforewe cannot reject Ho. Therefore, there is no significant difference between the
means. This means that the admixture does not significantly increase the strength.
18
)8/652.103(
18
)8/533.118(
2222