42
CHAPTER 4. ALUMINUM
4.2.
A36 Steel*
7178 T76 Aluminum**
Yield Strength
36 ksi
73 ksi
Ultimate Strength
58-80 ksi
83 ksi
Modulus of Elasticity
29,000 ksi
10,500 ksi
*See Table 3.2 and 1.1
** See Tables 4.5 and 1.1
The material property that controls the deflection is the modulus of elasticity. The modulus
of aluminum is lower. Therefore, the aluminum section must be larger.
The material property that controls the tension is the yield strength. The yield s of the steel is
lower. Therefore, steel would require a larger cross section.
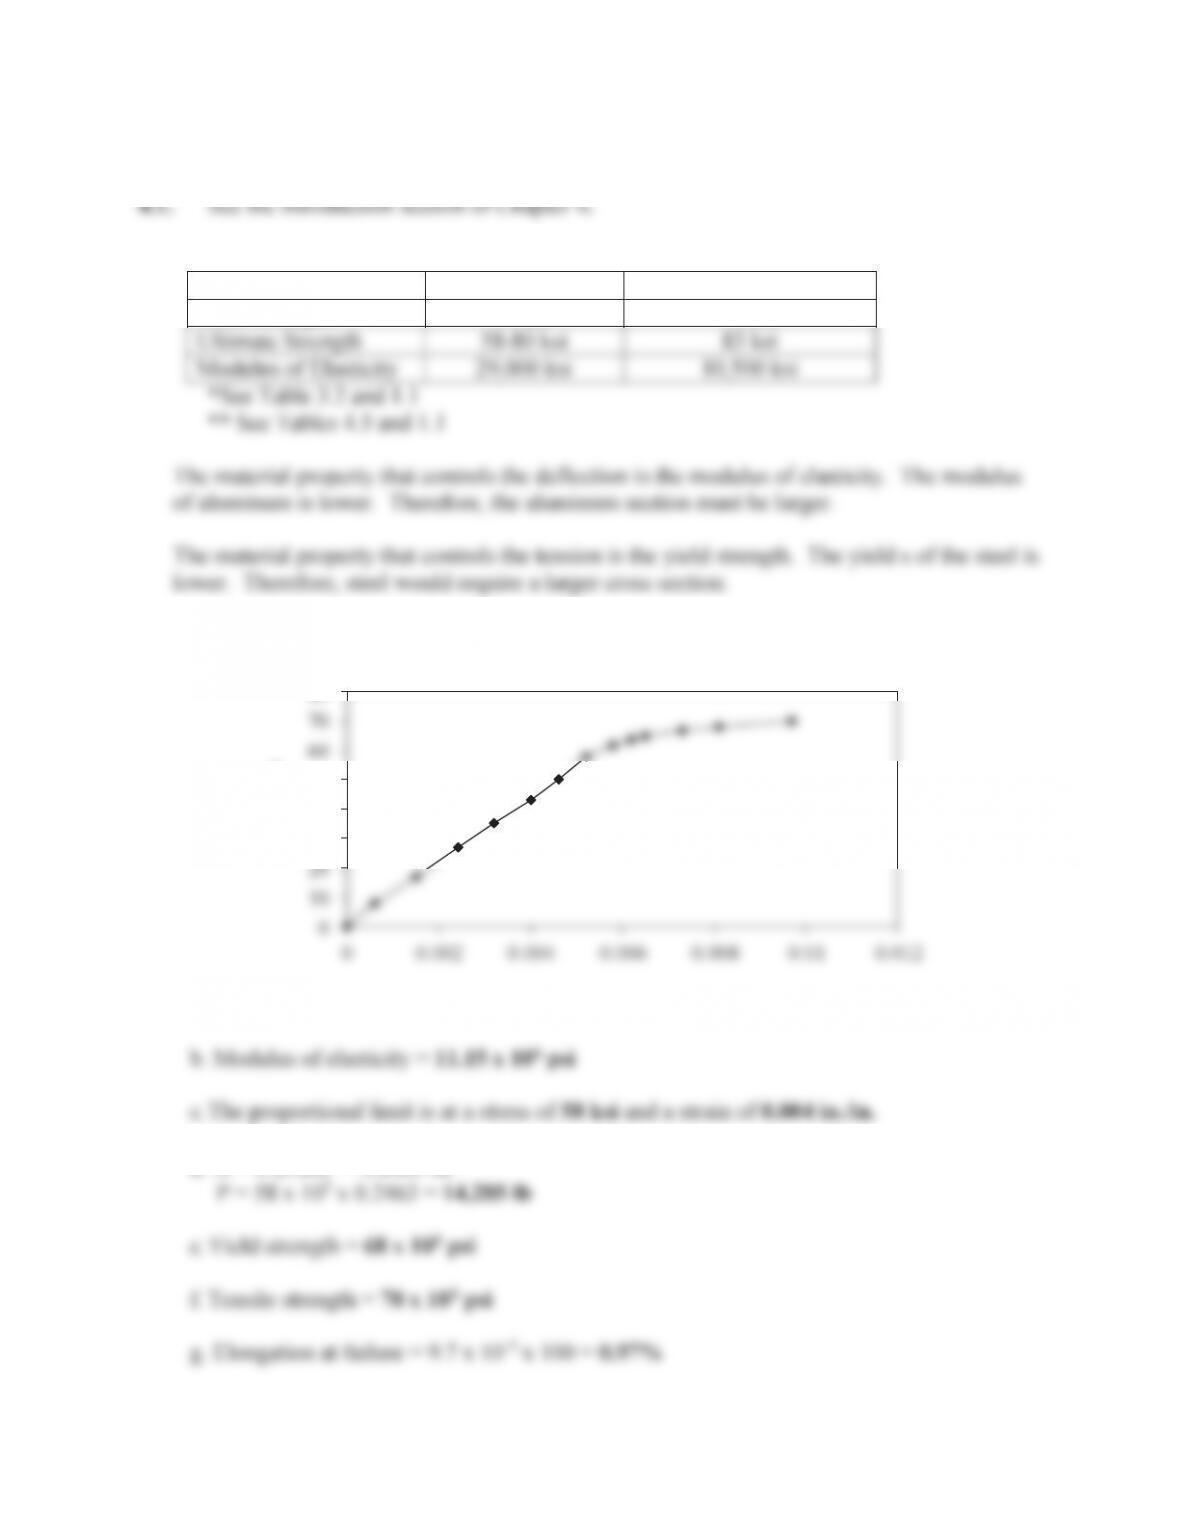
4.3. a.
The stress-strain relationship is shown below.
d. A = S(0.28)2= 0.2463 in.2
P = 58 x 103 x 0.2463 = 14,285 lb
e. Yield strength = 68 x 103psi
f. Tensile strength = 70 x 103psi
g. Elongation at failure = 9.7 x 10-3 x 100 = 0.97%
0
10
20
30
40
50
60
70
80
Stress, ksi
Strain, in./in.
43
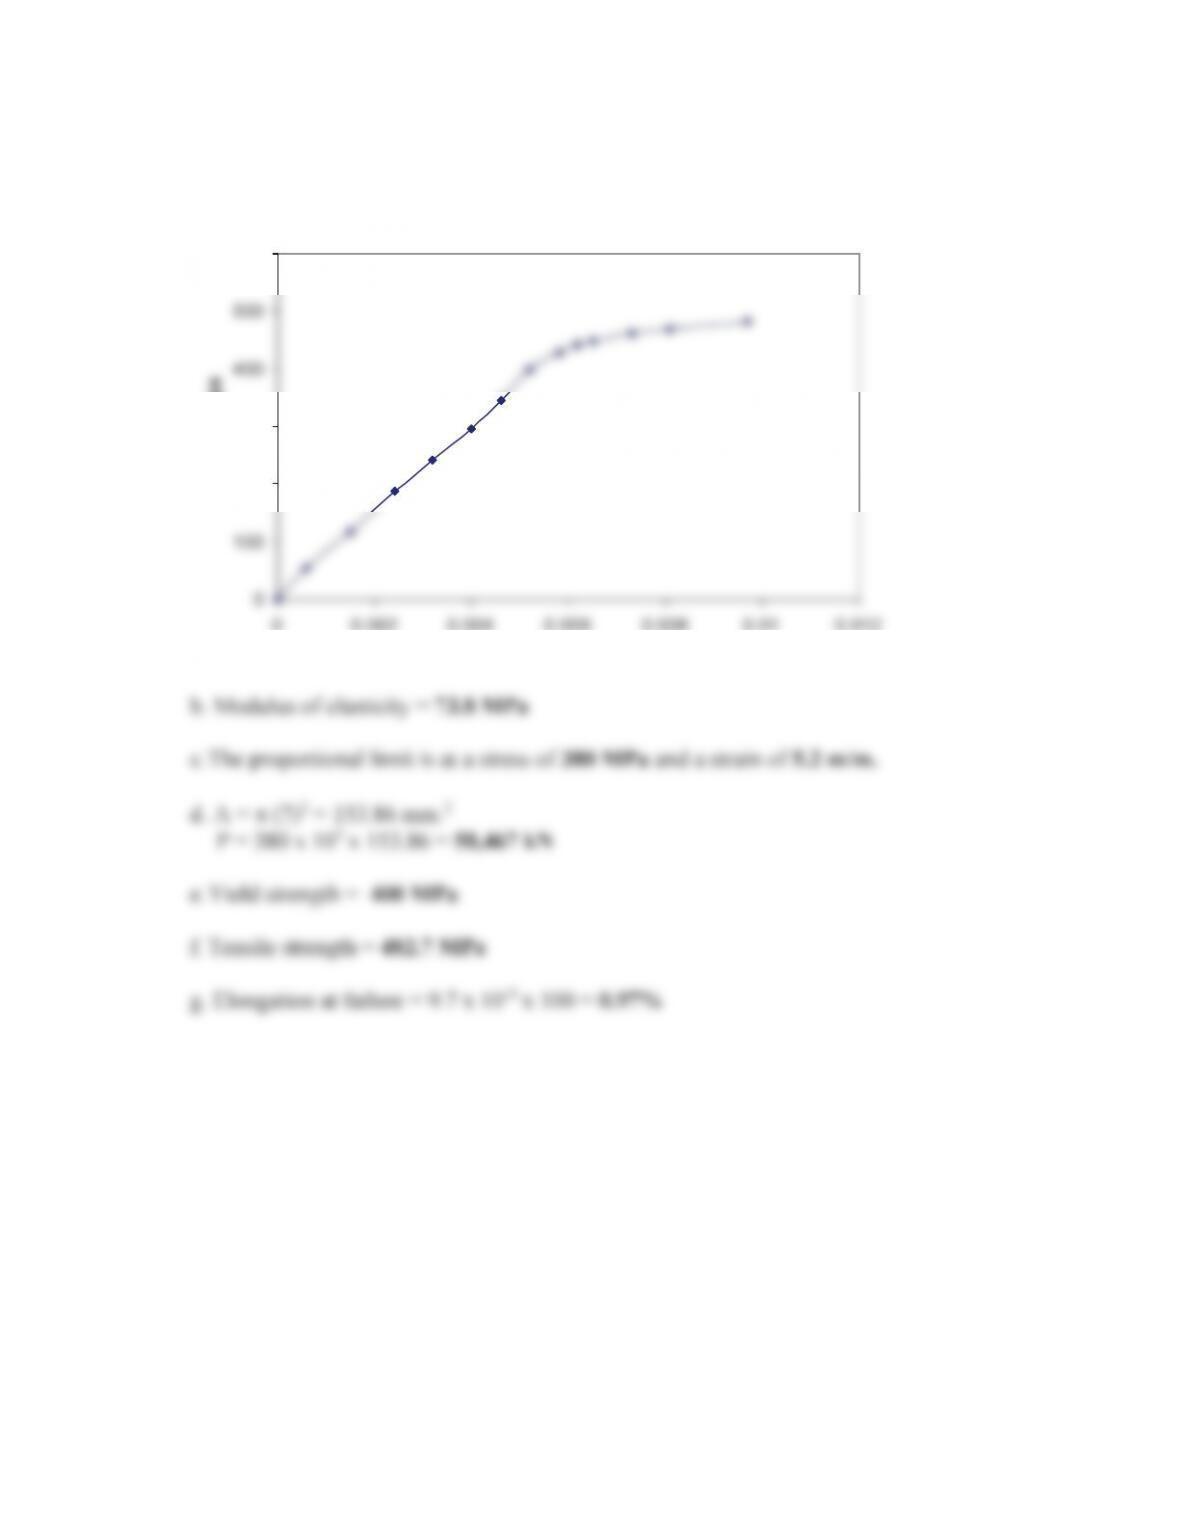
4.4. a.
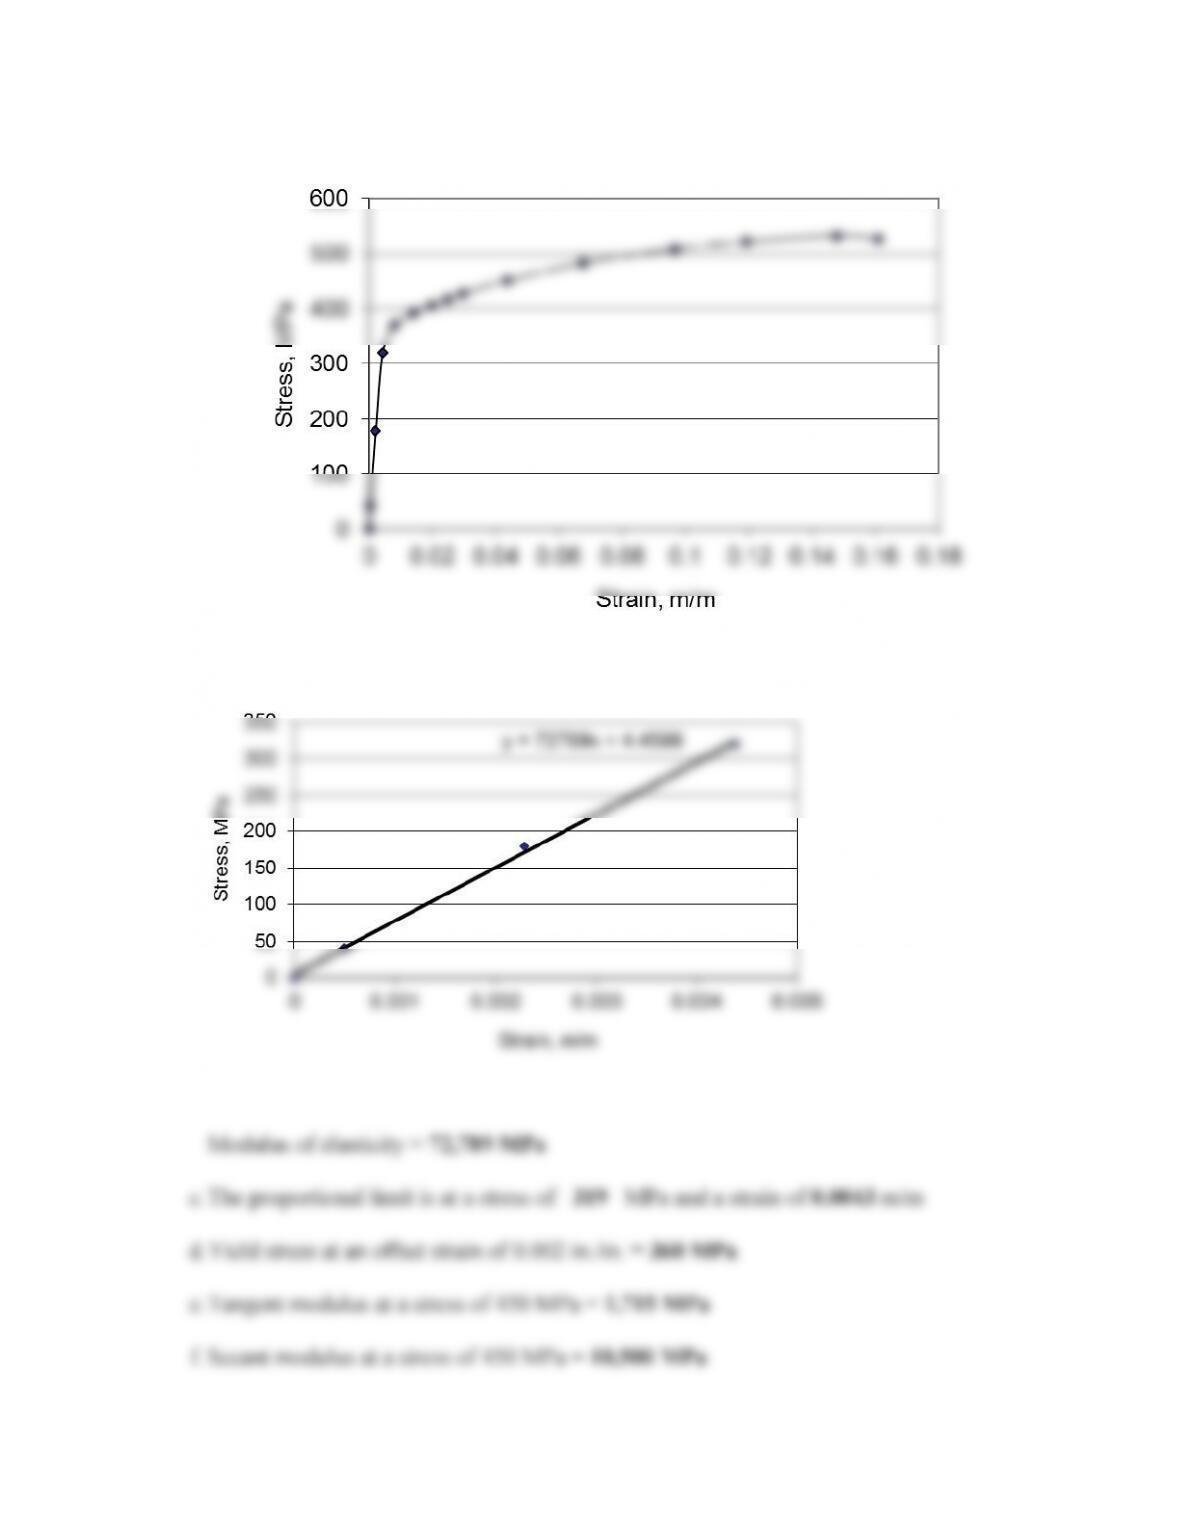
The stress-strain relationship is shown below.
Strain, m/m
Stress, Mpa
4.5. See Table 4.5.
44
4.6. Stress = Load / Area
Strain = Displacement / Gage Length
Load
(lb)
ΔL
(in.)
V
(ksi)
H
(in./in.)
0
0
0
0
2000
0.0014
7100
0.0007
4100
0.0028
14500
0.0014
6050
0.0042
21400
0.0021
8080
0.0055
28600
0.00275
10100
0.007
35700
0.0035
12000
0.0083
42400
0.00415
14000
0.0103
49500
0.00515
15,500
0.0136
54800
0.0068
16,400
0.0168
58000
0.0084
17,300
0.022
61200
0.011
18,000
0.031
63700
0.0155
18,400
0.042
65100
0.021
18,600
0.0528
65800
0.0264
18,800
fracture
66500
a.
The stress-strain relationship is shown below.
45
b. The linear portion of the stress-strain relationship is shown below.
4.7.a.Stress = Load / Area
Strain = Displacement / Gage Length
Stress (MPa)
Strain (m/m)
Stress (MPa)
Strain (m/m)
0
0
428.36
0.0297
41.71
0.0005
451.89
0.0438
179.46
0.0023
483.47
0.0678
319.71
0.0044
508.88
0.0966
371.09
0.0081
522.07
0.1192
391.62
0.0141
532.70
0.1477
405.67
0.0196
527.82
0.1609
418.16
0.0249
46
The stress-strain relationship is shown below.
Stress-Strain Relation
b. The linear portion of the stress-strain relationship is shown below.
Stress-strain relation of the linear range
47
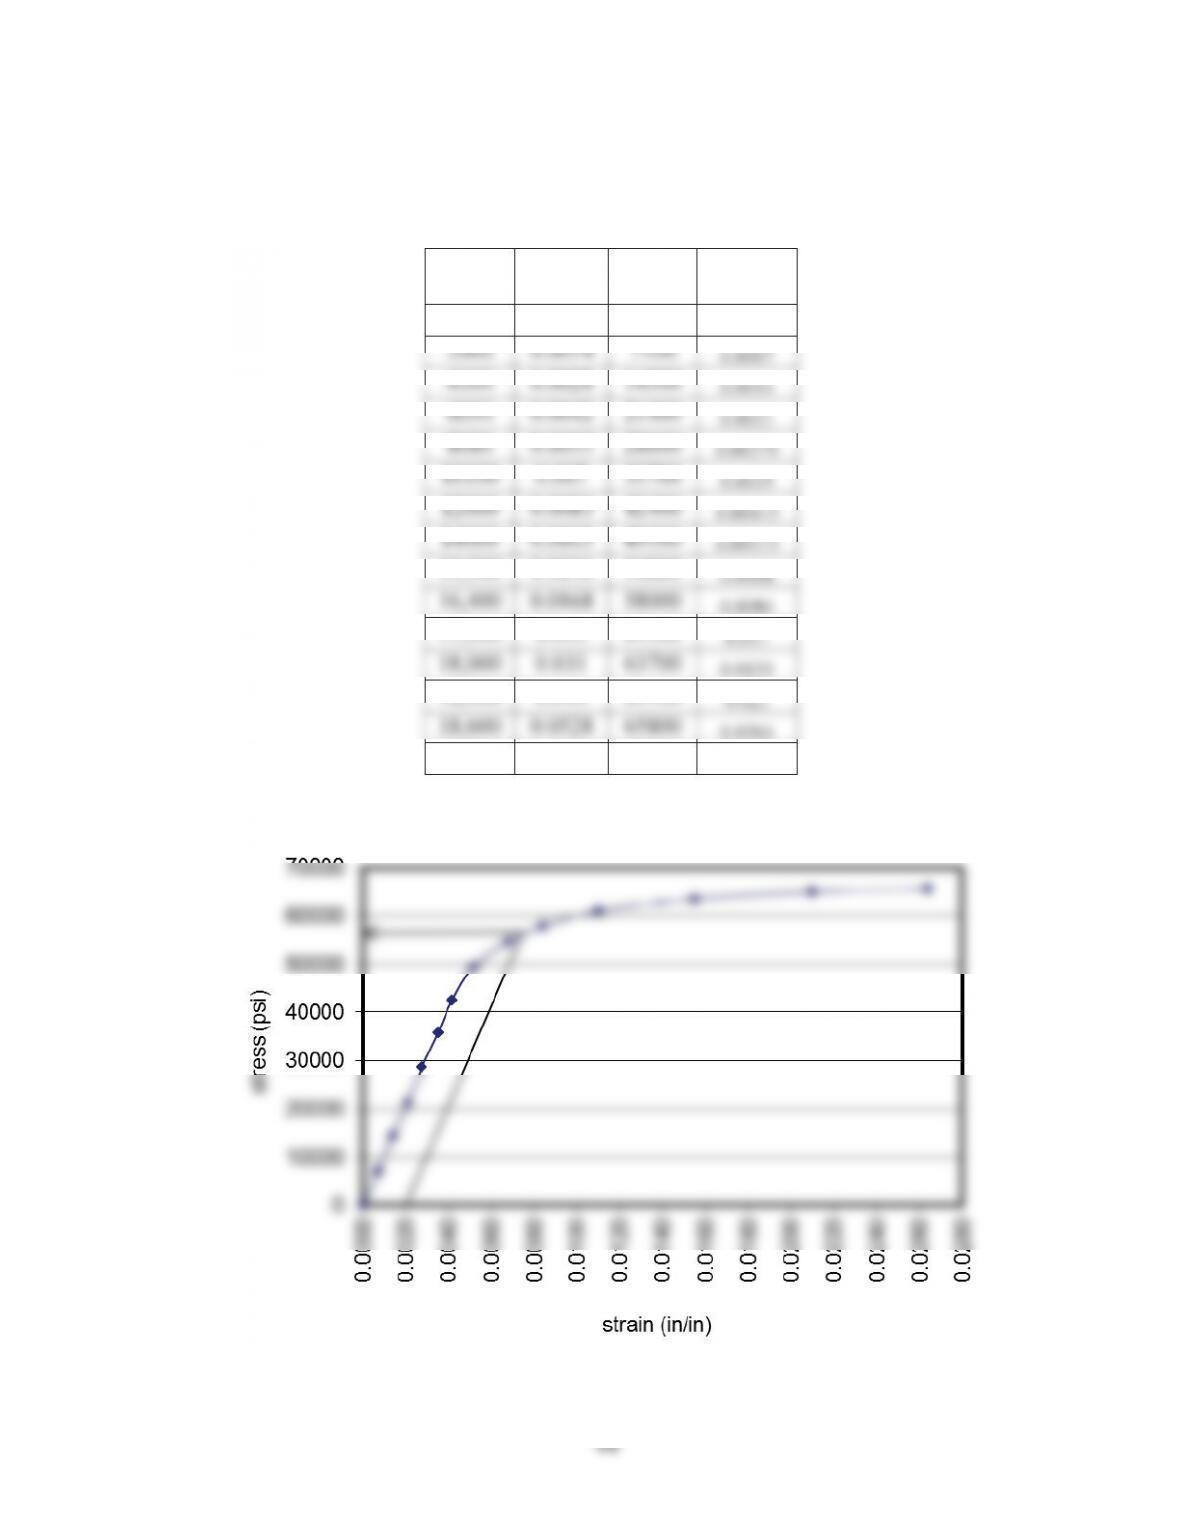
4.8. a. Stress = Load / Area
Strain = Displacement / Gage Length
Stress
(ksi)
Strain
(in/in)
Stress
(ksi)
Strain
(in/in)
0
0
60.234
0.02926
5.865
0.00050
63.541
0.04310
25.234
0.00225
67.983
0.06674
44.955
0.00432
71.555
0.09506
52.181
0.00799
73.410
0.11734
55.067
0.01388
74.905
0.14539
57.043
0.01930
74.219
0.15841
58.799
0.02451
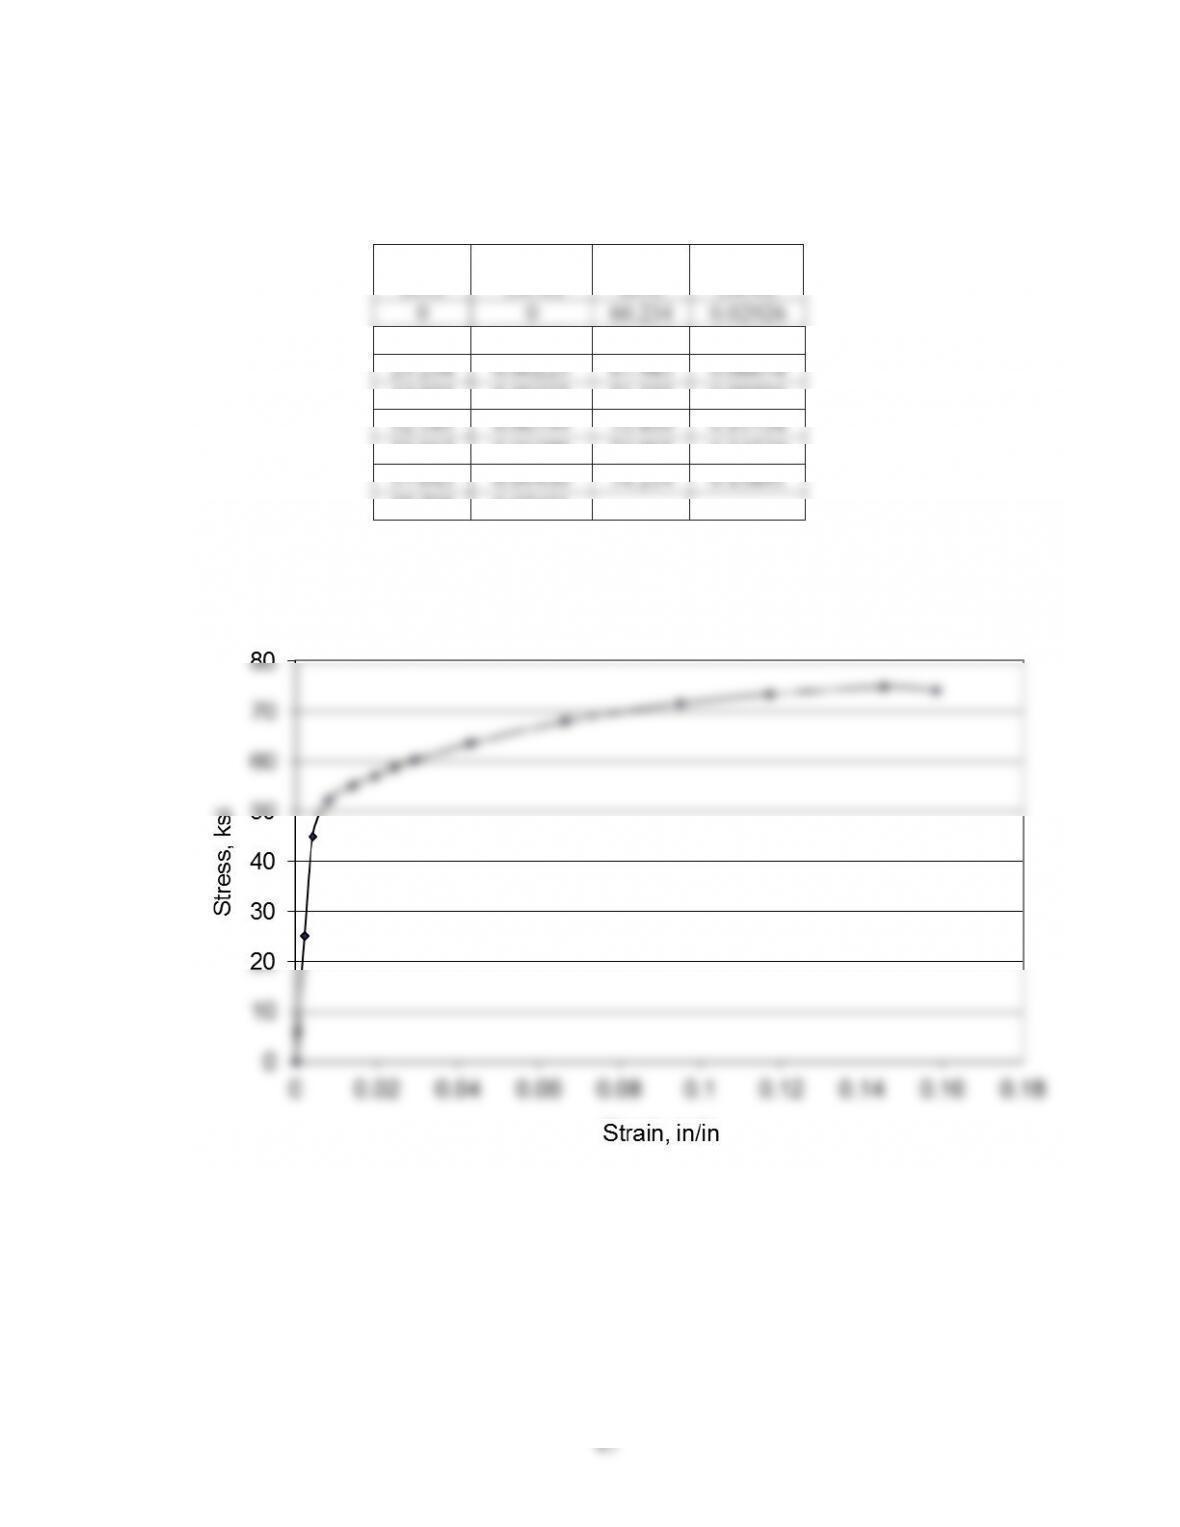
The stress-strain relationship is shown below.
Stress-strain diagram
48
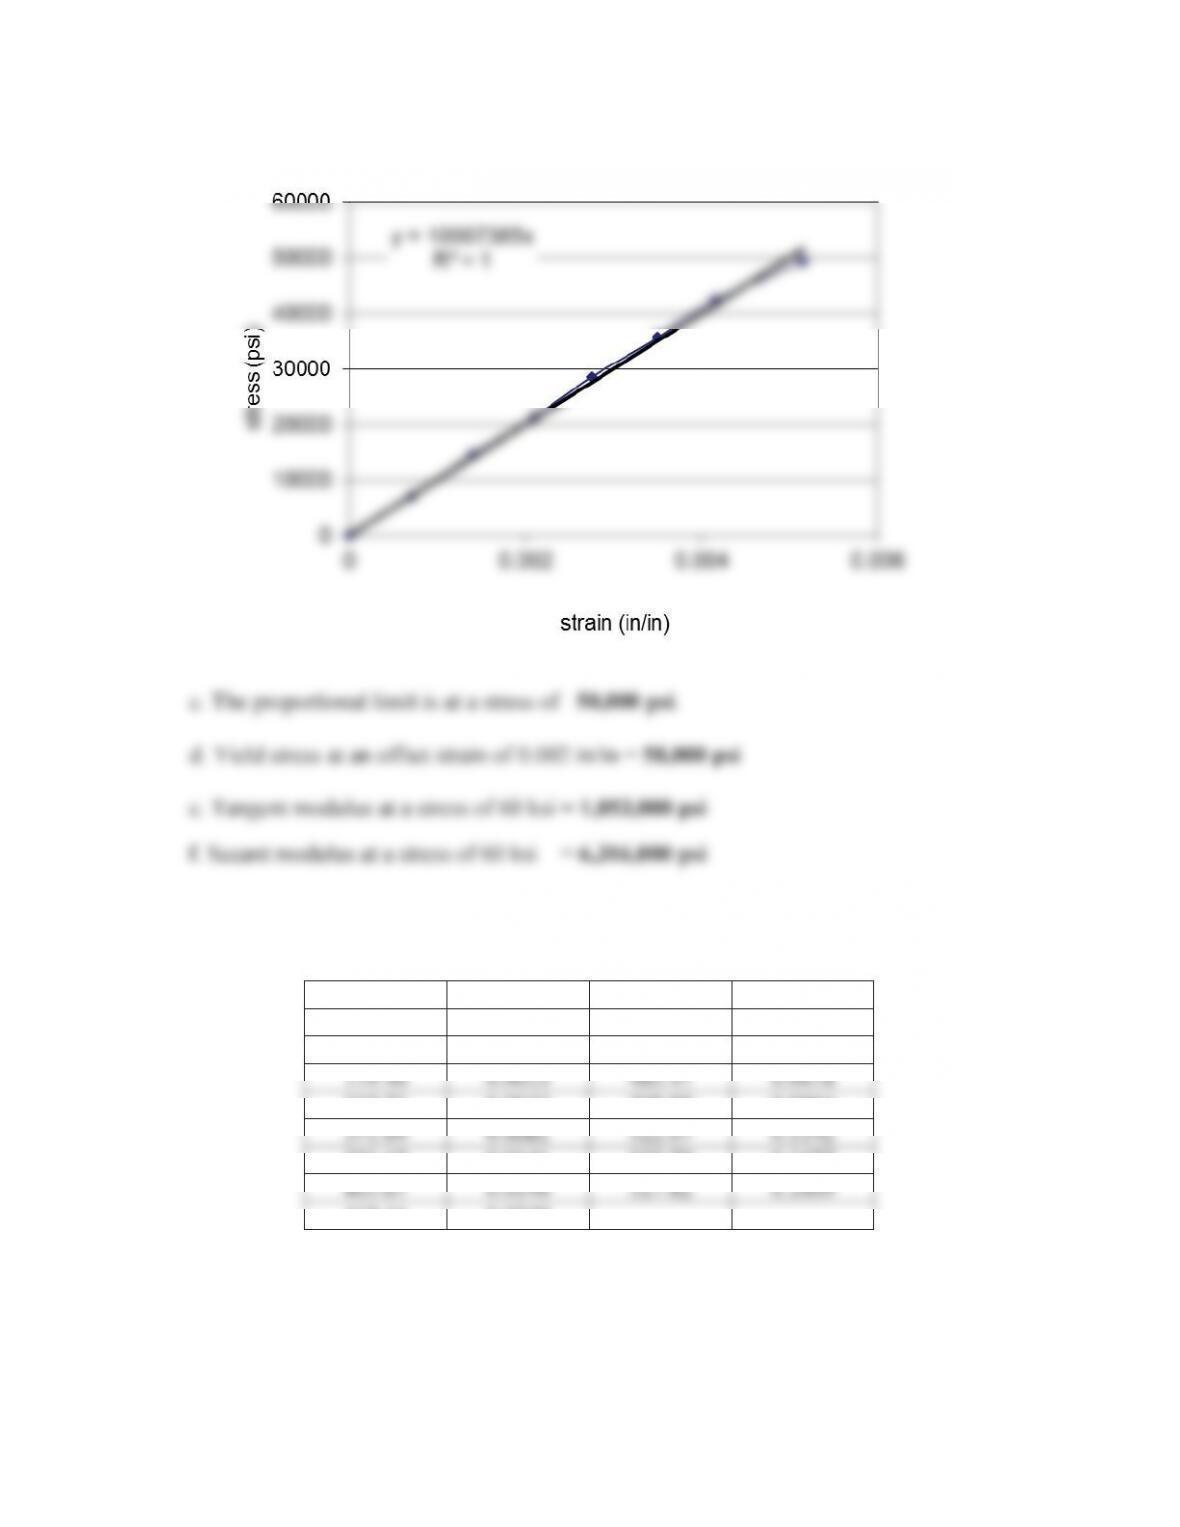
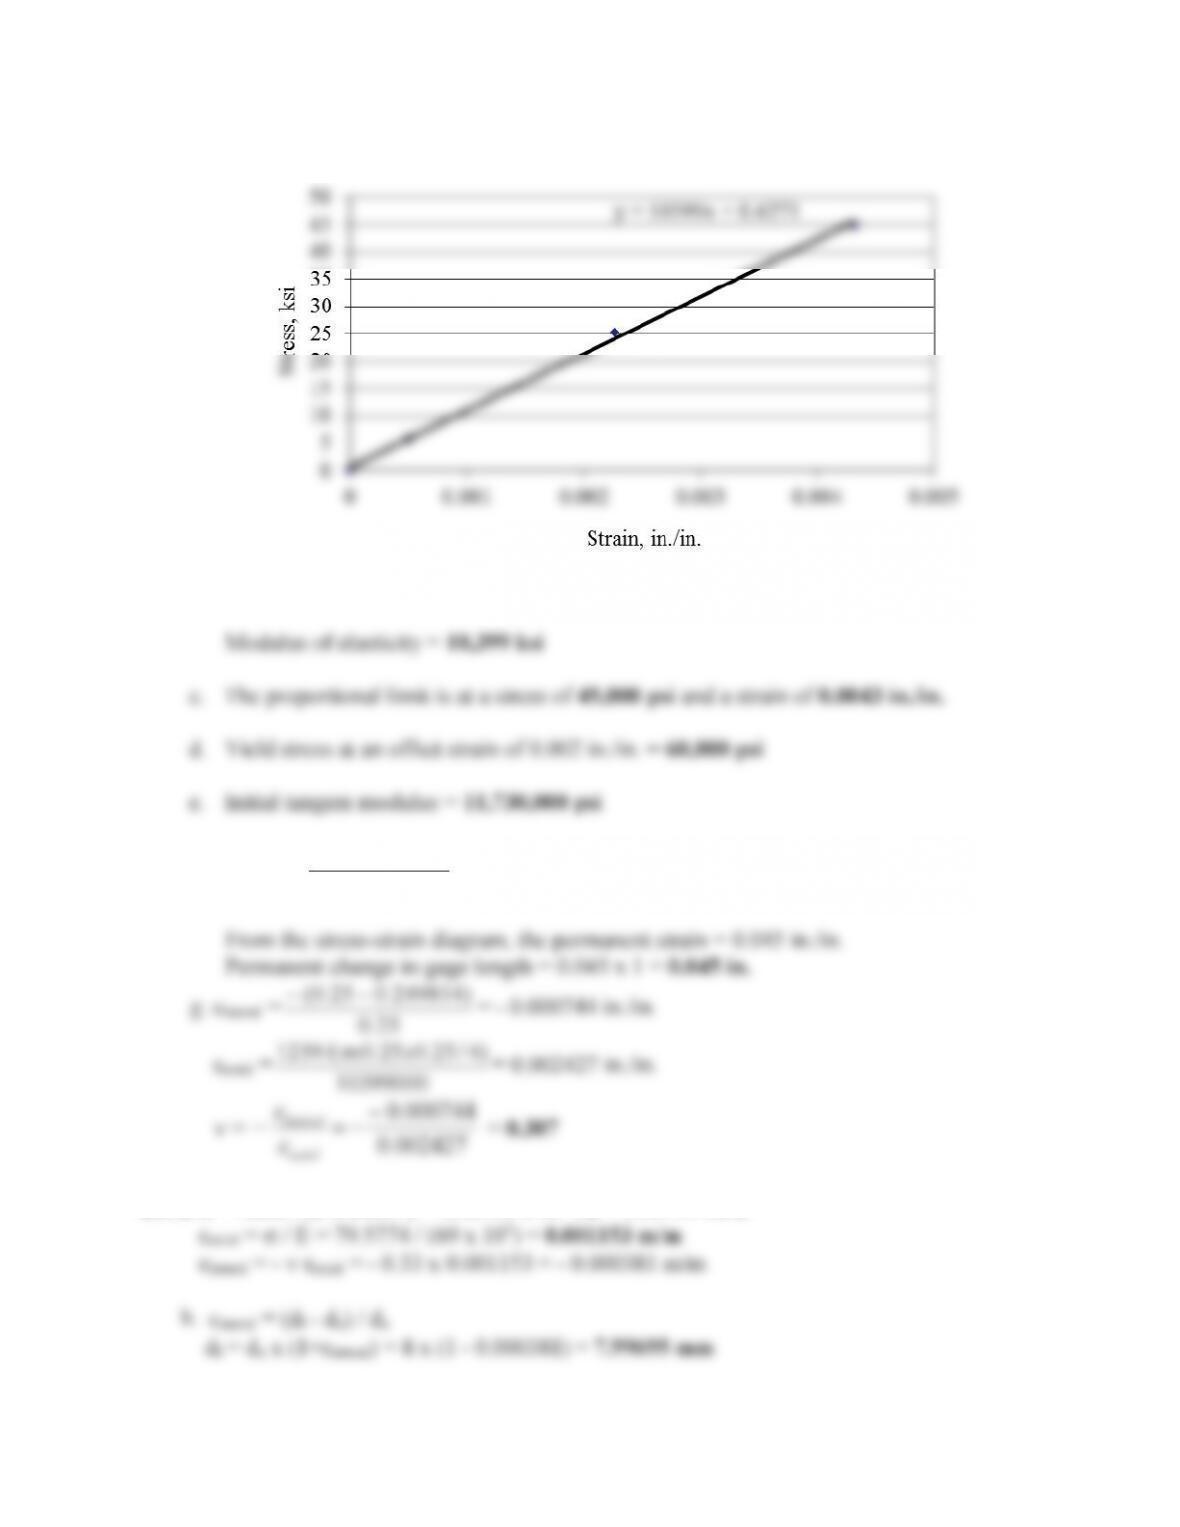
b. The linear portion of the stress-strain relationship is shown below.
Stress-strain relation of the linear range
f. Stress =
4/25.025.0
3200
xx
S
= 65,190 psi
002427.0
axial
H
4.9. a. V= 4000 / (Sx 0.0042) = 79.5774 x 10⁶Pa = 79.5774 MPa
49
4.10. a. V= -50000 / (Sx 32) = -1768.4 x 103lb/in2= -1.768 ksi
Since Vy= 21000 psi, it is clear that the applied stress is well below the yield stress and as a
result the deformation is elastic.
4.12.
HVV
§
©
¨·
¹
¸
ª
¬
«
«
º
¼
»
»
70 000 13
7 270
9
,
»
¼
º
«
¬
ª
¸
¸
¹
·
¨
¨
©
§
9
10
)270(7
3
000,70
1
V
V
50
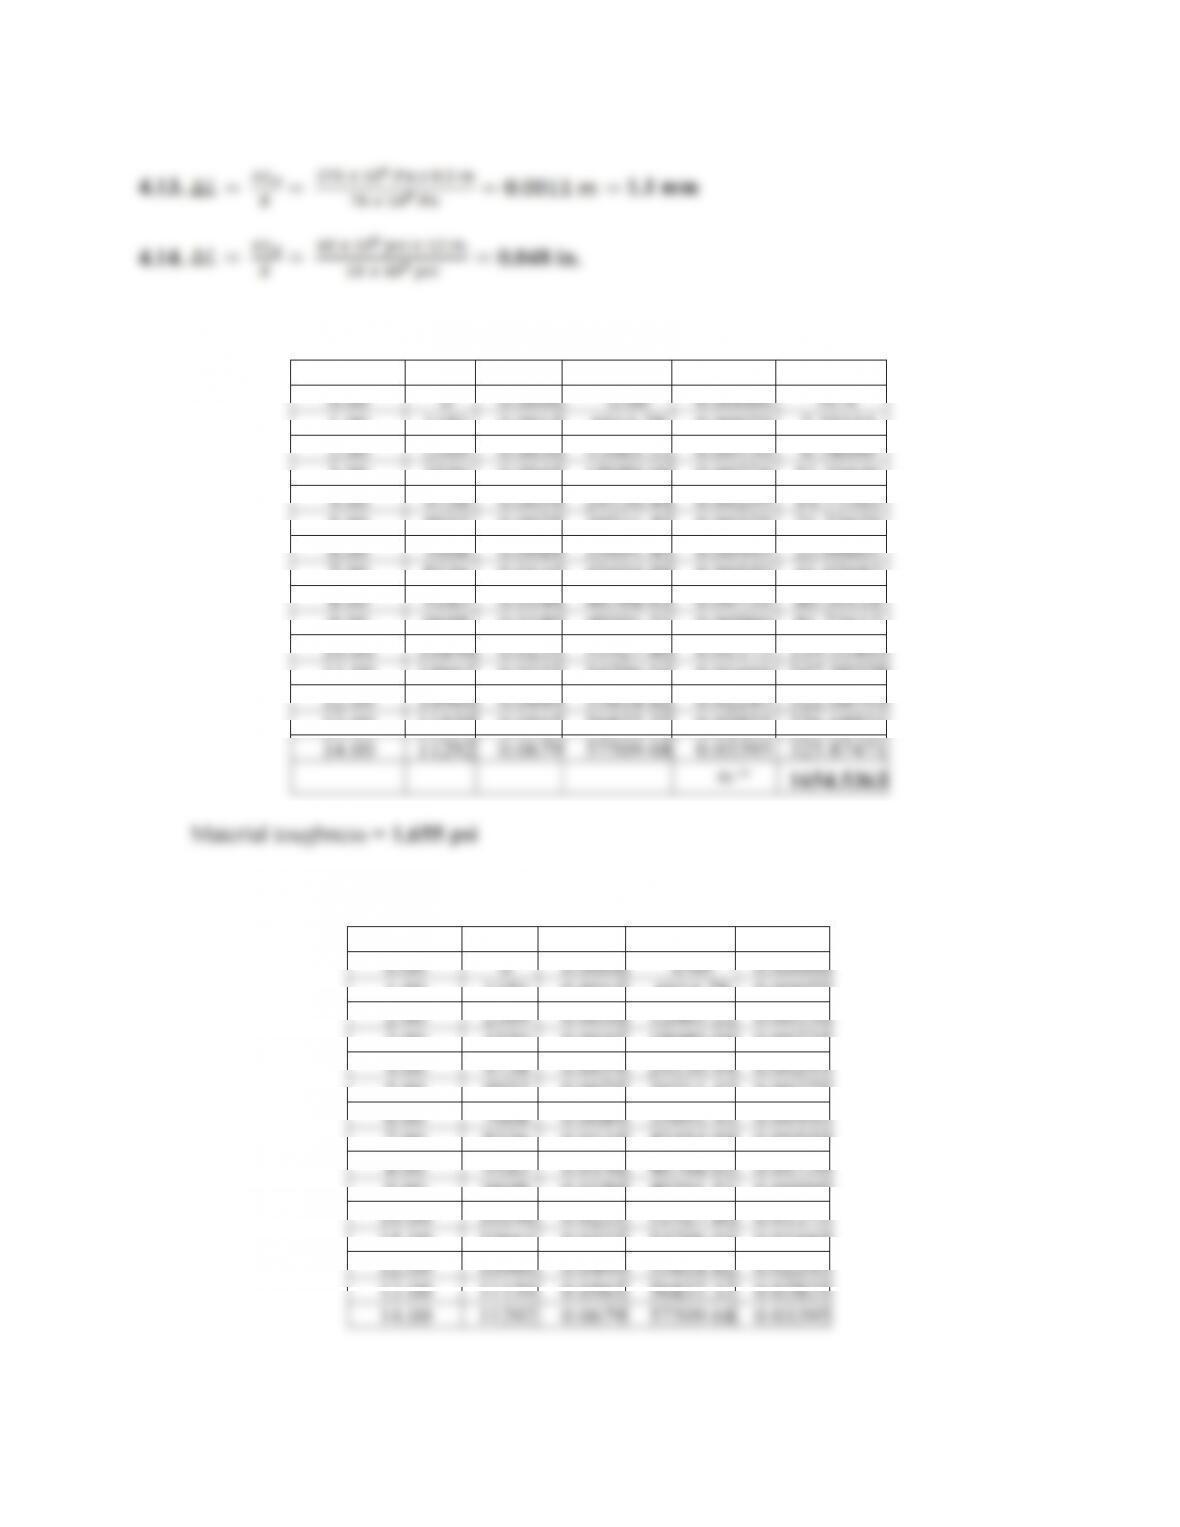
4.15.
Observation
P(lb)
‘
L
V
(psi)
H
(in./in.)
ui(psi)
0.00
0
0.0000
0.00
0.00000
N/A
1.00
1181
0.0015
6014.78
0.00075
2.25554
2.00
2369
0.0030
12065.22
0.00150
6.78000
3.00
3550
0.0045
18080.00
0.00225
11.30446
4.00
4738
0.0059
24130.44
0.00295
14.77365
5.00
5932
0.0075
30211.43
0.00375
21.73675
6.00
7008
0.0089
35691.45
0.00445
23.06601
7.00
8336
0.0110
42454.90
0.00550
41.02683
8.00
9183
0.0146
46768.63
0.00730
80.30118
9.00
9698
0.0180
49391.51
0.00900
81.73612
10.00
10196
0.0235
51927.80
0.01175
139.31405
11.00
10661
0.0332
54296.03
0.01660
257.59278
12.00
10960
0.0449
55818.82
0.02245
322.08593
13.00
11159
0.0565
56832.32
0.02825
326.68831
14.00
11292
0.0679
57509.68
0.03395
325.87471
u
t
=
1654.5363
Material toughness = 1,655 psi
4.16
Observation
P(lb)
‘
L
V
(psi)
H
0.00
0
0.0000
0.00
0.00000
1.00
1181
0.0015
6014.78
0.00075
2.00
2369
0.0030
12065.22
0.00150
3.00
3550
0.0045
18080.00
0.00225
4.00
4738
0.0059
24130.44
0.00295
5.00
5932
0.0075
30211.43
0.00375
6.00
7008
0.0089
35691.45
0.00445
7.00
8336
0.0110
42454.90
0.00550
8.00
9183
0.0146
46768.63
0.00730
9.00
9698
0.0180
49391.51
0.00900
10.00
10196
0.0235
51927.80
0.01175
11.00
10661
0.0332
54296.03
0.01660
12.00
10960
0.0449
55818.82
0.02245
13.00
11159
0.0565
56832.32
0.02825
14.00
11292
0.0679
57509.68
0.03395
51
D E = 8,020 ksi
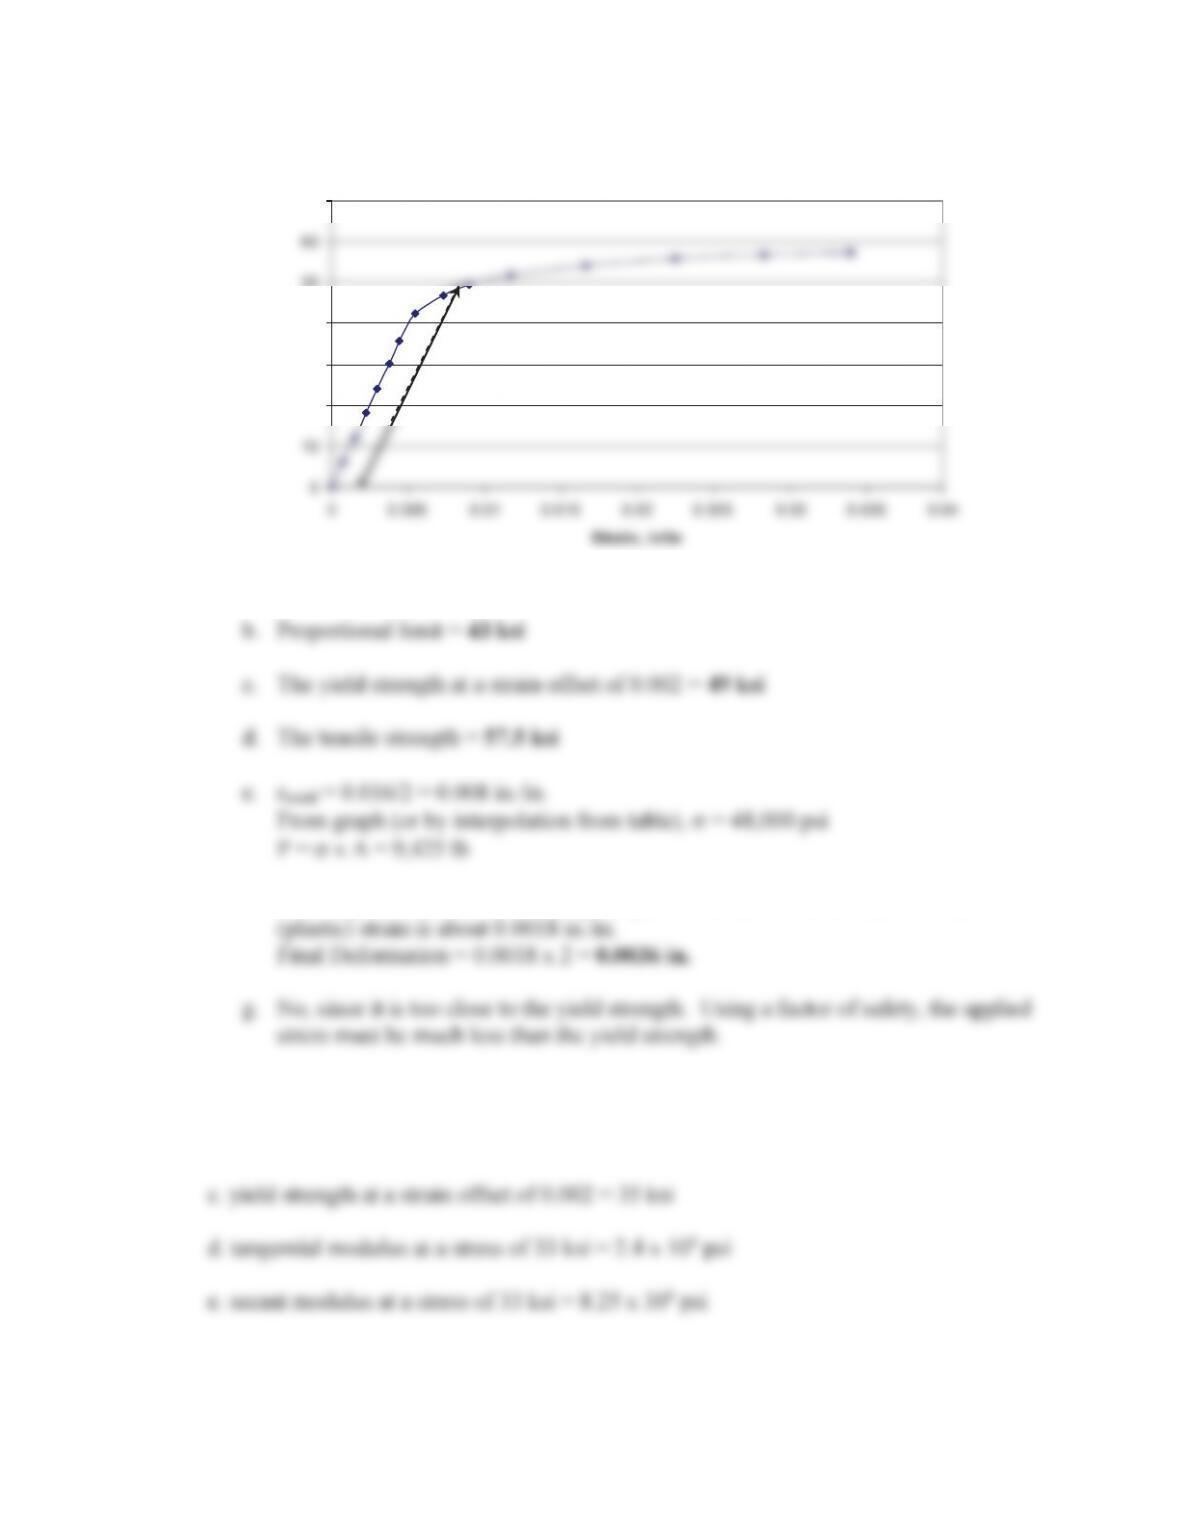
I Drawing a line parallel to the original part of the curve shows that the final
4.17a. modulus of elasticity = 10 x 106psi
b. proportional limit = 25 ksi
c. yield strength at a strain offset of 0.002 = 35 ksi
d. tangential modulus at a stress of 33 ksi = 2.4 x 10⁶psi
e. secant modulus at a stress of 33 ksi = 8.25 x 10⁶psi
Strain, in/in
Stress, psi
52
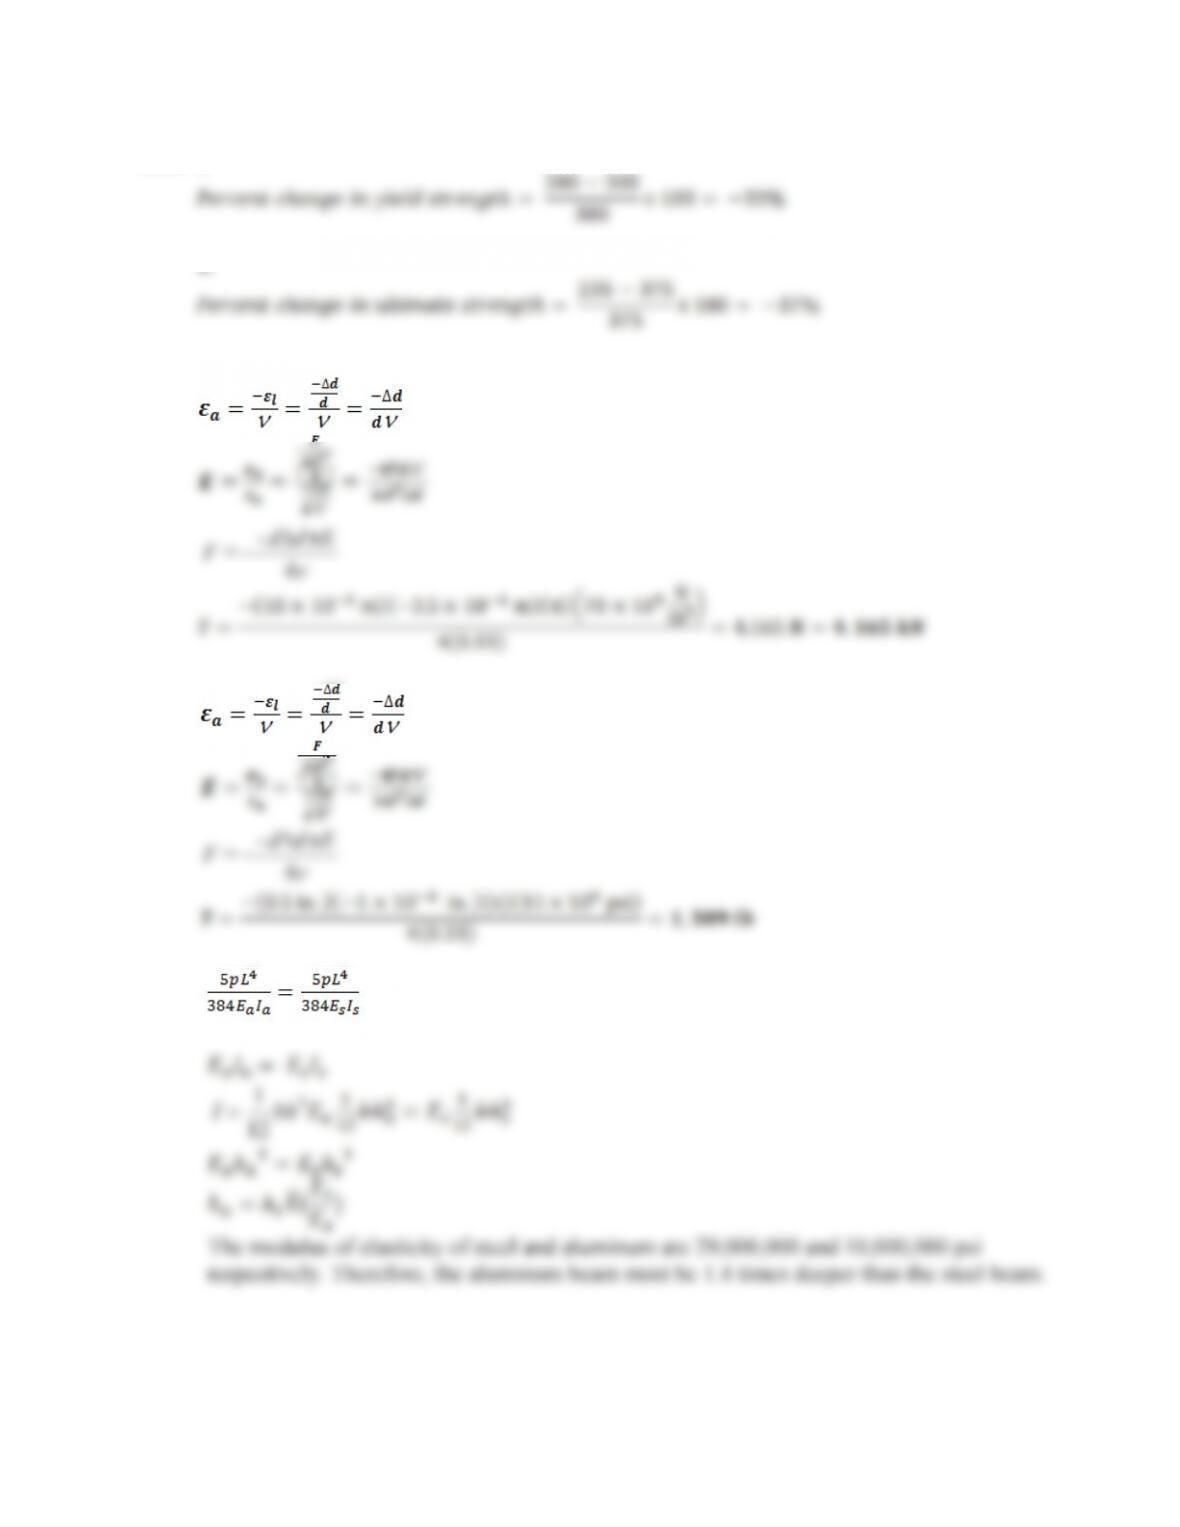
4.18D
E
4.19
Q
4
= E
dd
–
F
S‘
4.20
Q
4
= E
dd
–
F
S‘
4.21
I
1
12 bh3
The modulus of elasticity of steel and aluminum are 29,000,000 and 10,000,000 psi
respectively. Therefore, the aluminum beam must be 1.4 times deeper than the steel beam.
4.22See Section 4.5.