Chapter 4: Engineering Communication
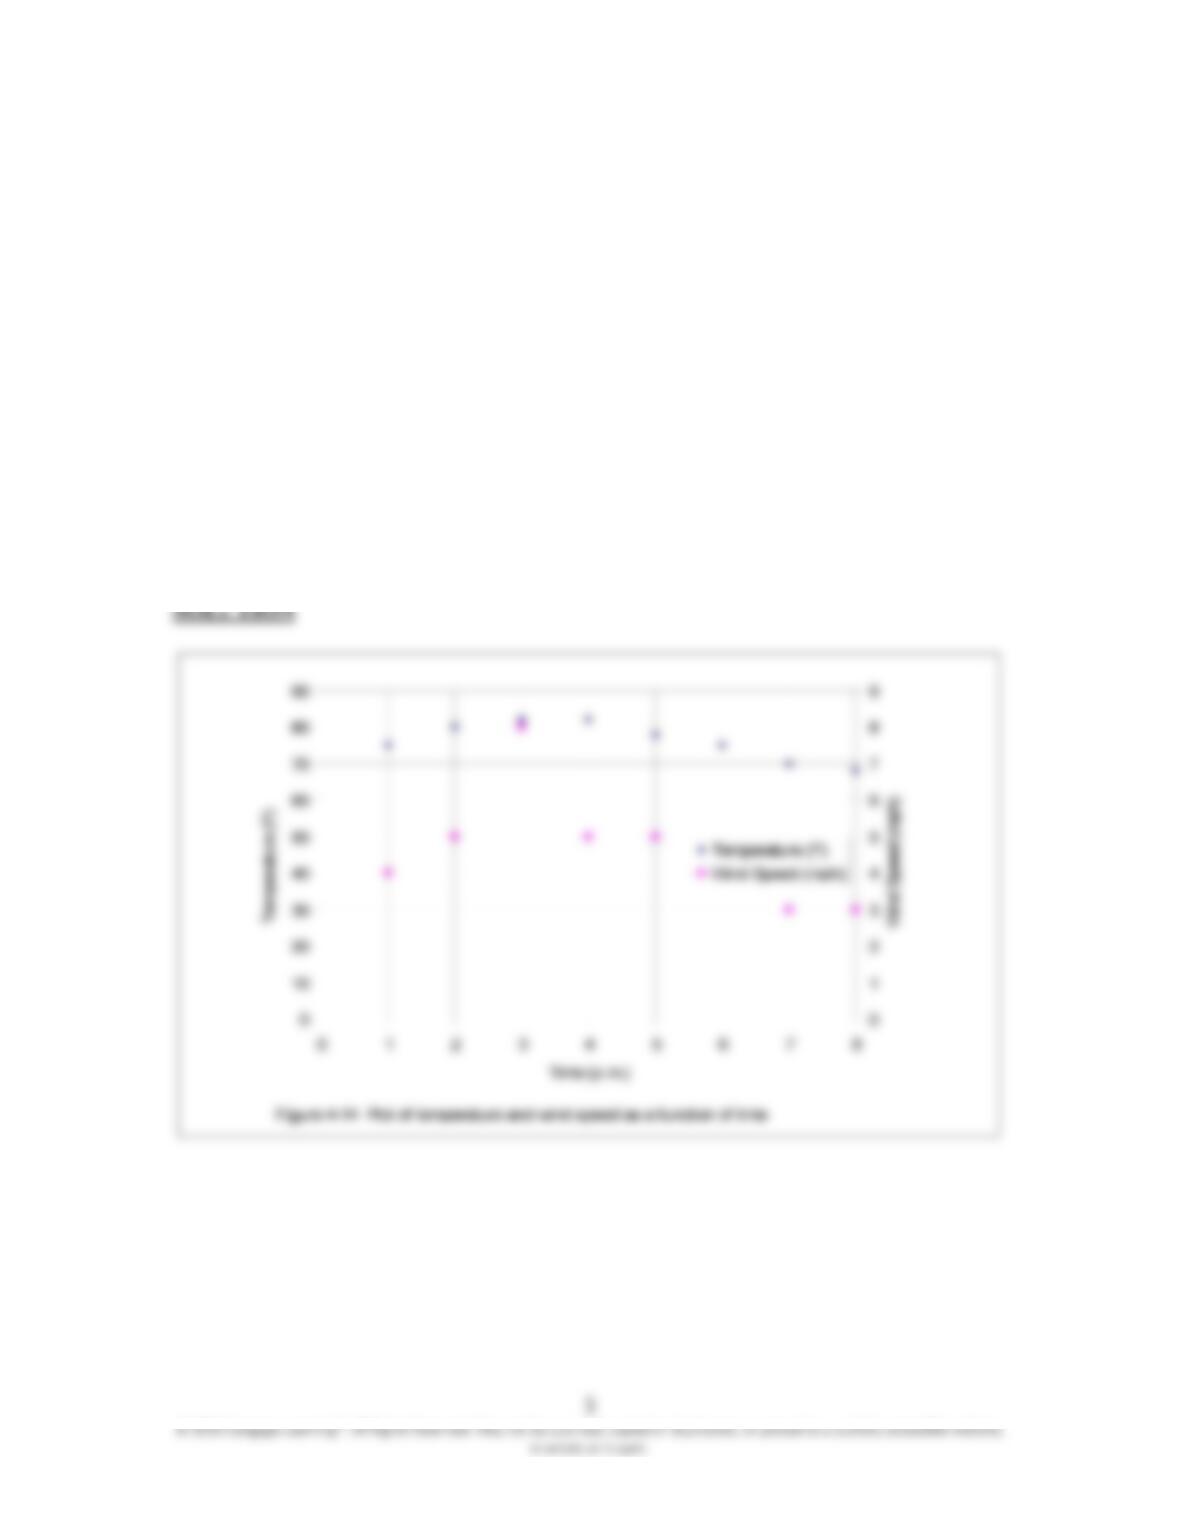
4.14 Plot the following data. Use two different y-axes. Use a scale of zero to 100°F for
temperature, and zero to 12 mph for wind speed. Present your work using the
ideas discussed in this chapter and engineering papers.
Time (p.m.) Temperature (°F) Wind Speed (mph)
1 75 4
2 80 5
3 82 8
4 82 5
5 78 5
6 75 4
7 70 3
8 68 3
4
4. 15 Create a table that shows the relationship between the units of temperature in
degree Celsius and Fahrenheit in the range of -50° to 50°C. Use Increments of
10°C. Present your work using the ideas discussed in this chapter and engineering
paper.
SOLUTION
The relationship between the units of temperature in degrees Celsius and Fahrenheit
Temperature
(
°C
)
Temperature
(
°F
)
-45 -49
-35 -31
-25 -13
-15 5
-5 23
0 32
5 41
4.16 Create a table that shows the relationship between the units of mass in kilogram
and pound mass in the range of 50 kg to 120 kg. Use increments of 10 kg. Present
your work using the ideas discussed in this chapter and engineering paper.
5
SOLUTION
The relationship between the units of mass in kilograms and pound mass
mass
(
k
g)
mass
(
lbm
)
50 110.2
70 154.3
90 198.4
110 242.5
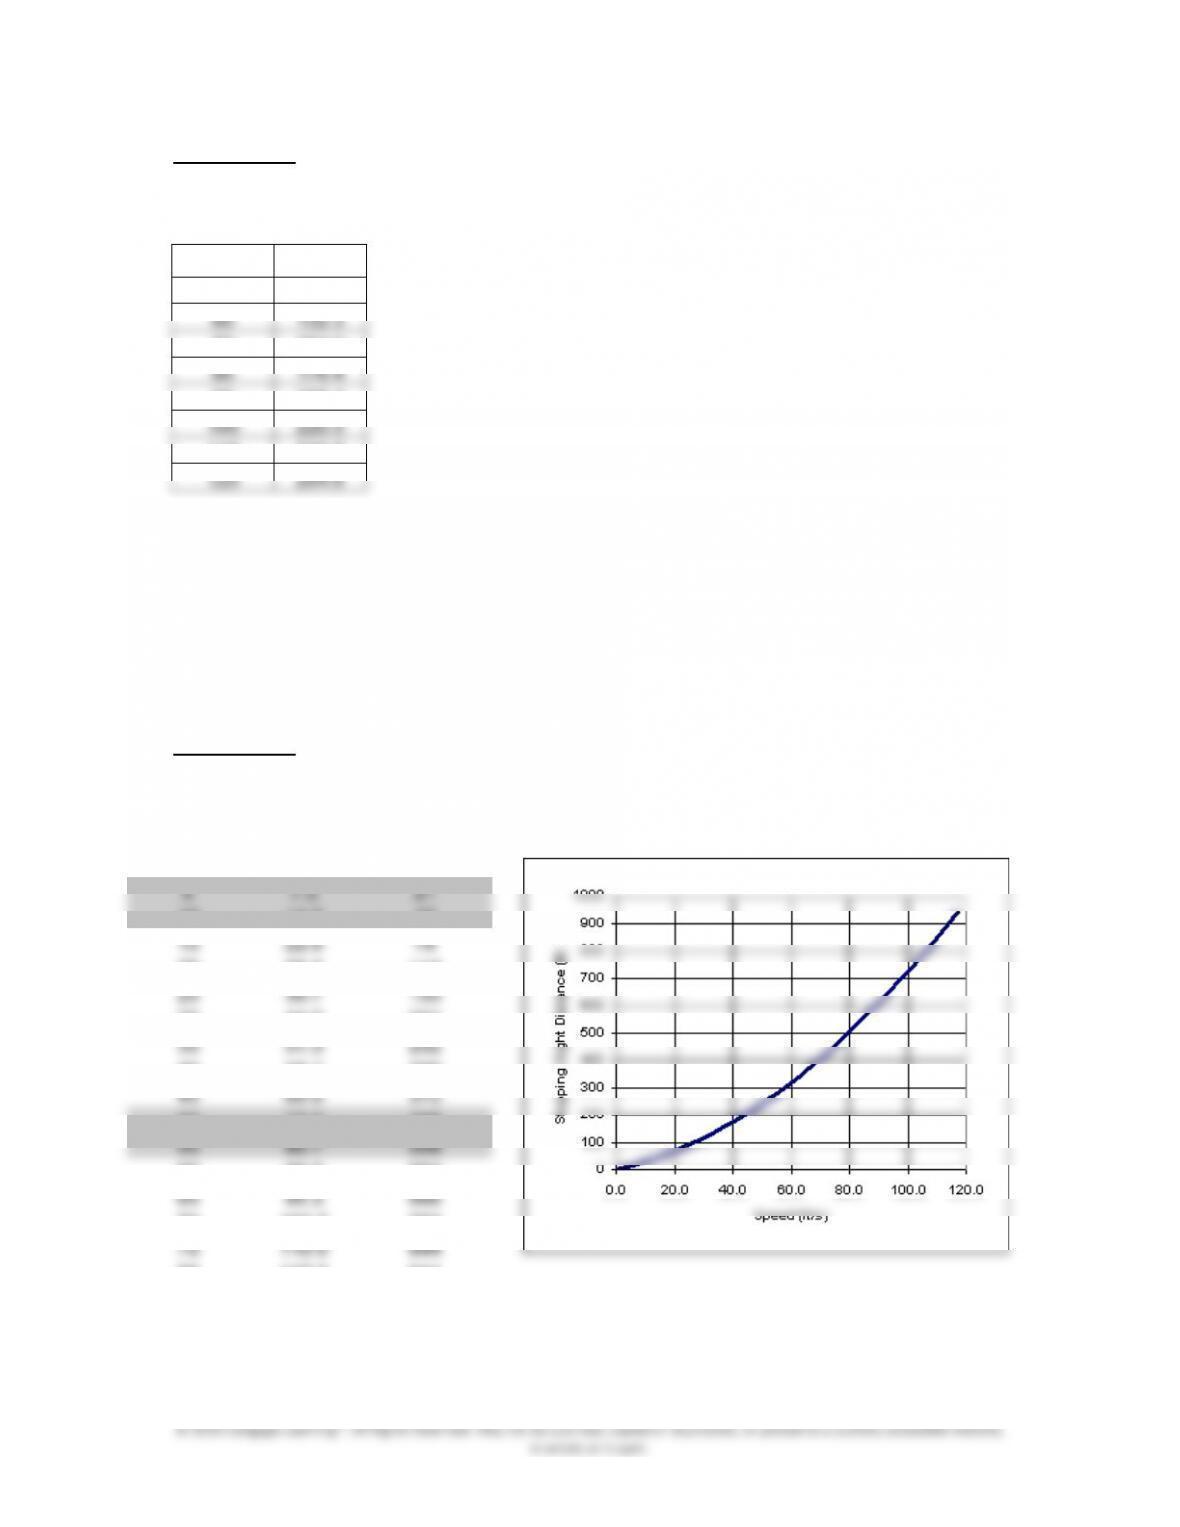
4.17 The given data show the result of a model known as stopping sight distance, used
by civil engineers to design roadways. This simple model estimates the distance a
driver needs in order to stop his car traveling at a certain speed after detecting a
hazard. Present your work using the ideas discussed in this chapter and
engineering papers.
SOLUTION
Speed
(
mph
)
Speed
(
ft/s
)
Stoppin
g
Si
g
ht Distance
(
ft
)
0 0.0 0
10 14.7 47
20 29.3 114
30 44.0 201
40 58.7 309
50 73.3 436
60 88.0 584
70 102.7 753
80 117.3 941
6
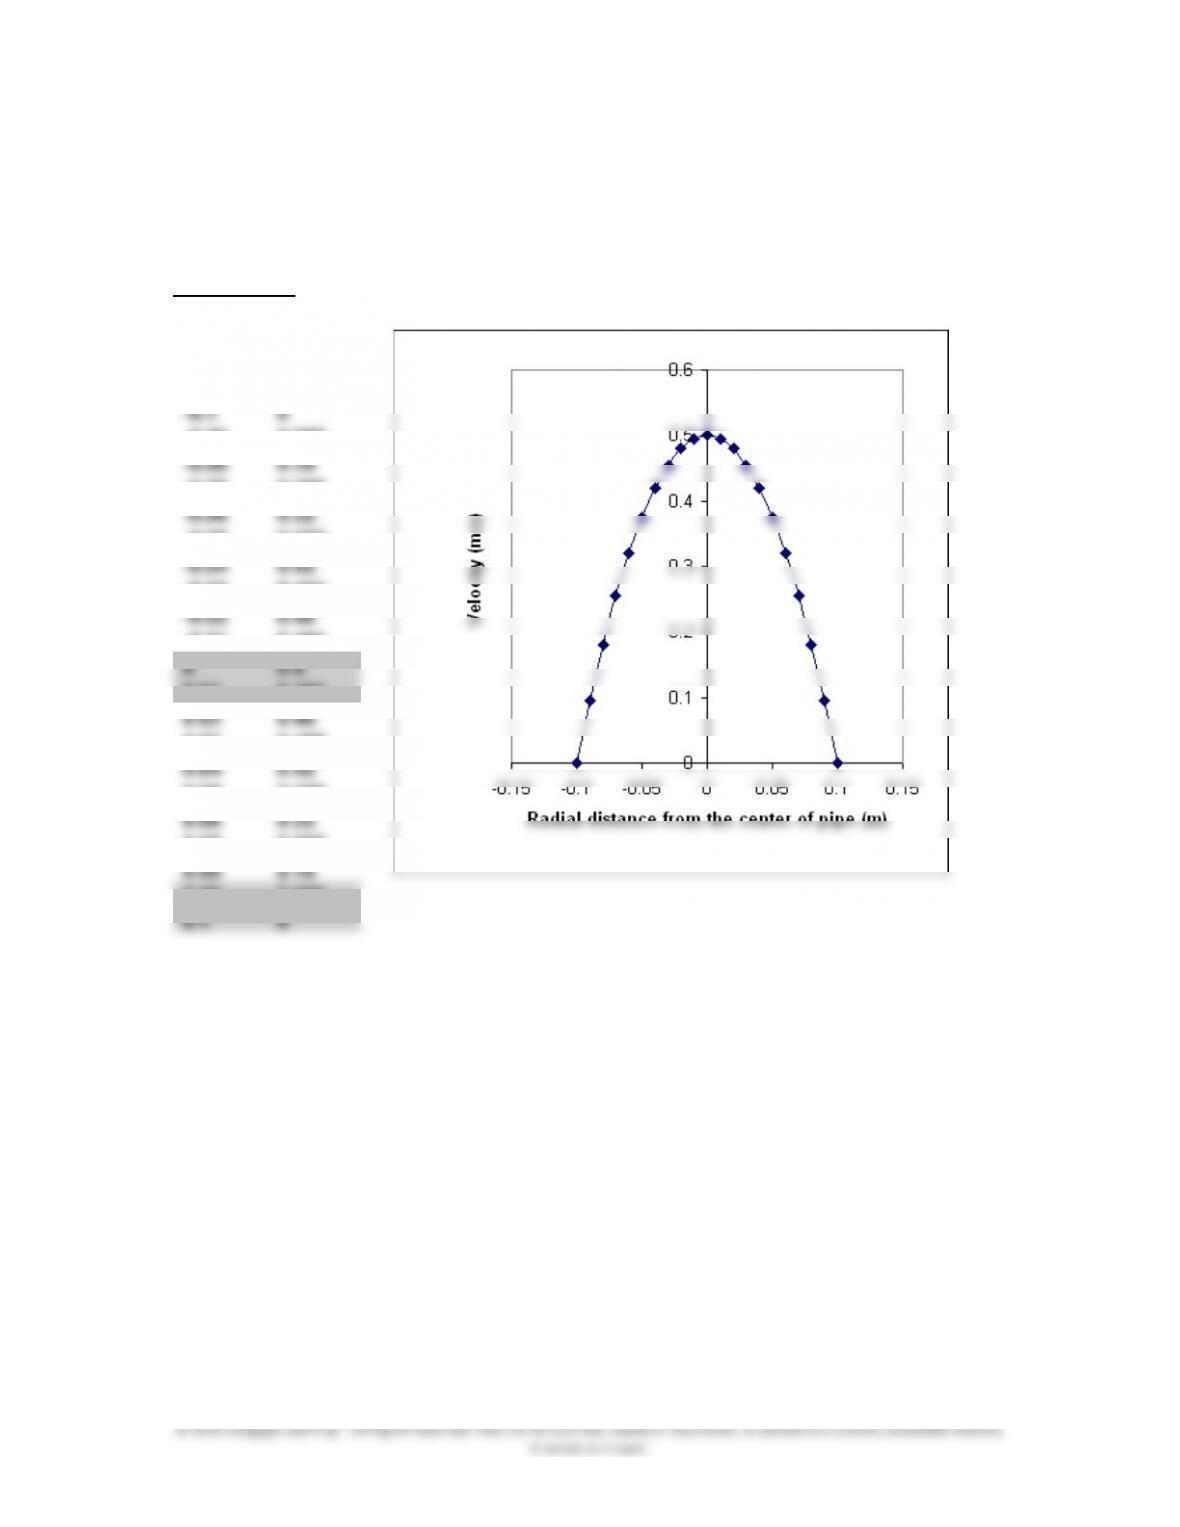
4.18 The given data represent the velocity distribution for a flow of a fluid inside a
circular pipe with a radius of 0.1 m. Plot the data using engineering paper and
incorporating the ideas discussed in this chapter.
SOLUTION
r
u
(
r
)
-0.09 0.095
-0.07 0.255
-0.05 0.375
-0.03 0.455
-0.01 0.495
0.01 0.495
0.03 0.455
0.05 0.375
0.07 0.255
0.09 0.095
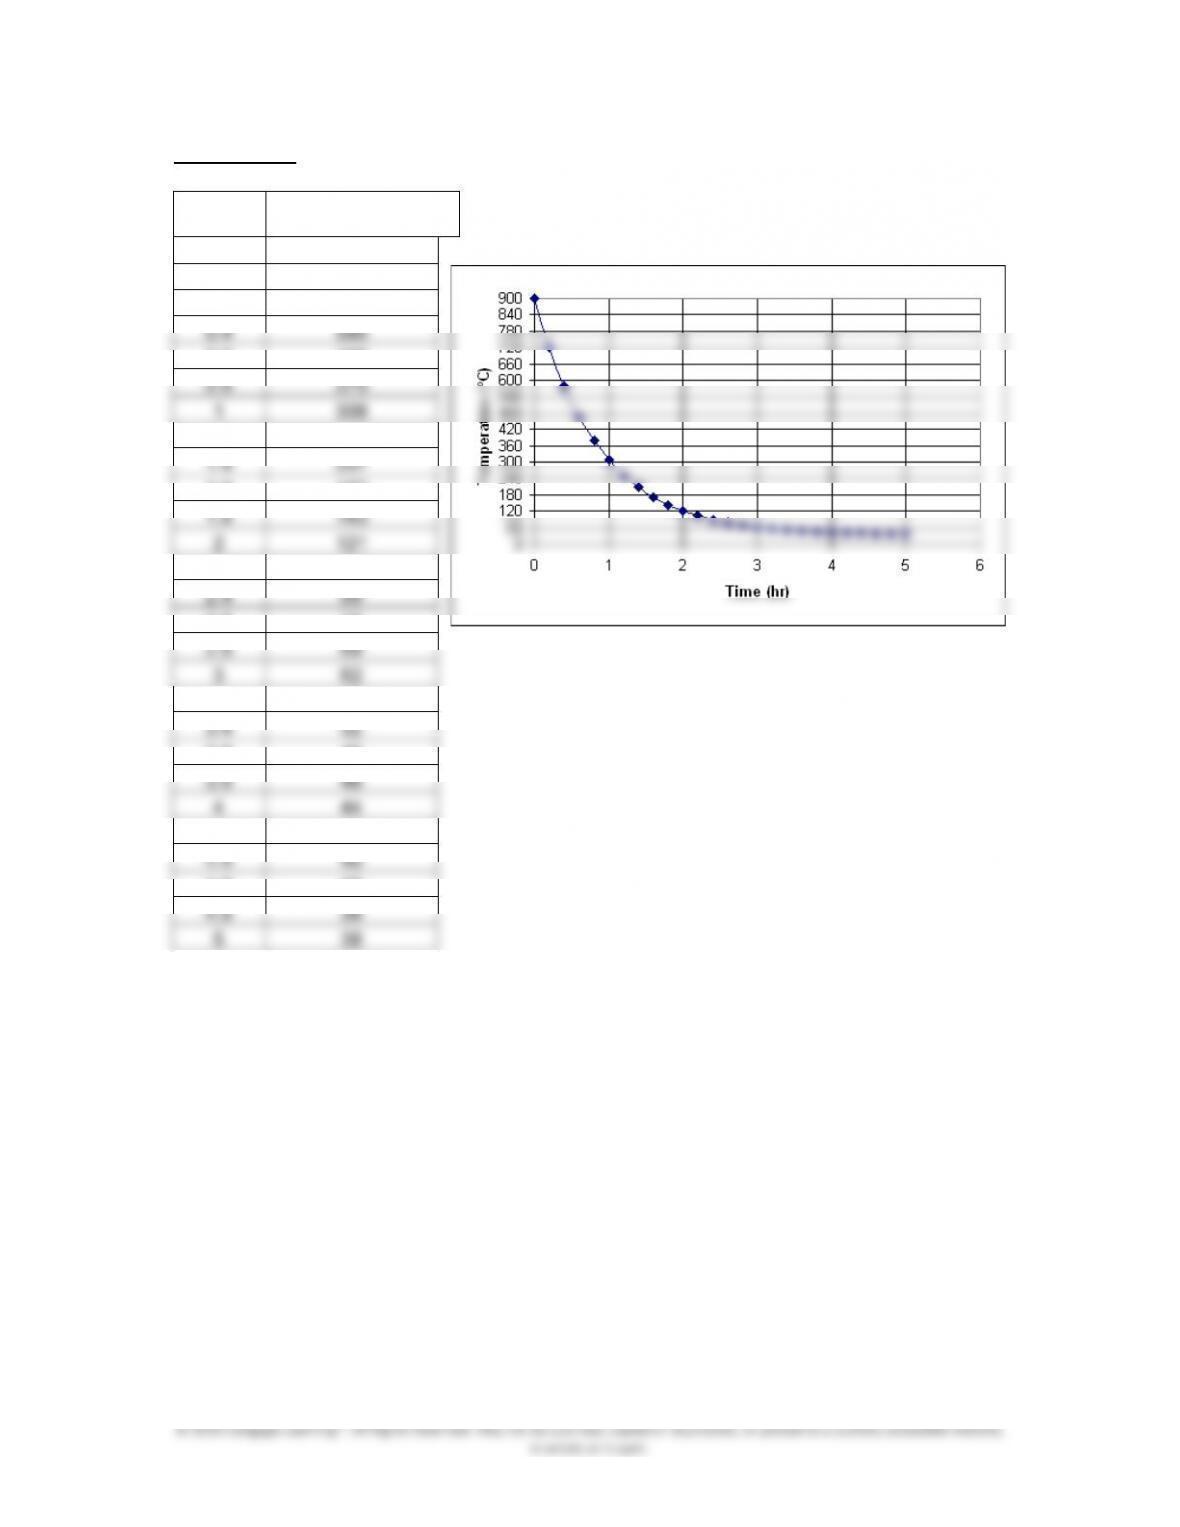
4.19 In an annealing process—a process wherein materials such as glass and metal are
heated to high temperatures and then cooled slowly to toughen them — thin steel
plates are heated to temperatures of 900oC and then cooled in an environment
with temperature of 35oC. The results of an annealing process for a thin plate are
shown below. Plot the data
7
SOLUTION
Time
(
hr
)
Temperature
(
ºC
)
0 900
0.2 722
0.6 468
1.2 252
1.6 172
2.2 103
2.6 78
3.2 57
3.6 49
4.2 42
4.6 39
4.20 The relationship between a spring force and its deflection is given in the
accompanying table. Plot the results using engineering paper and incorporating
the ideas discussed in this chapter.
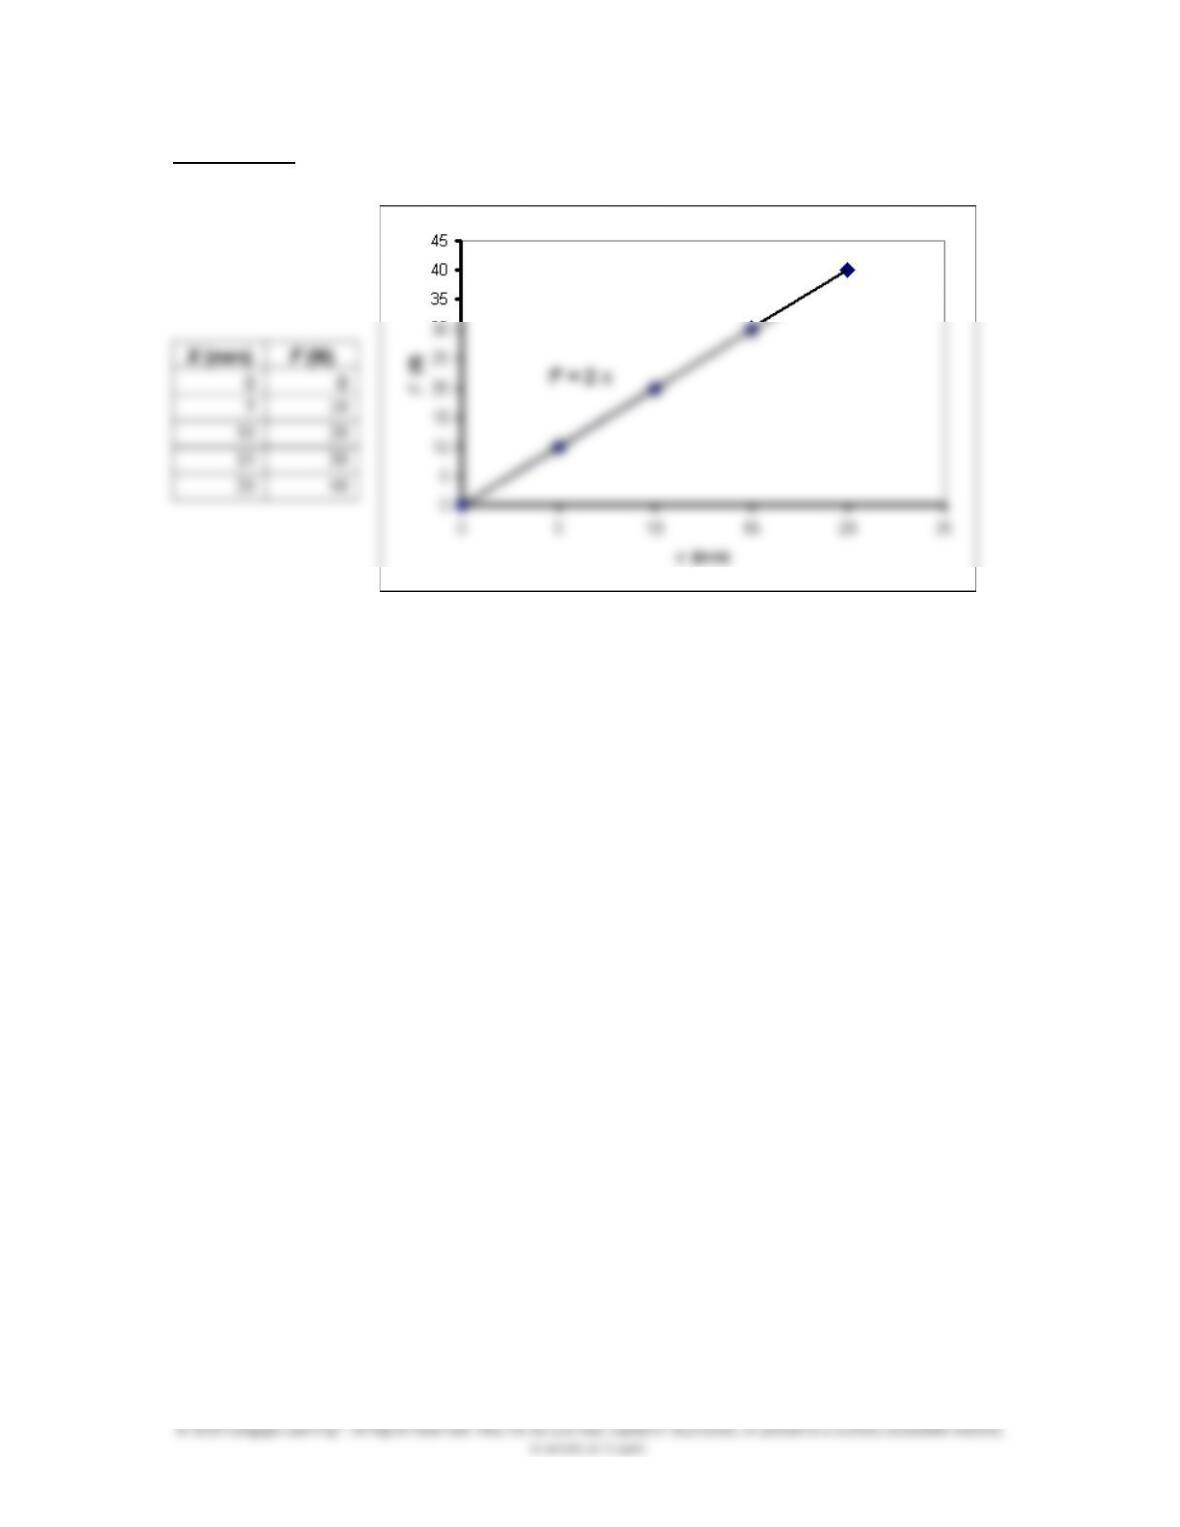
8
SOLUTION