22
CHAPTER 3. STEEL
3.1See Section 3.1.
3.3See Section 3.2.
3.5.
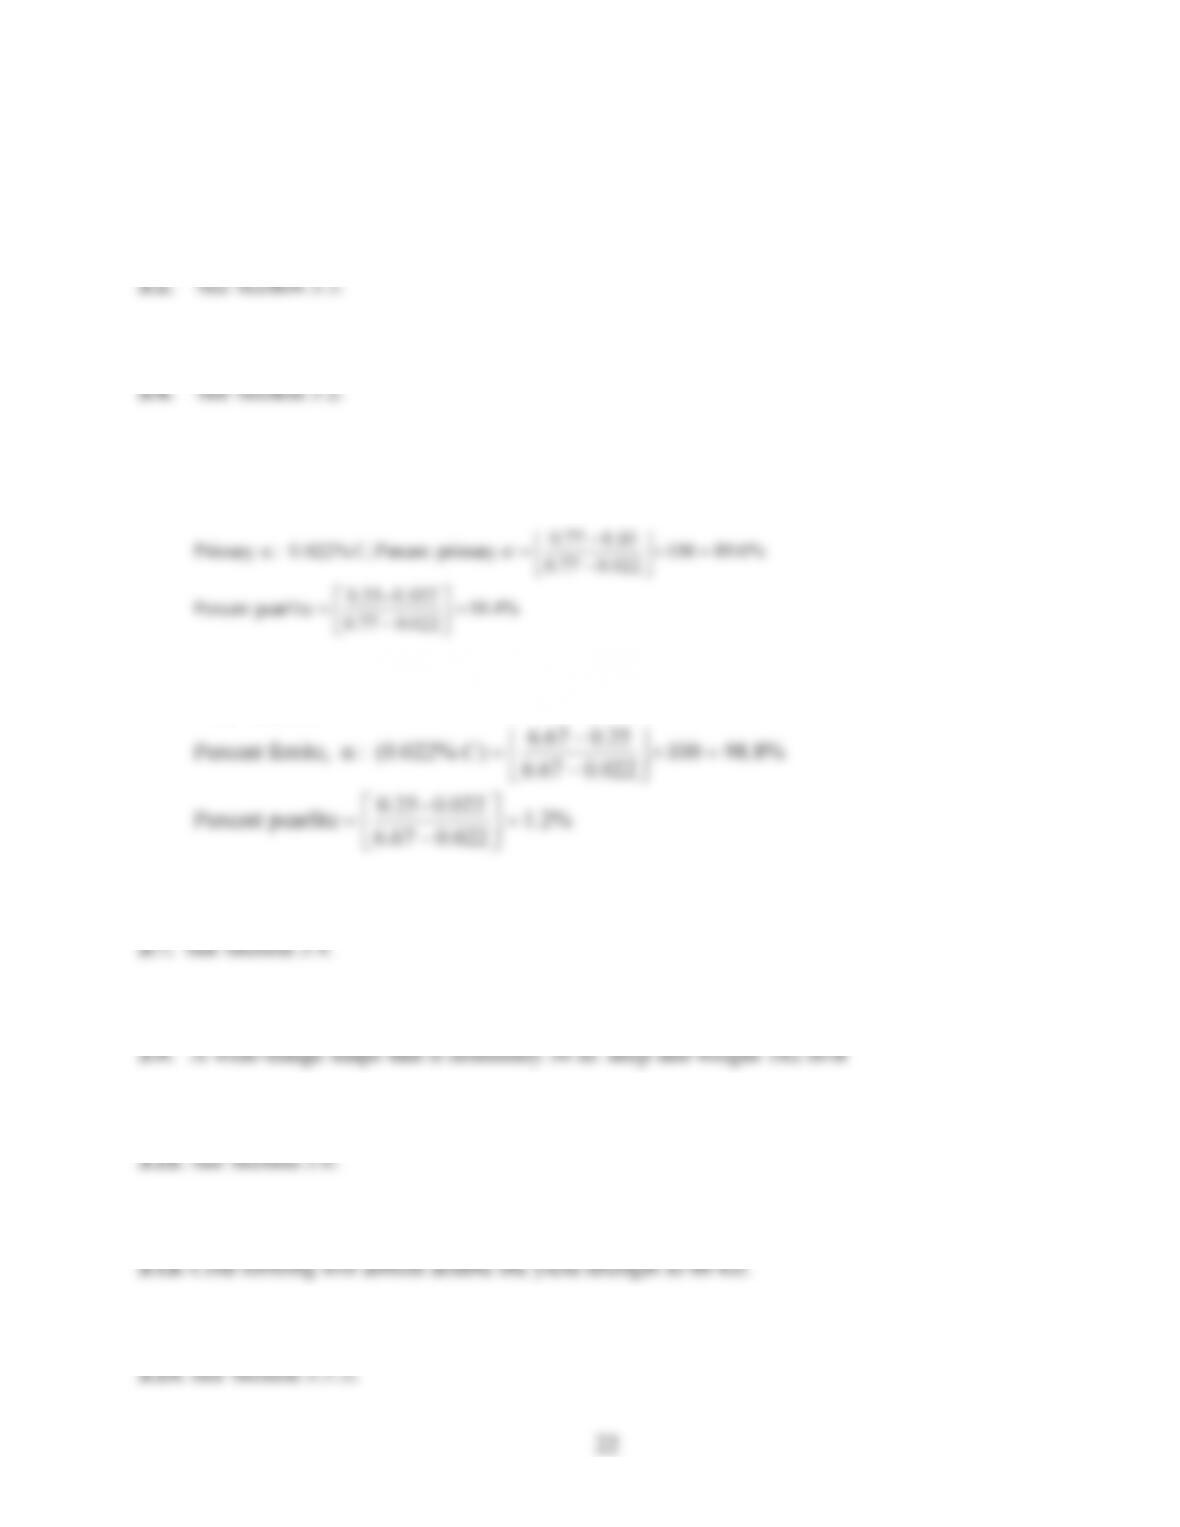
At a temperature just higher than 727qC, all the austenite will have a carbon content of 0.77%
and will transform to pearlite. The ferrite will remain as primary ferrite. The proportions can be
determined from using the lever rule.
%4.10
022.077.0
0.022–0.25
pearlitePercent
%6.89100
022.077.0
10.077.0
primary Percent C,0.022%:αPrimary
»
¼
º
«
¬
ª
u
»
¼
º
«
¬
ª
D
At a temperature just below 727qC the phases are ferrite and iron carbide. The ferrite will have
0.022% carbon.
%2.1
022.067.6
0.022–0.25
pearlitePercent
%8.98100
022.067.6
25.067.6
)%022.0(:α ferrite,Percent
»
¼
º
«
¬
ª
u
»
¼
º
«
¬
ª
C
3.6. See Section 3.3.
3.8. See Section 3.4.
3.10. See Section 3.5.3.
3.12. See Section 3.6.
3.14. See Section 3.7.
23
3.16. See Section 3.9.
3.18. See Figures 3.17 and 3.18. Increasing carbon content increases yield strength, does not
change modulus of elasticity, and decreases ductility.
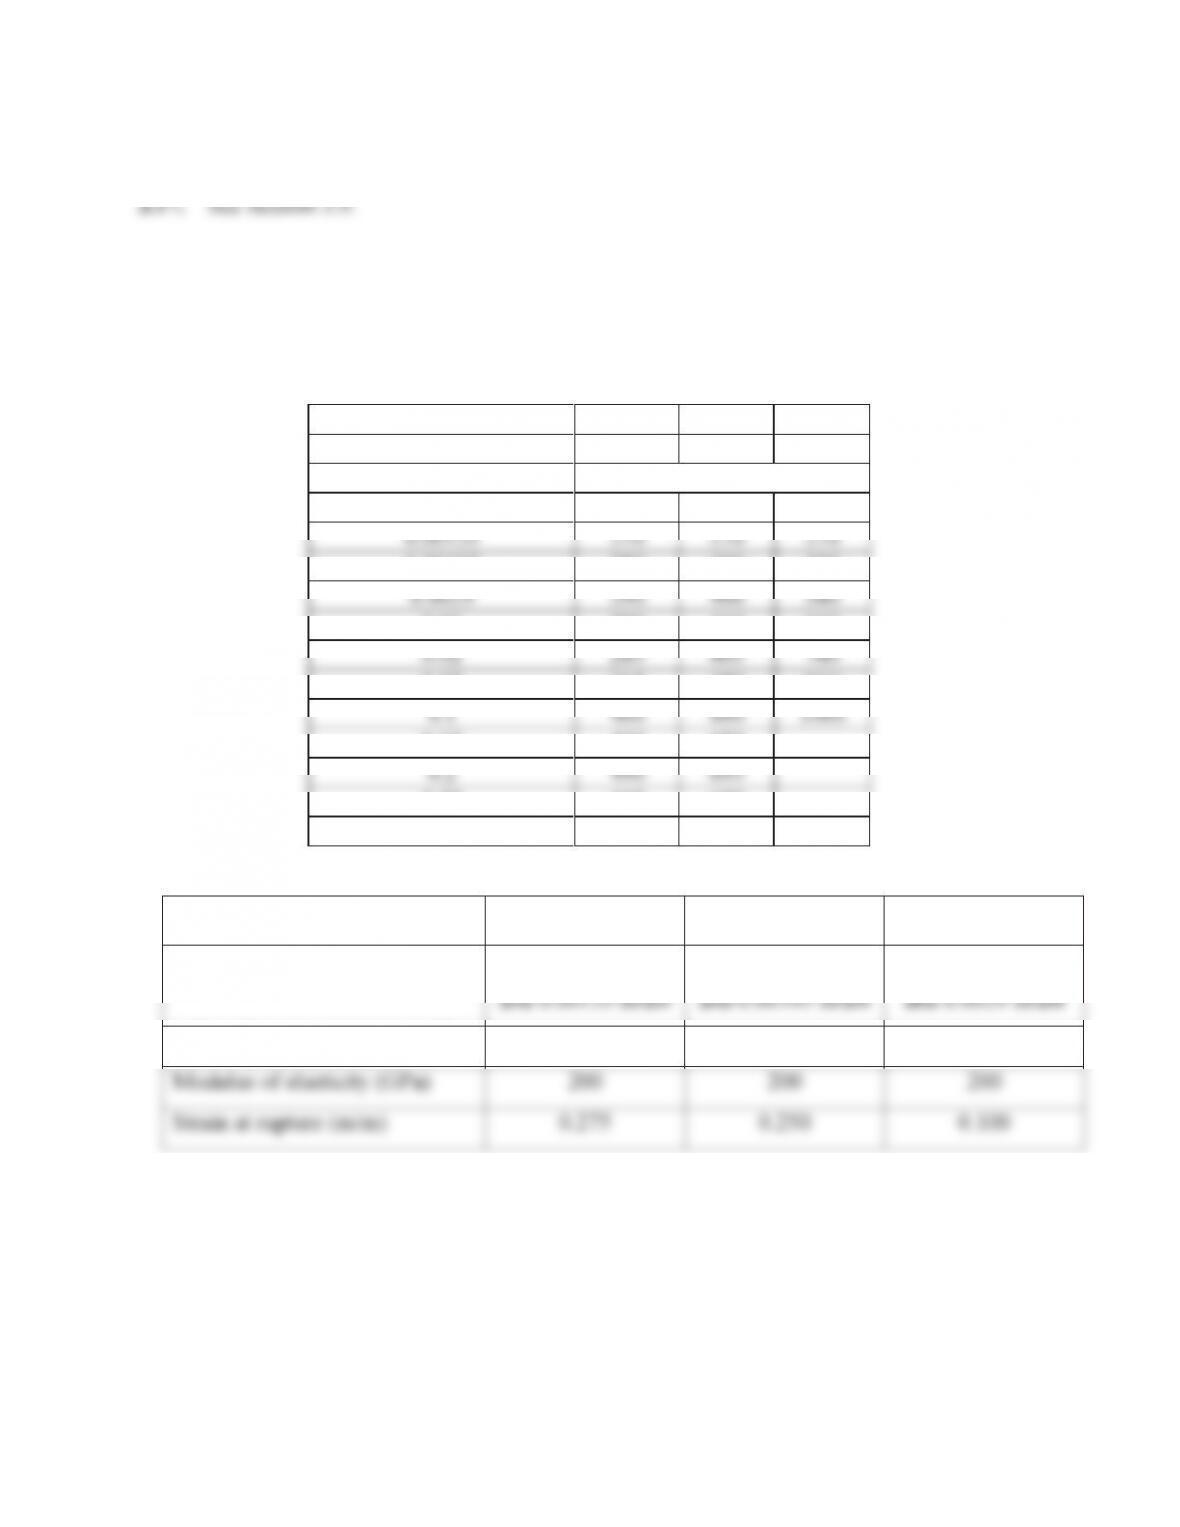
3.19.
Specimen No.
1
2
3
Carbon Content (%)
0.2
0.5
0.8
Strain (m/m)
Stress (MPa)
0
0
0
0
0.00135
270
270
270
0.00195
280
390
390
0.0029
290
400
580
0.01
300
410
660
0.02
285
405
780
0.05
315
480
910
0.1
400
600
1000
0.15
460
685
0.2
490
695
0.25
445
620
0.275
400
Specimen No.
1
2
3
Proportional limit
270 MPa stress
and 0.00135 strain
390 MPa stress
and 0.00195 strain
580 MPa stress
and 0.0029 strain
0.2% offset yield strength (GPa)
290
400
600
Modulus of elasticity (GPa)
200
200
200
Strain at rupture (m/m)
0.275
0.250
0.100
Increasing carbon content increases yield strength, does not change modulus of elasticity, and
decreases ductility.
24
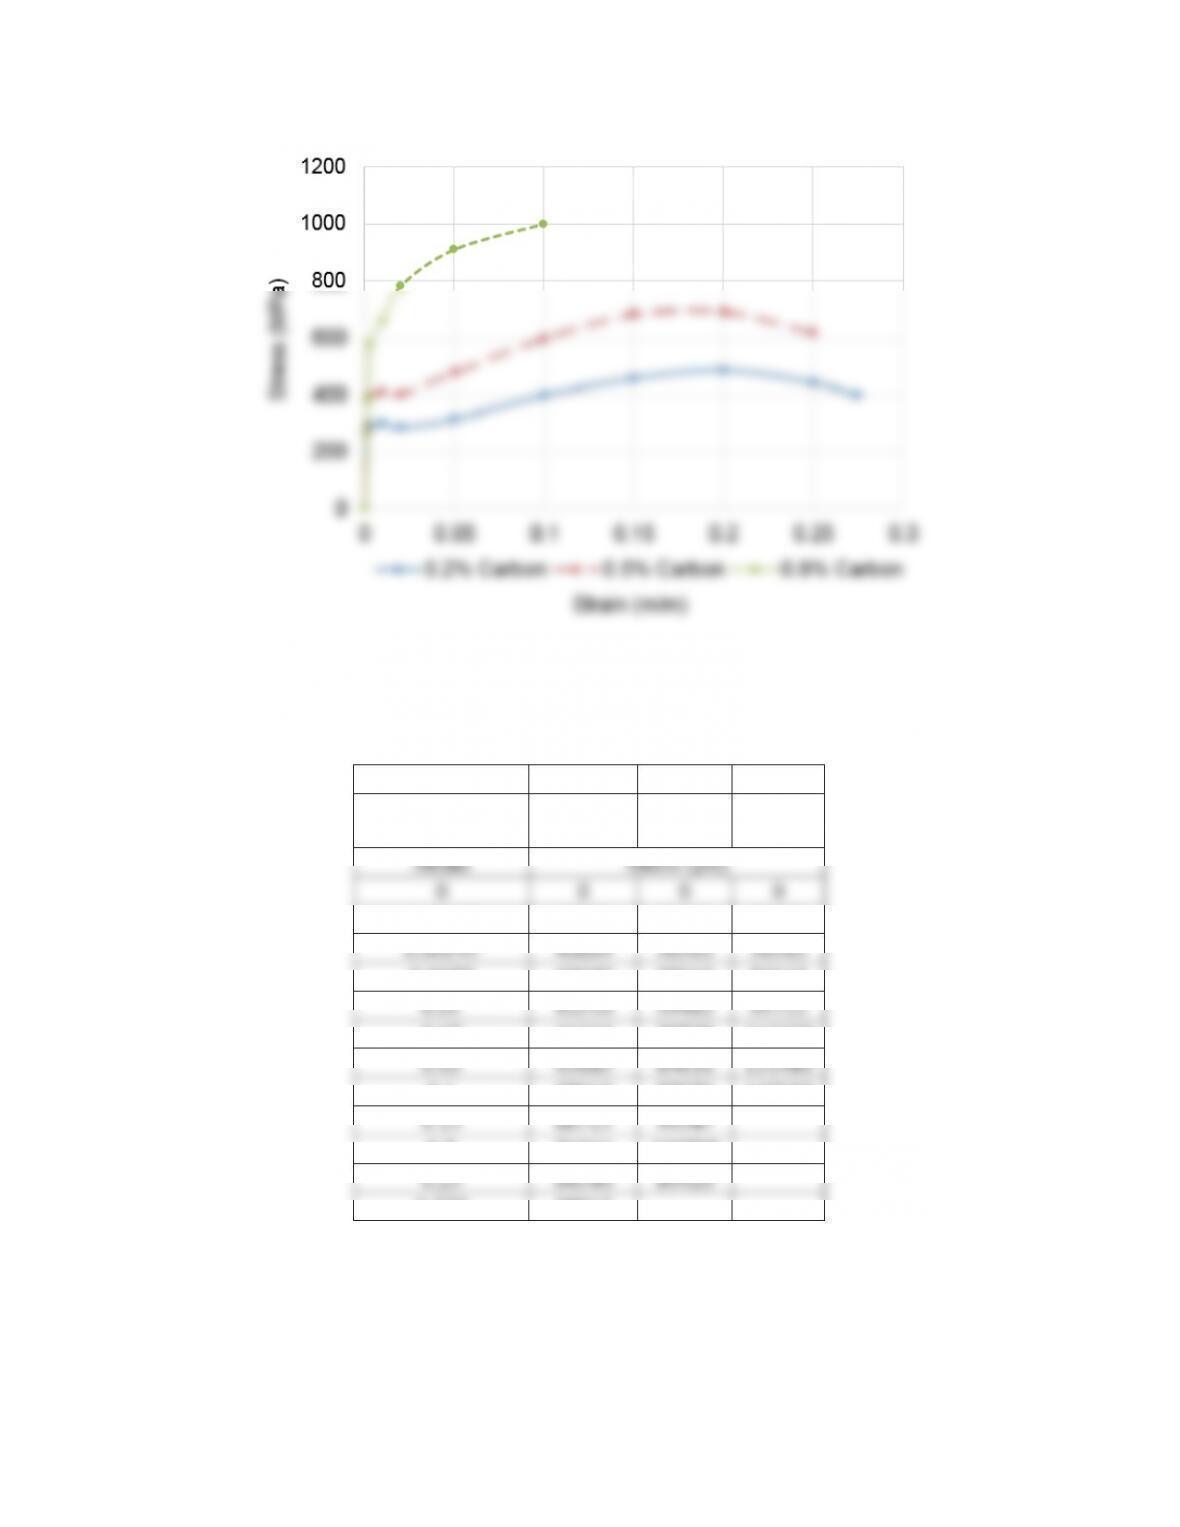
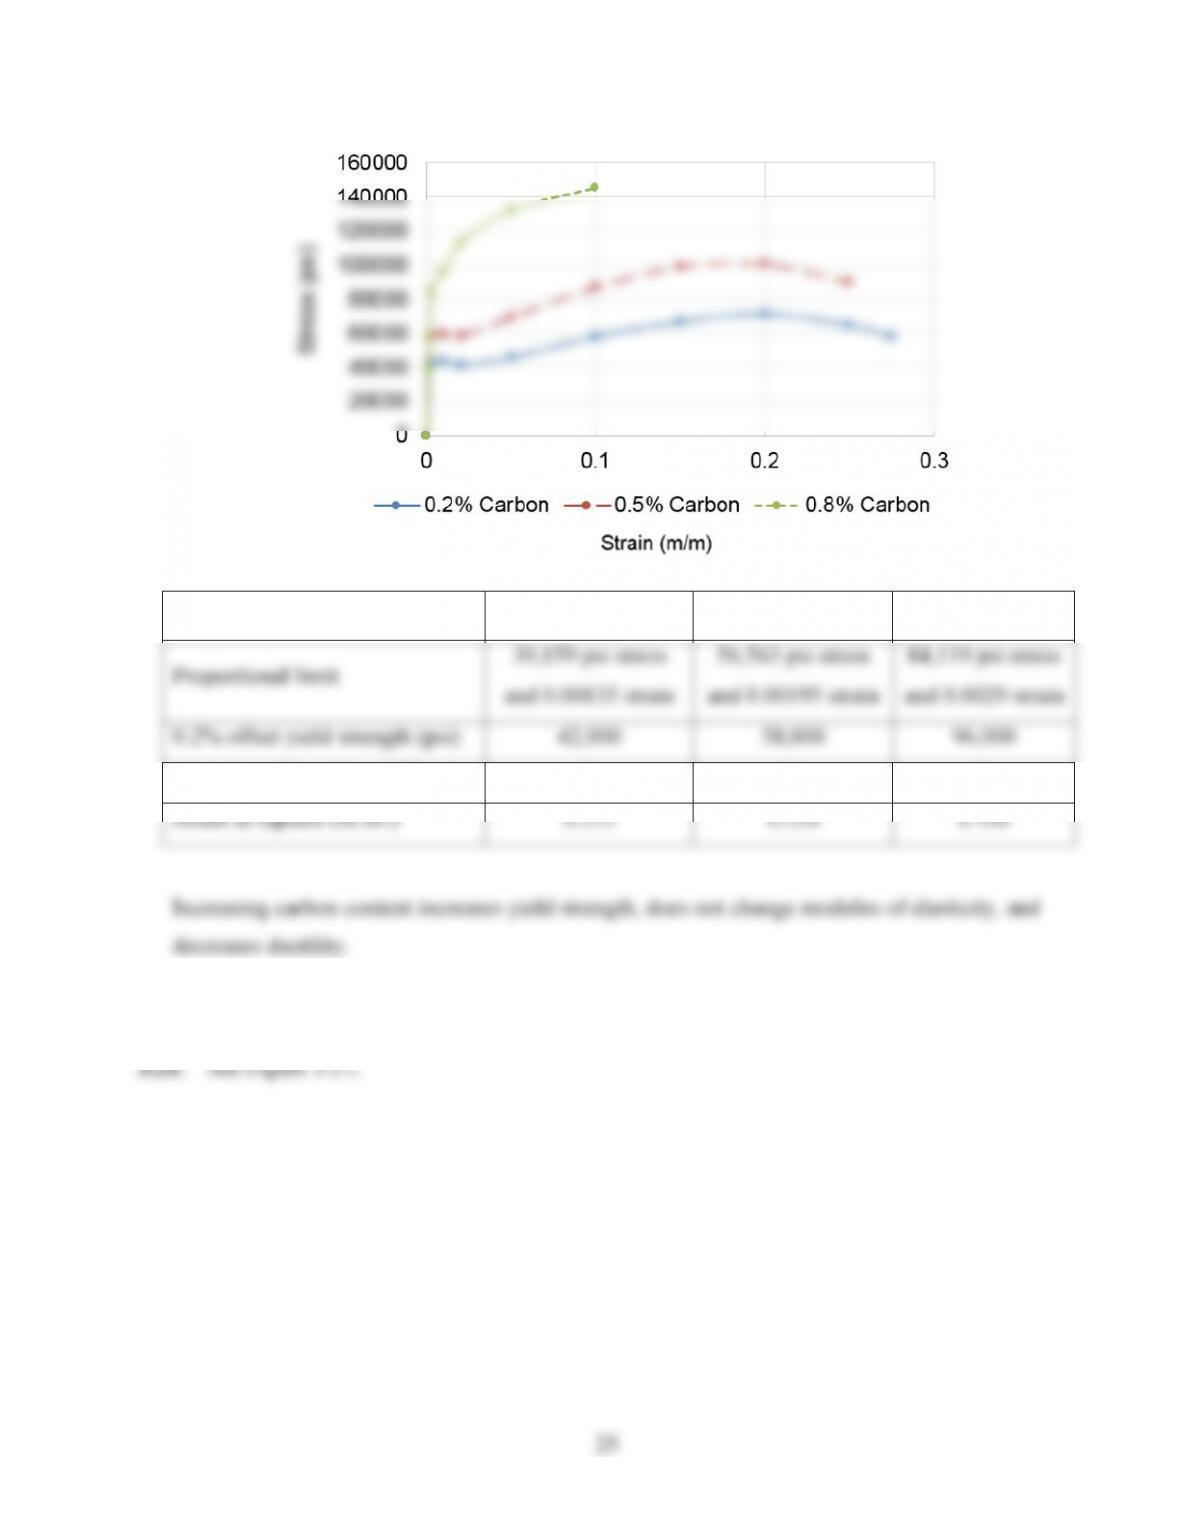
3.20.
Specimen No.
1
2
3
Carbon Content
(%)
0.2
0.5
0.8
Strain
Stress (psi)
0
0
0
0
0.00135
39159
39159
39159
0.00195
40609
56563
56563
0.0029
42059
58013
84119
0.01
43510
59463
95722
0.02
41334
58738
113125
0.05
45685
69616
131980
0.1
58013
87020
145033
0.15
66715
99347
0.2
71066
100798
0.25
64540
89920
0.275
58013
25
Specimen No.
1
2
3
Proportional limit
39,159 psi stress
and 0.00135 strain
56,563 psi stress
and 0.00195 strain
84,119 psi stress
and 0.0029 strain
0.2% offset yield strength (psi)
42,000
58,000
96,000
Modulus of elasticity (106psi)
29
29
29
Strain at rupture (in./in.)
0.275
0.250
0.100
Increasing carbon content increases yield strength, does not change modulus of elasticity, and
decreases ductility.
3.21. See Figure 3.17.
26
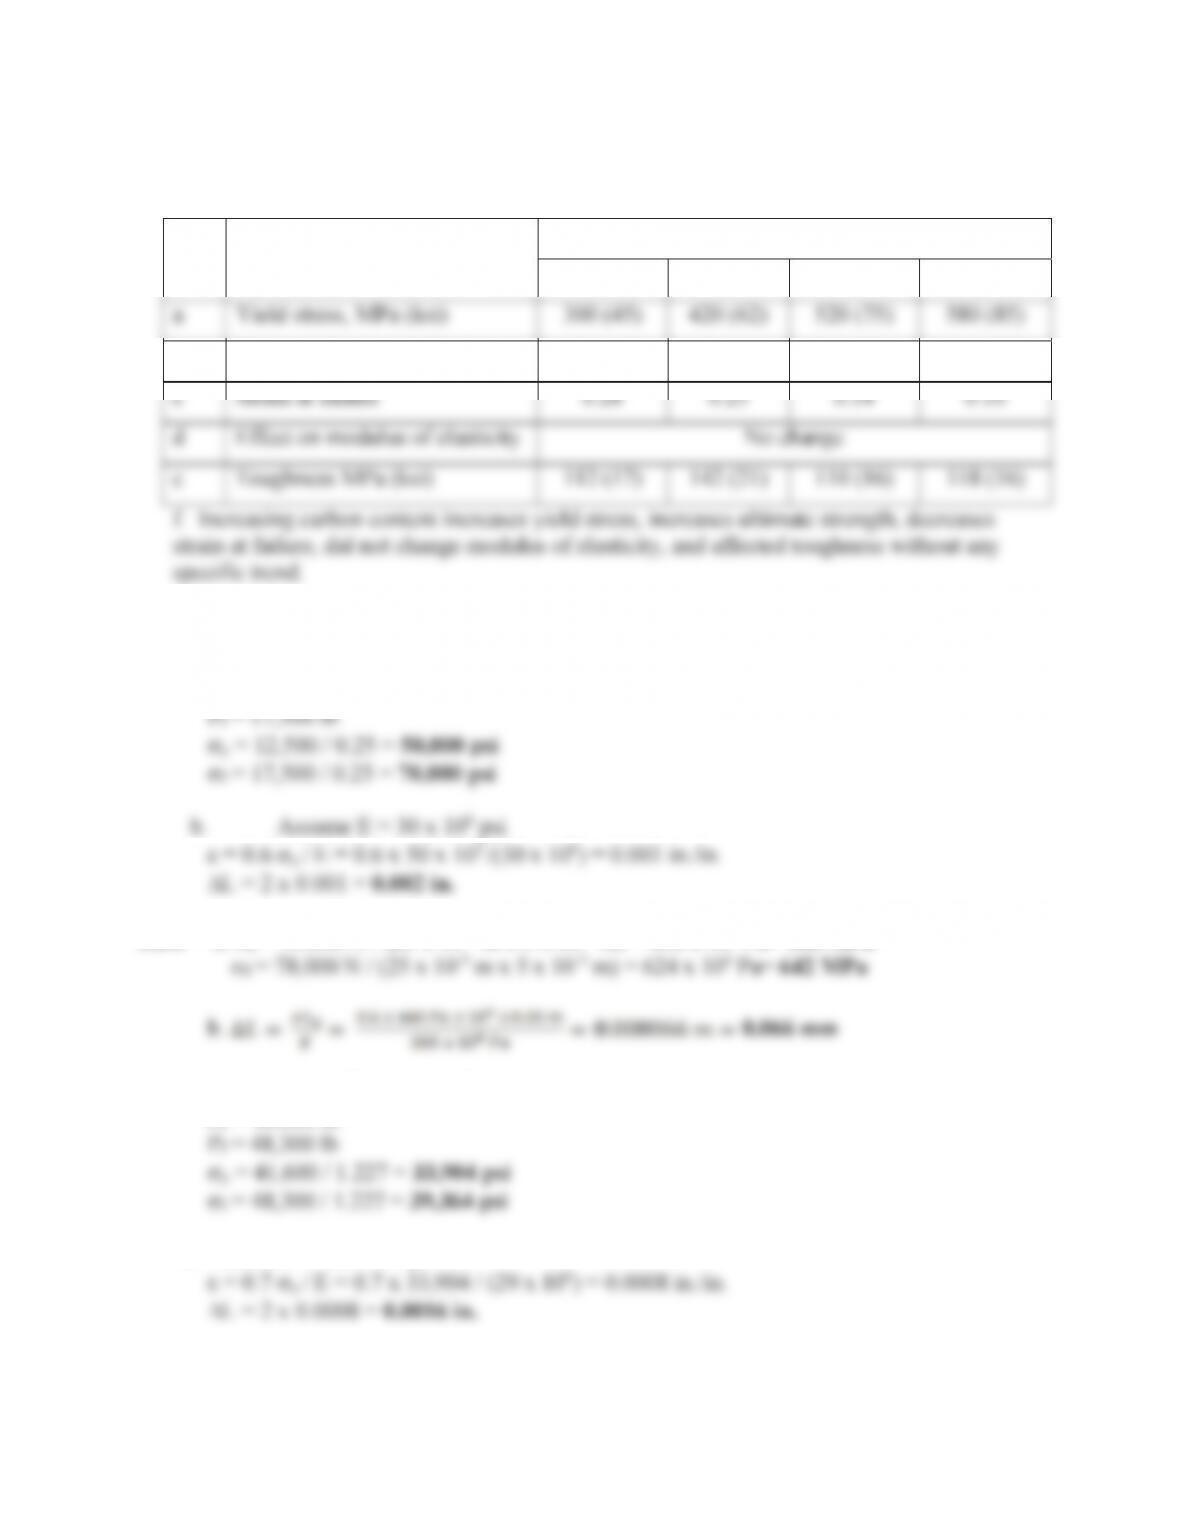
3.22.
Property
Carbon Content (%)
0.19
0.49
0.64
0.90
a
Yield stress, MPa (ksi)
300 (45)
420 (62)
520 (75)
580 (85)
b
Ultimate strength, MPa (ksi)
520 (65)
680 (100)
890 (132)
1180 (156)
c
Strain at failure
0.28
0.25
0.14
0.10
d
Effect on modulus of elasticity
No change
e
Toughness MPa (ksi)
112 (17)
142 (21)
110 (16)
118 (16)
f. Increasing carbon content increases yield stress, increases ultimate strength, decreases
strain at failure, did not change modulus of elasticity, and affected toughness without any
specific trend.
3.23. a.A = 1.0 x 0.25 = 0.25 in.2
Py= 12,500 lb
3.24DVy= 55,000 N / (25 x 10-3 mx5x 10
-3 m) = 440 x 106Pa= 440 MPa
-3 m) = 624 x 106Pa= 642 MPa
3.25. a.A = S(10/8/2)2= 1.227 in.2
Py= 41,600 lb
b. Assume E = 29 x 106psi
27
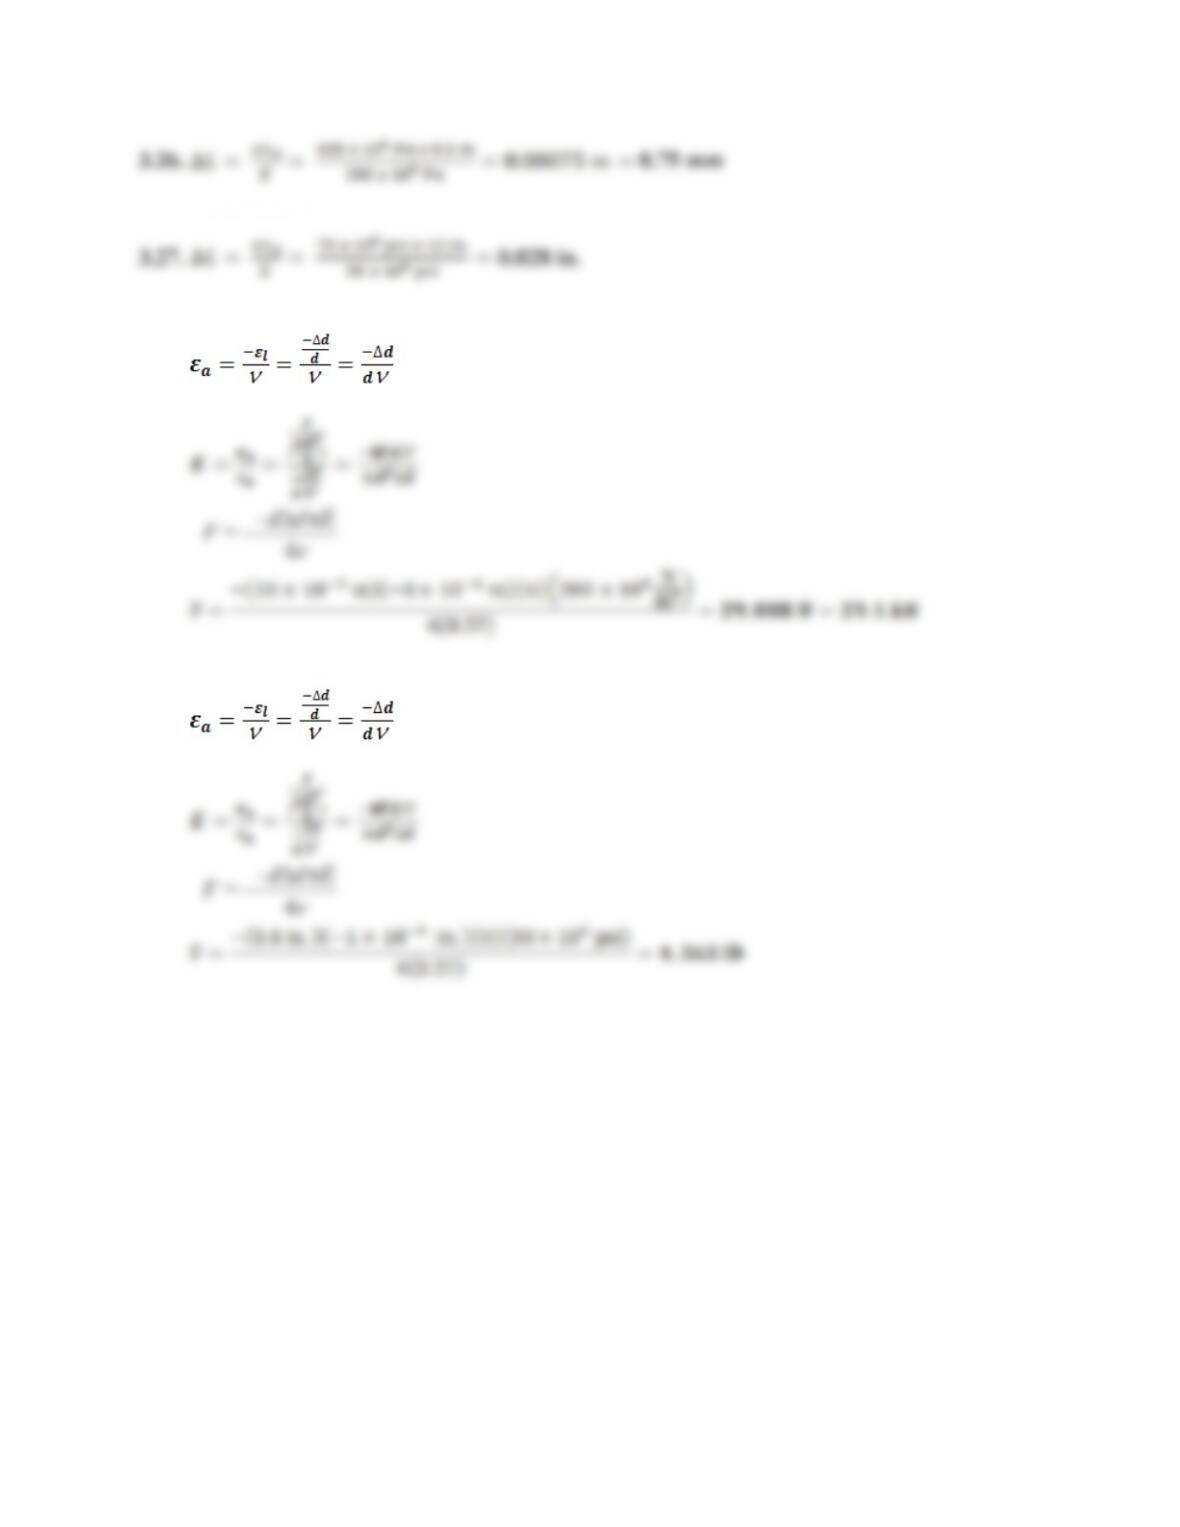
3.28
Q
4
= E
dd
–
F
S‘
3.29
Q
4
= E
dd
–
F
S‘
28
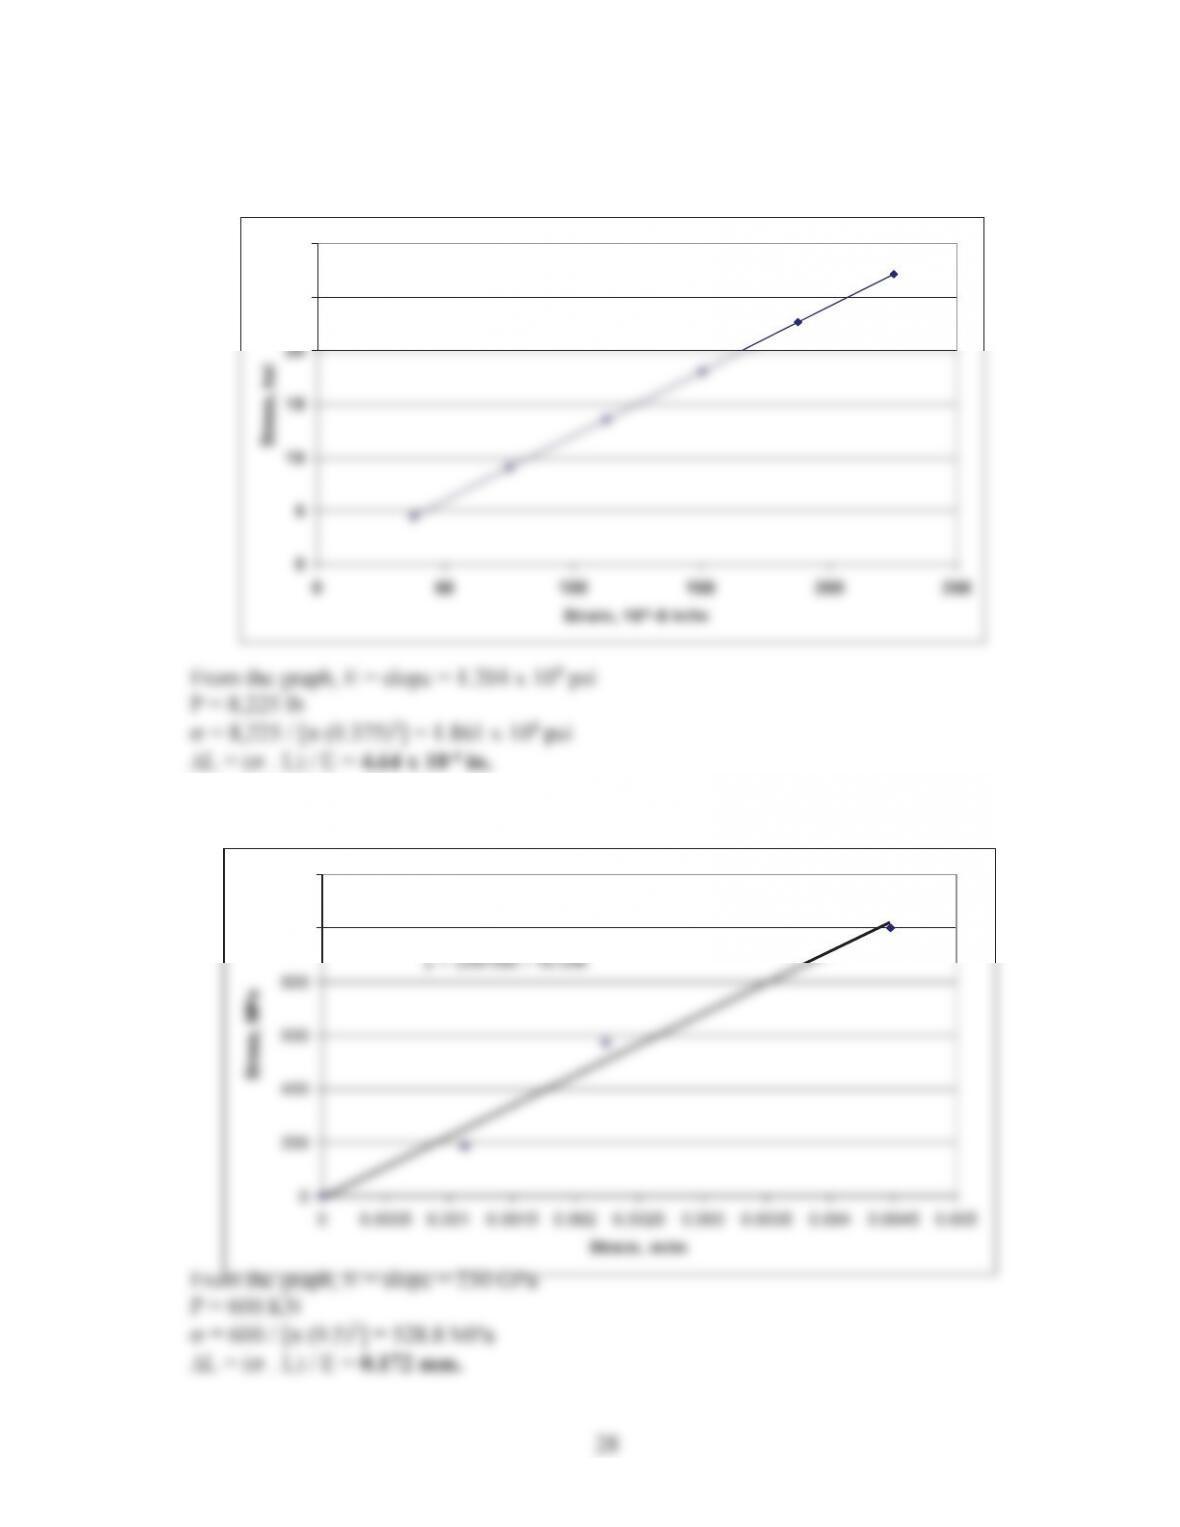
3.30. V= P / [S (0.375)2]
H=‘L / 3
0
5
10
15
20
25
30
Stress, ksi
3.31. V= P / [S (9.5)2]
H=‘L / 75
\ [
Stress, MPa
29
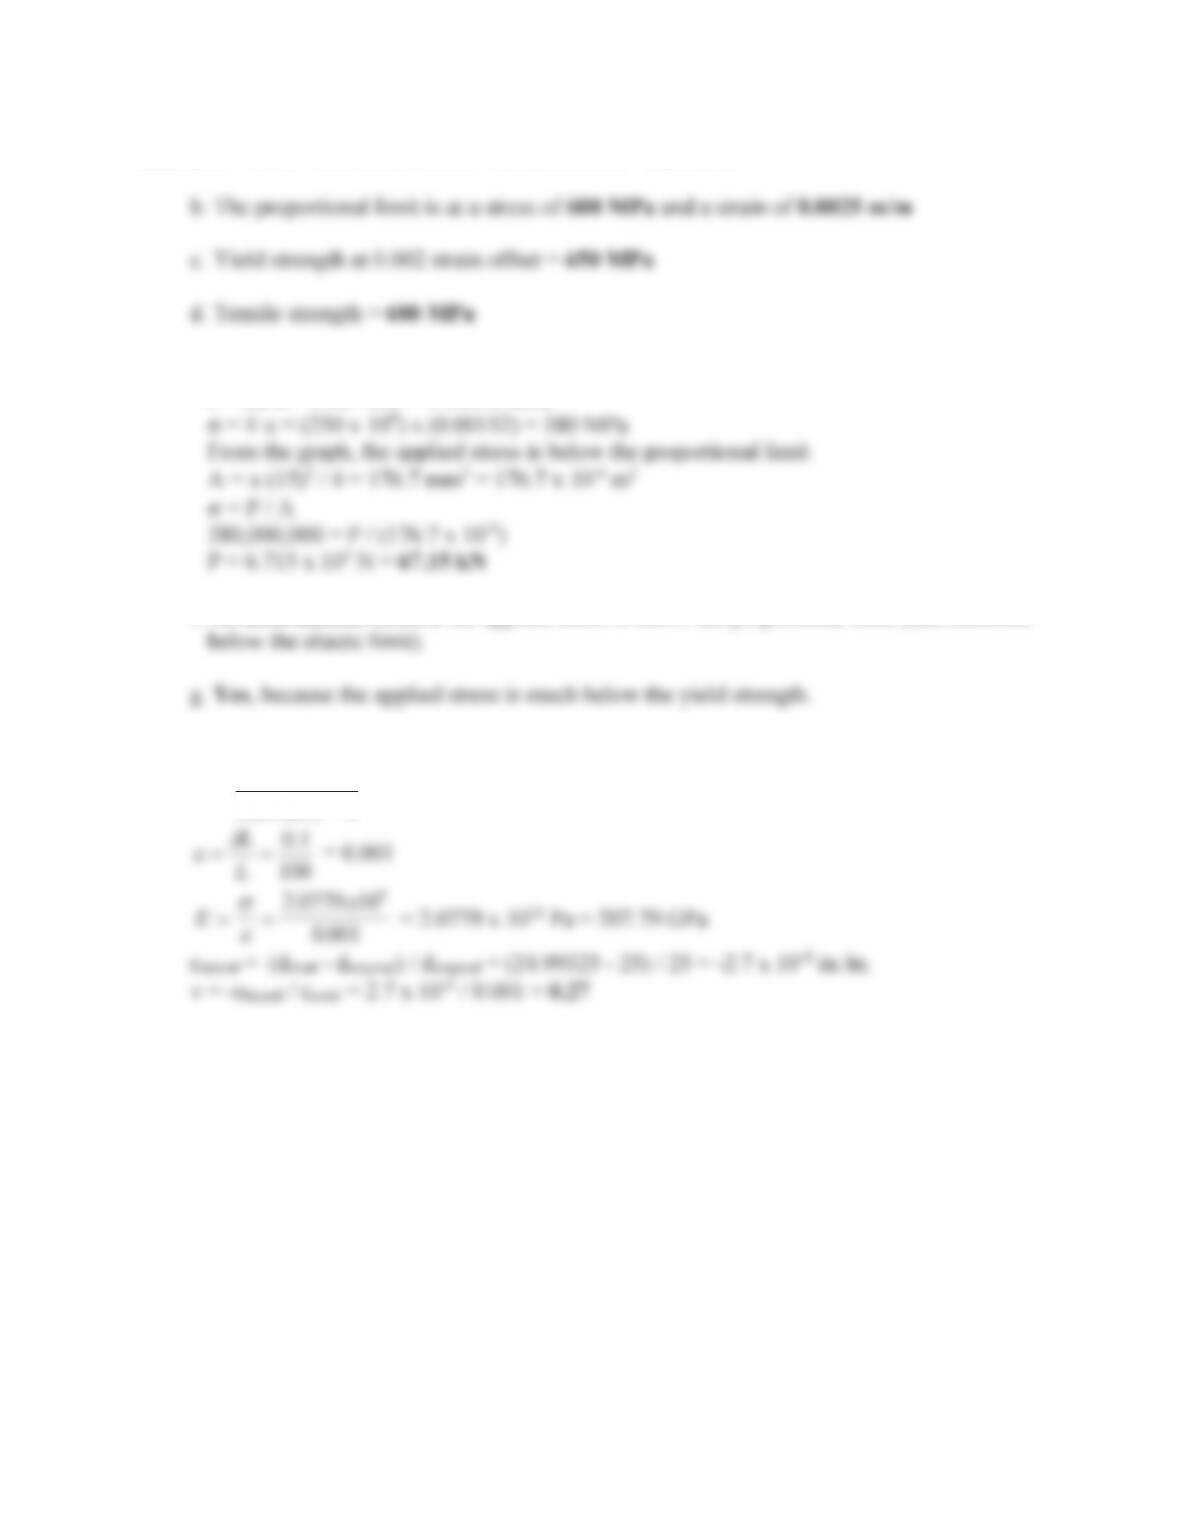
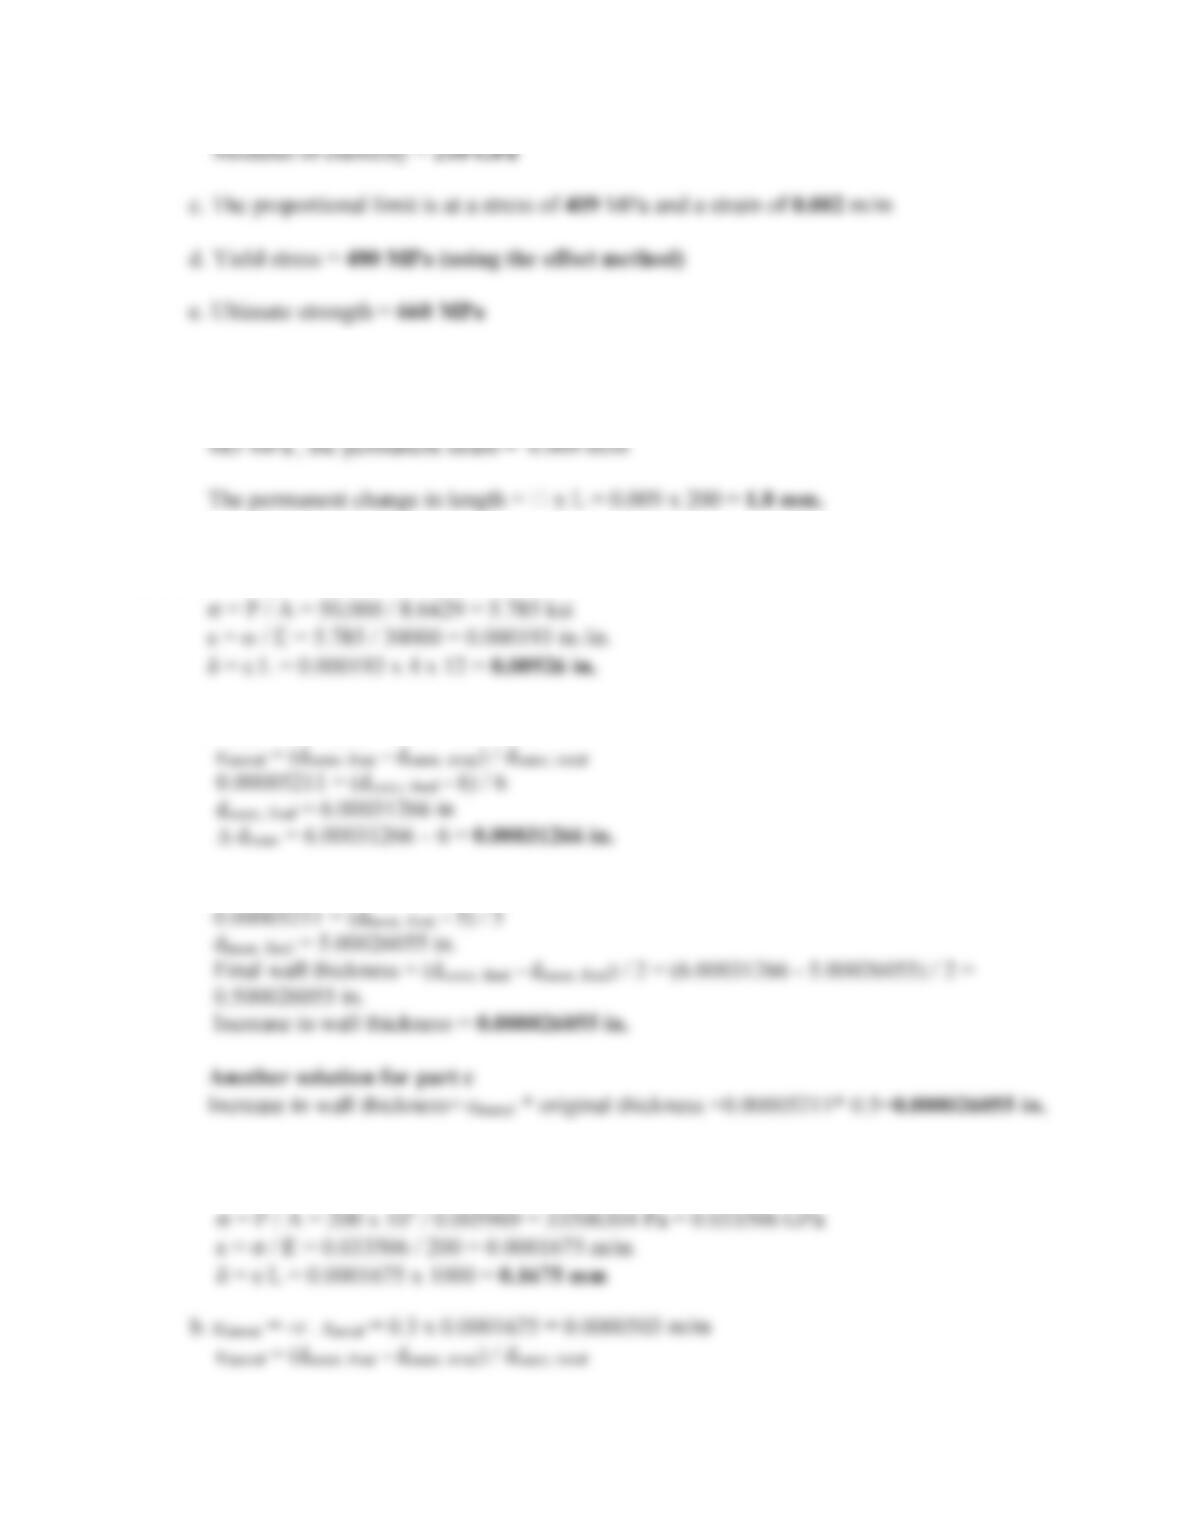
3.32. a. E = V/H = 500 MPa / 0.002 = 250,000 MPa = 250 GPa
e. ‘L = 0.38 mm
H=‘L/L =0.38 / 250 = 0.00152 m/m
f. No deformation because the applied stress is below the proportional limit (and therefore
3.33.
4/)025.0(
102000
2
S
V
= 2.0779 x 10⁸Pa
1.0
L
L
G
H
= 0.001
30
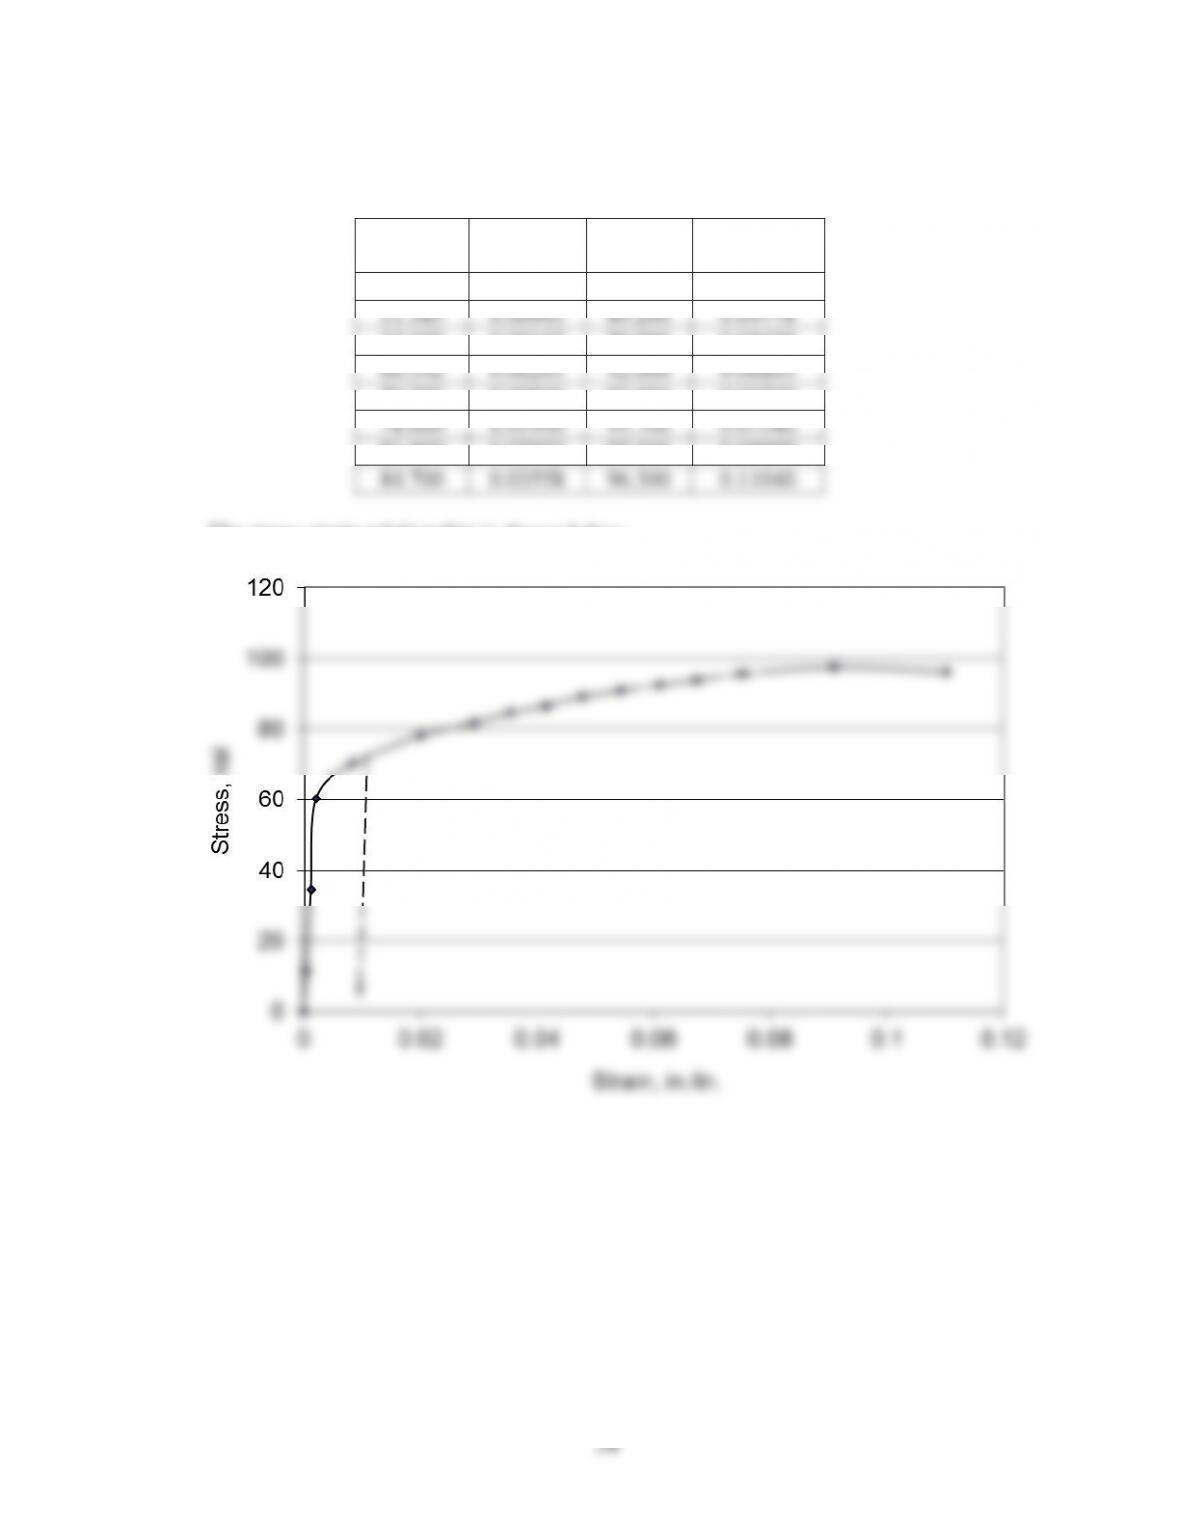
3.34. a.Stress = Load / Area
Strain = Displacement / Gage Length
Stress (ksi)
Strain (in/in)
Stress (ksi)
Strain (in/in)
0
0
43.617
0.04150
14.000
0.00048
44.766
0.04778
20.729
0.00070
45.756
0.05439
36.271
0.00121
46.617
0.06103
36.361
0.00846
47.113
0.06686
37.378
0.02098
47.607
0.07370
38.349
0.02299
48.057
0.09099
40.283
0.02923
40.078
0.14907
42.177
0.03558
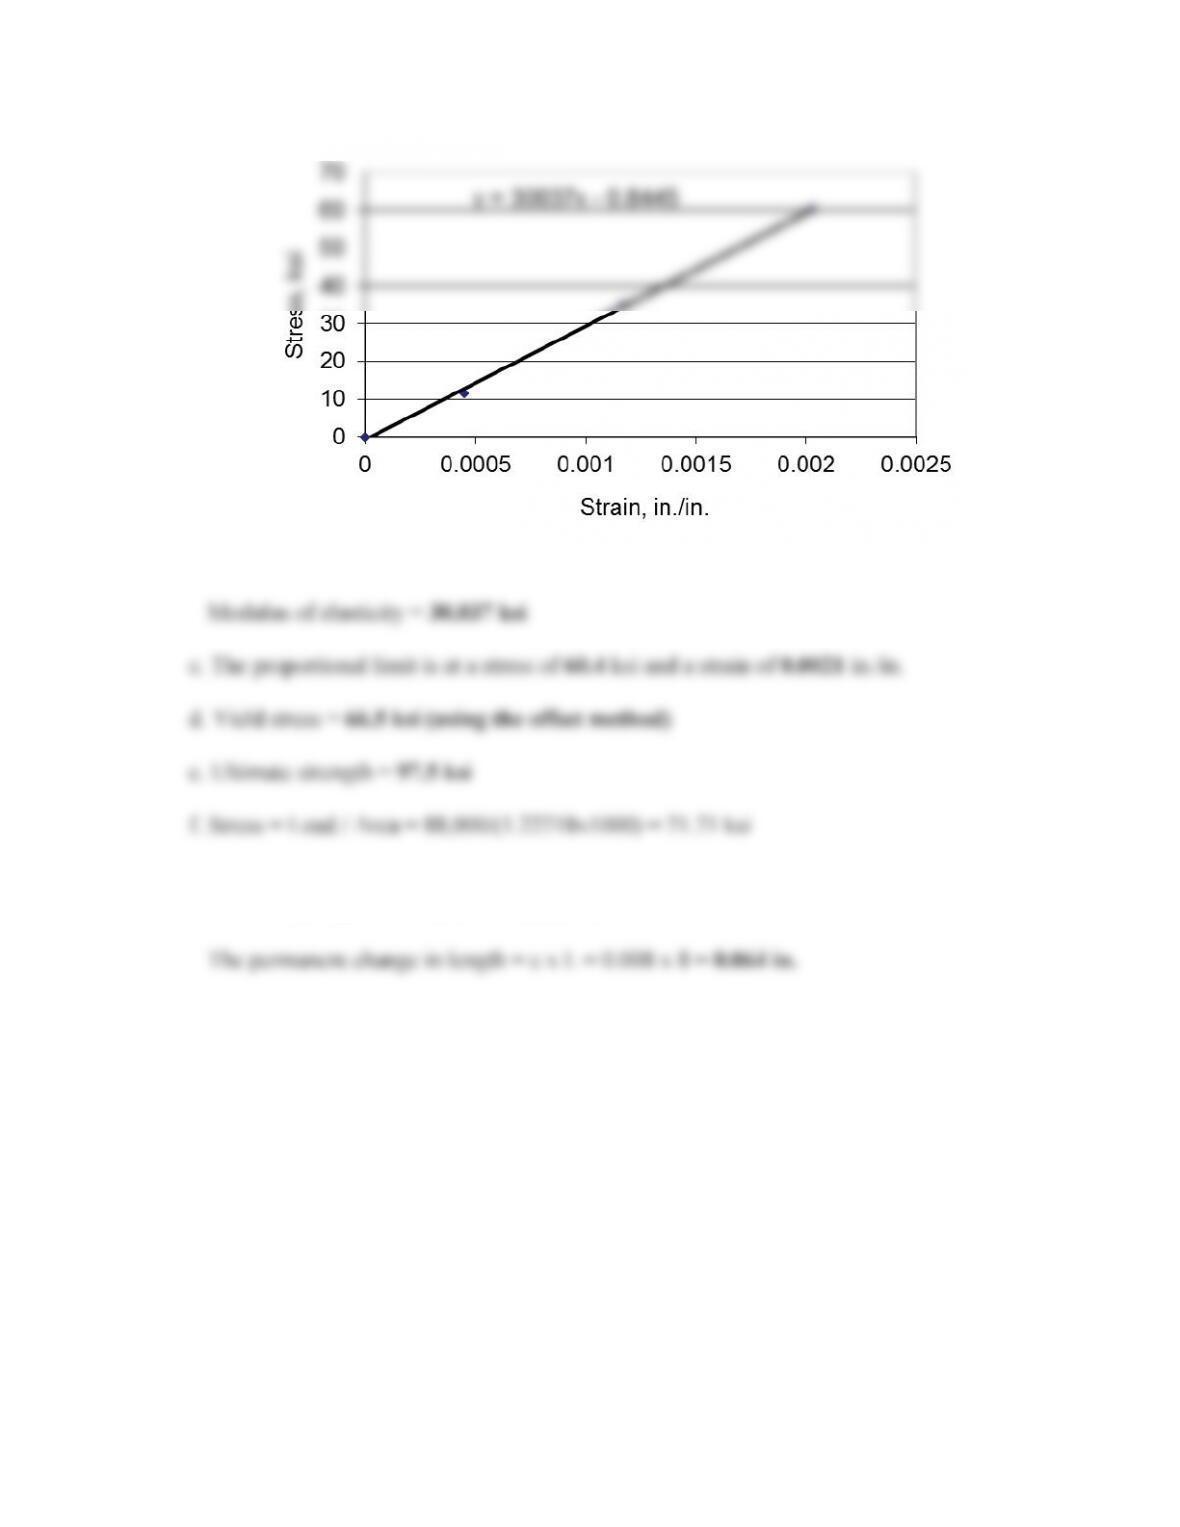
Stress-Strain Relation
b.
\ [
32
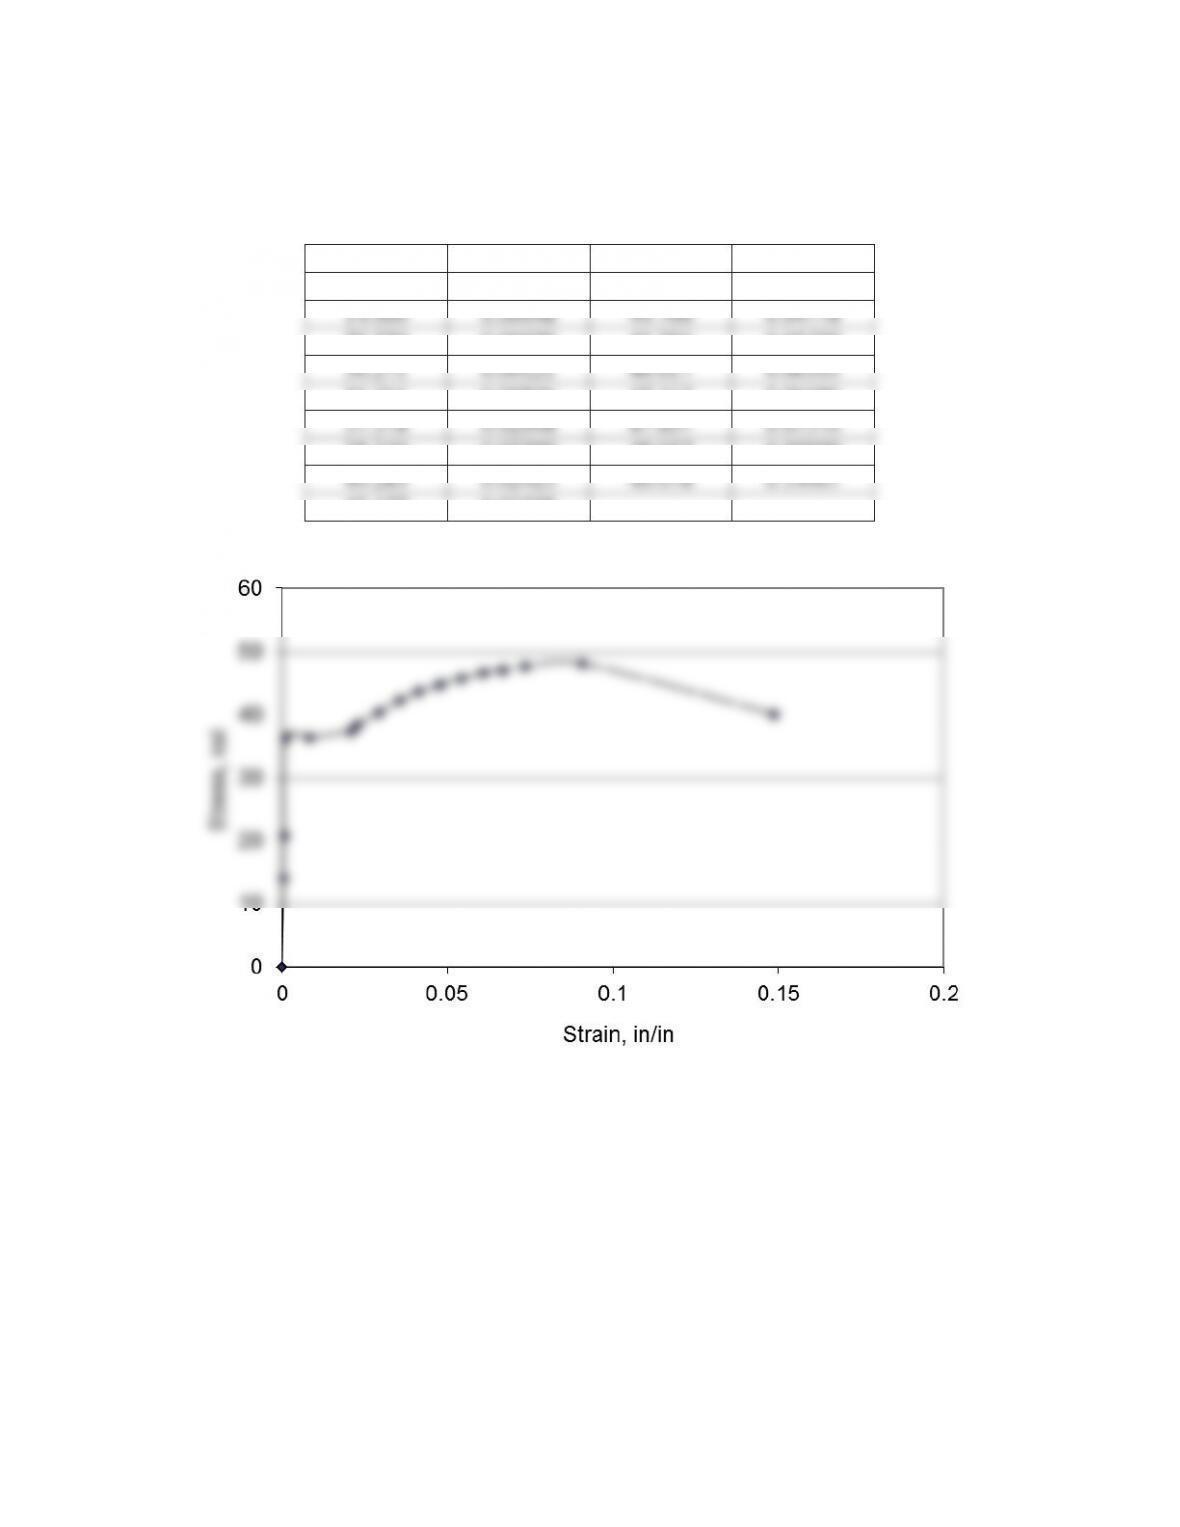
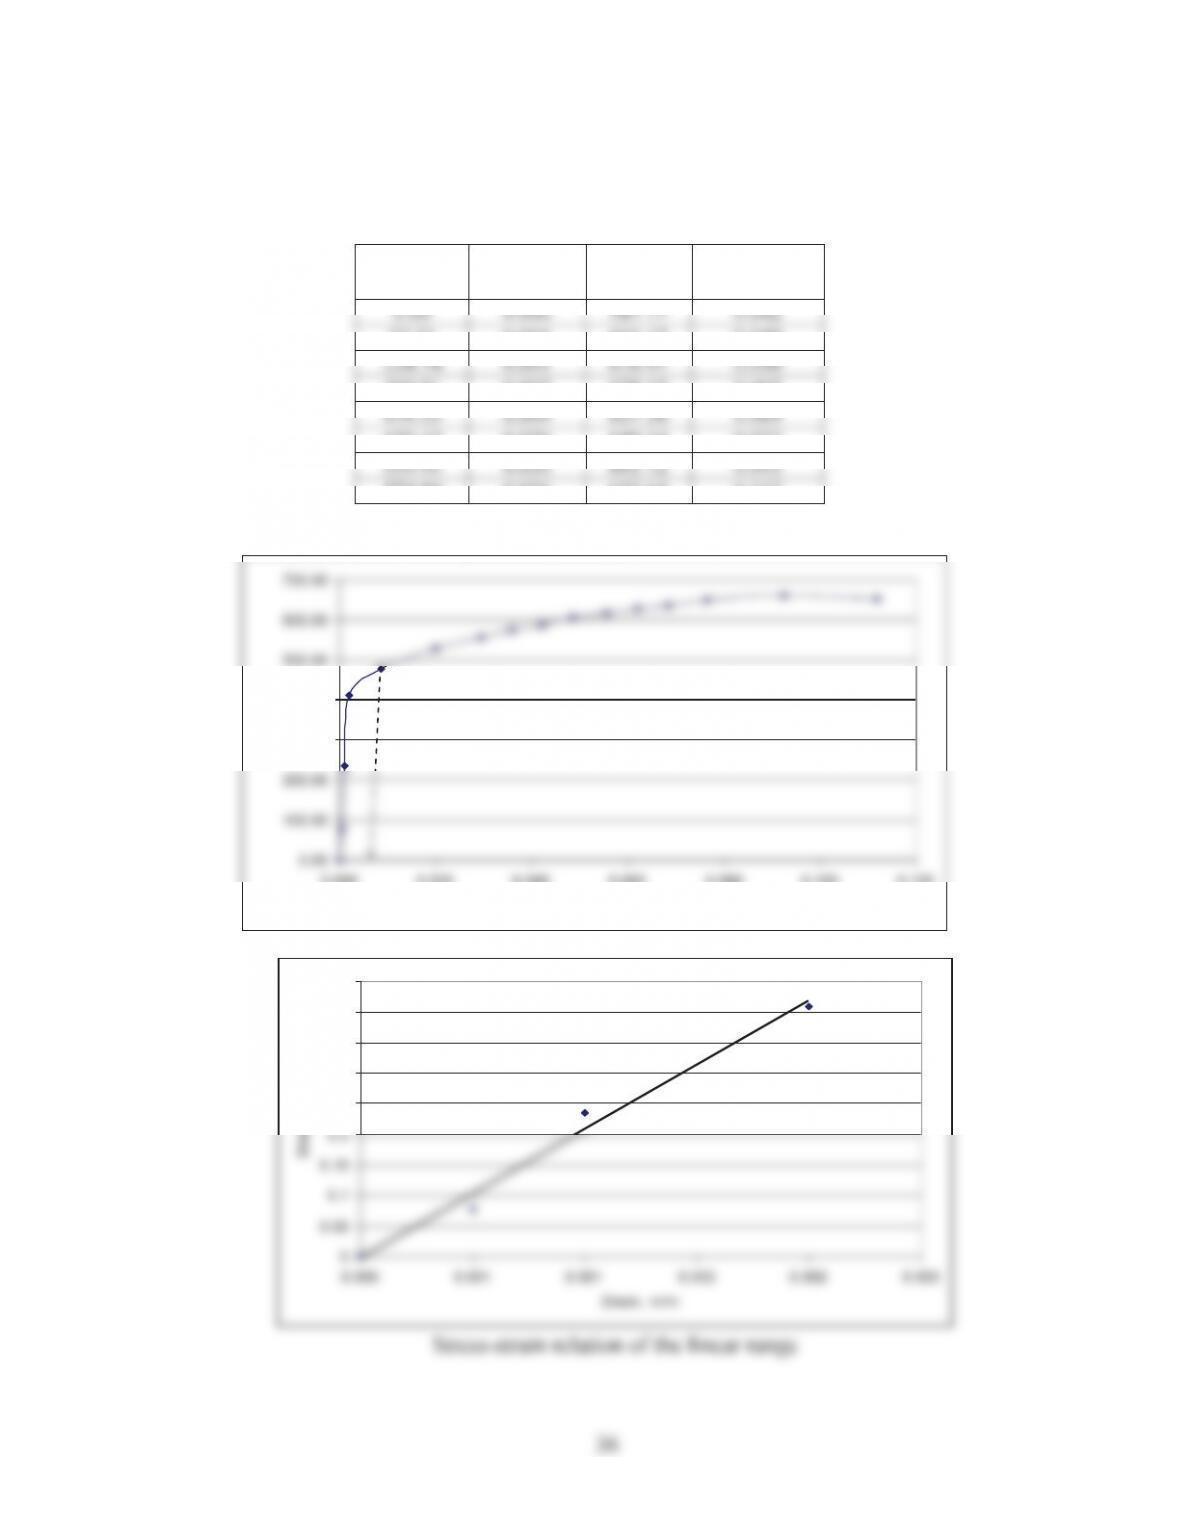
3.35. a.Stress = Load / Area
Strain = Displacement / Gage Length
Stress (MPa)
Strain (m/m)
Stress (MPa)
Strain (m/m)
0
0
679.91
0.0422
78.97
0.0005
687.88
0.0485
359.78
0.0019
694.75
0.0553
629.11
0.0031
700.72
0.0620
629.58
0.0086
704.16
0.0679
636.63
0.0213
707.59
0.0749
643.37
0.0234
710.71
0.0924
656.78
0.0297
655.36
0.1515
669.92
0.0362
The stress-strain relationship is shown below.
Stress-strain relation
33
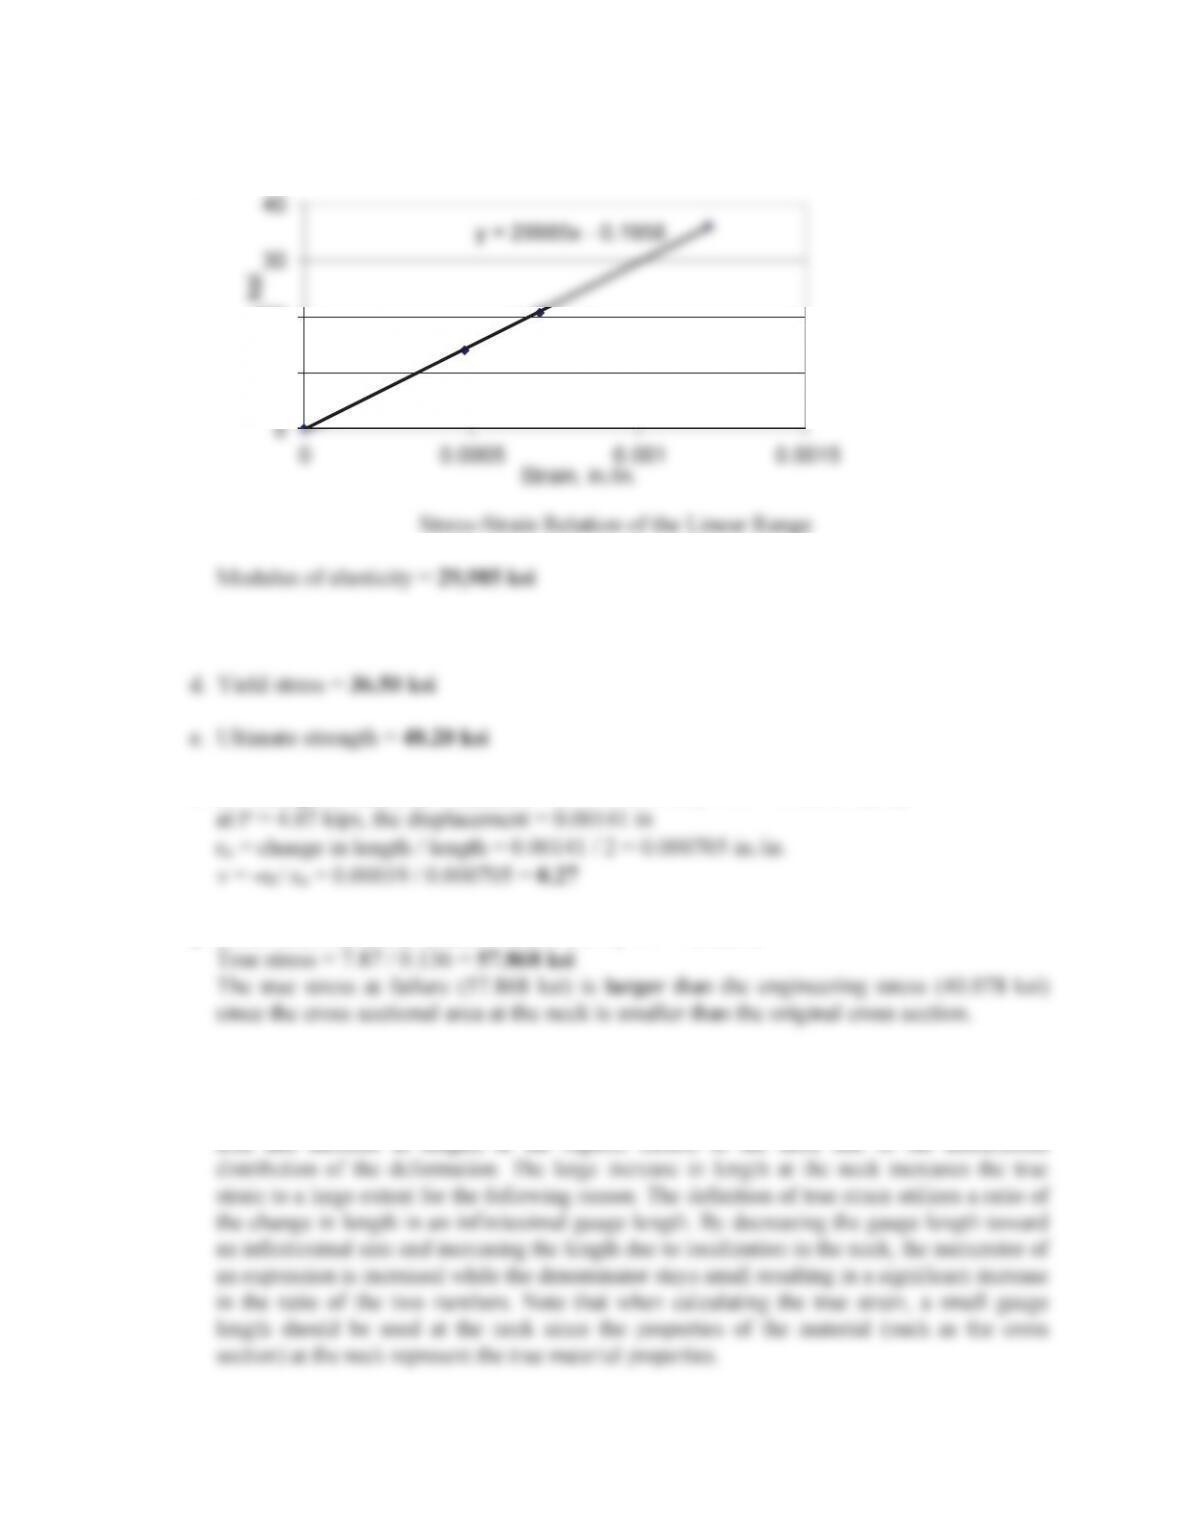
Stress-strain relation of the linear range
f. Stress = Load / Area = 1000 x 155 / (37.5 x 6.25) = 661.33 MPa
3.36 Easiest solution is to “google” the shape 350S125-27. The area is 0.173 in2
34
3.37. a. Stress = Load / Area
Strain = Displacement / Gage Length
Stress (ksi)
Strain
(in/in)
Stress (ksi)
Strain (in/in)
0
0
86.600
0.04150
11.385
0.00045
89.200
0.04778
34.600
0.00117
90.900
0.05439
60.392
0.00203
92.600
0.06103
70.200
0.00846
93.900
0.06740
78.000
0.01990
95.700
0.07540
81.900
0.02923
97.500
0.09099
84.700
0.03558
96.300
0.11040
The stress-strain relationship is shown below.
b. The linear portion of the stress-strain relationship is shown below.
35
Stress-strain relation of the linear range
By drawing a line parallel to the linear portion on the stress–strain diagram at a stress of
71.71 ksi, the permanent strain = 0.008 in./in.
36
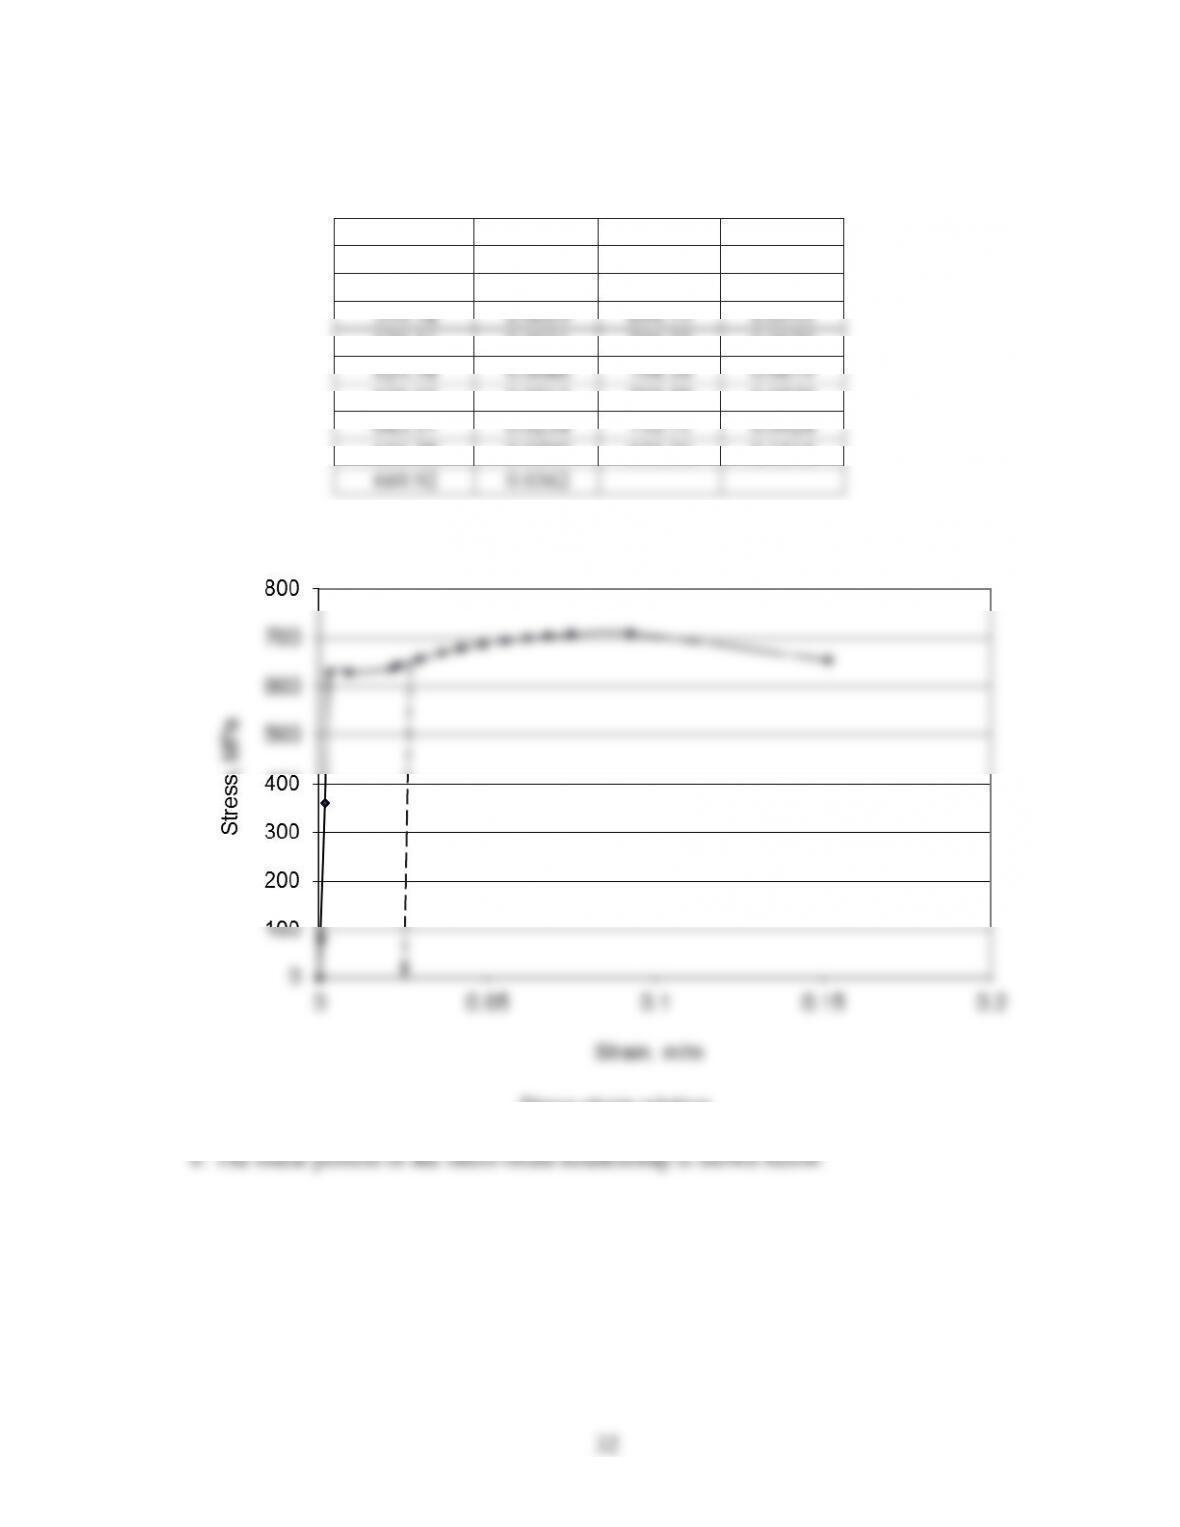
3.38. a. Stress = Load / Area
Strain = Displacement / Gage Length
Stress
(MPa)
Strain
(m/m)
Stress
(MPa)
Strain (m/m)
0.00
0.000
587.77
0.042
77.31
0.001
605.42
0.049
234.78
0.001
616.97
0.056
409.91
0.002
628.53
0.062
476.53
0.009
637.36
0.069
529.47
0.020
649.54
0.077
555.95
0.030
661.72
0.093
574.84
0.036
653.64
0.112
The stress-strain relationship is shown below.
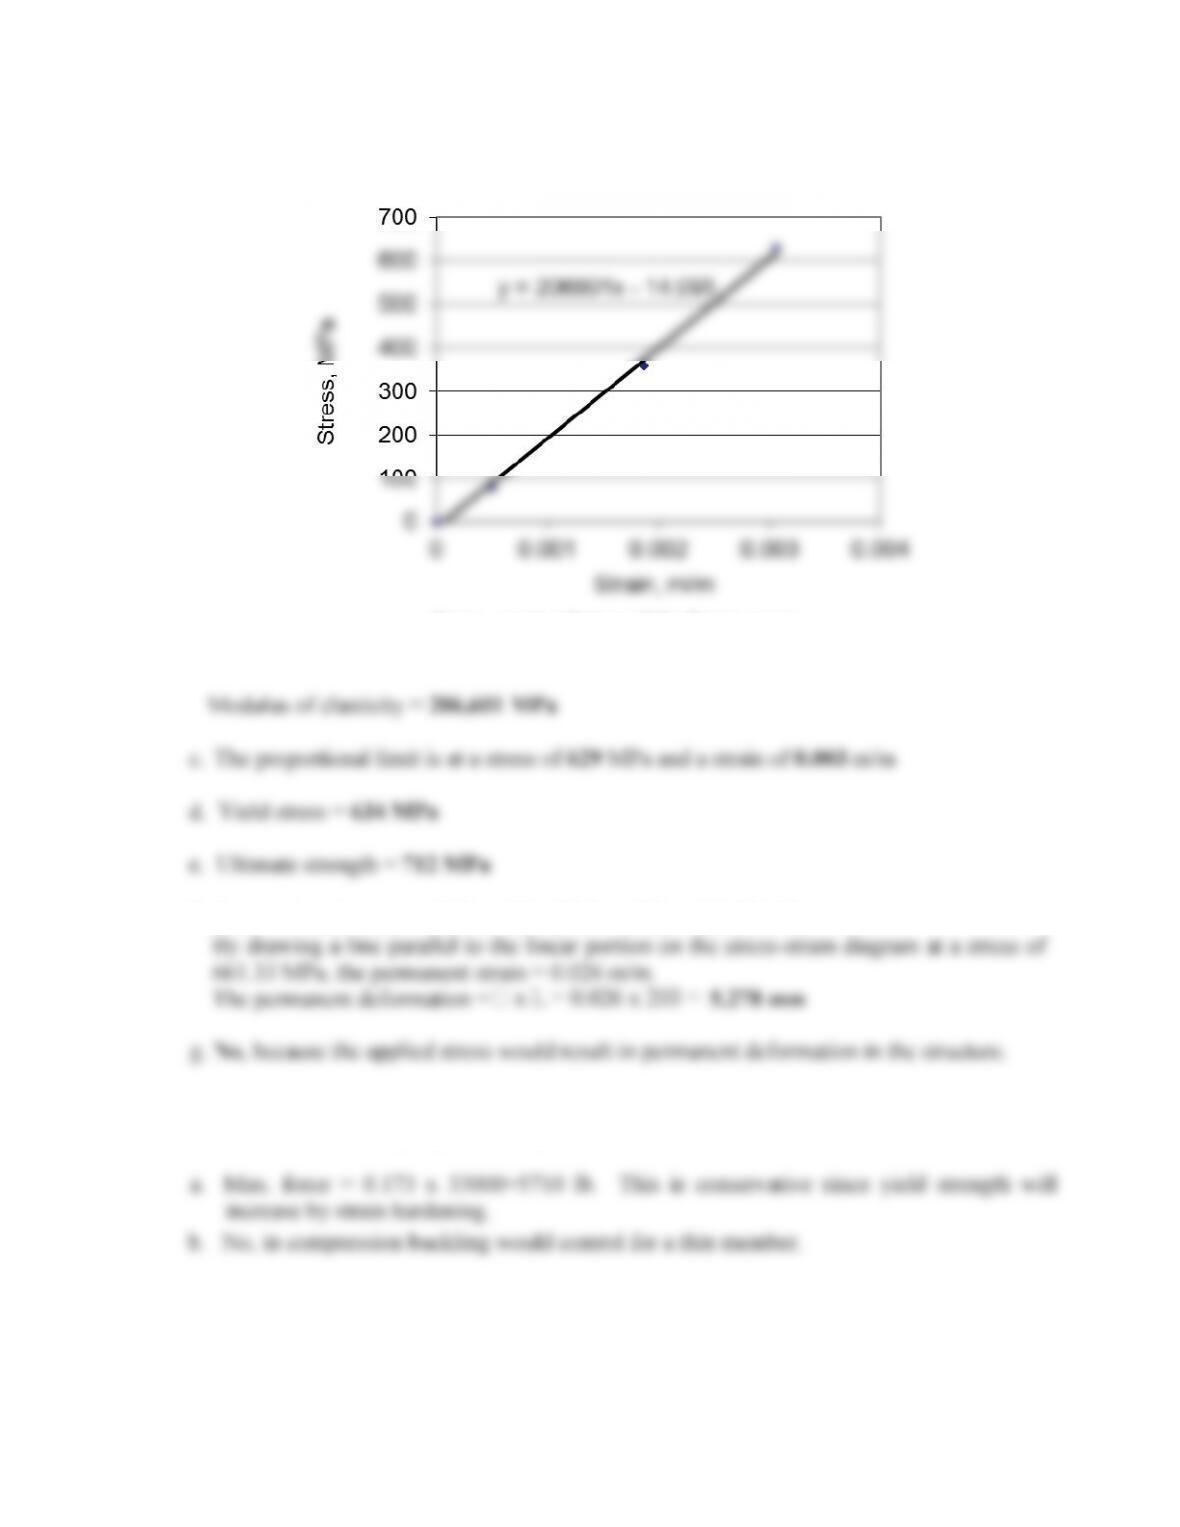
b. The linear portion of the stress-strain relationship is shown below.
\ [
6WUDLQPP
6WUHVV03D
Stress-strain relation of the linear range
Strain, m/m
Stress, MPa
37
f. Stress = Load / Area = 390/(S*16^2) = 485 MPa
By drawing a line parallel to the linear portion on the stress–strain diagram at a stress of
3.39. a.A = S(62– 52) / 4 = 8.6429 in2
b. Hlateral =-Q.Haxial = 0.27 x 0.000193 = 0.00005211 in./in.
c. Hlateral = (dinner, final – dinner, inital) / dinner, inital
3.40. a.A = S(0.202– 0.182) / 4 = 0.005969 m2
38
c. Hlateral = (dinner, final – dinner, inital) / dinner, inital
3.41. d = 10 mm
3.42. d = ½ in.
G = 11.6 x 10⁶psi
3.43. a. Using S.I Units
b. Using U.S. Customary Units
39
3.44. V= P/A,
H=
‘
L/ L
Observation No.
‘
L(in.)
P(lb)
H
(in./in.)
V
(psi)
u
i
(psi)
0
0
0
0
0
N/A
0.0005
0.0005
5680
0.000125
22720
1.42
0.001
0.001
11400
0.00025
45600
4.27
0.0015
0.0015
17080
0.000375
68320
7.12
0.002
0.002
22760
0.0005
91040
9.96
0.0025
0.0025
28440
0.000625
113760
12.8
0.003
0.003
30000
0.00075
120000
14.61
0.0035
0.0035
30000
0.000875
120000
15
0.004
0.004
30240
0.001
120960
15.06
0.0045
0.0045
33000
0.001125
132000
15.81
0.005
0.005
33200
0.00125
132800
16.55
0.01
0.01
33800
0.0025
135200
167.5
0.015
0.015
33960
0.00375
135840
169.4
0.02
0.02
34480
0.005
137920
171.1
0.025
0.025
35280
0.00625
141120
174.4
0.03
0.03
36200
0.0075
144800
178.7
0.035
0.035
36880
0.00875
147520
182.7
0.04
0.04
38160
0.01
152640
187.6
0.045
0.045
38600
0.01125
154400
191.9
0.05
0.05
40240
0.0125
160960
197.1
0.1
0.1
47480
0.025
189920
2193
0.15
0.15
51320
0.0375
205280
2470
0.2
0.2
53440
0.05
213760
2619
0.25
0.25
54680
0.0625
218720
2703
0.3
0.3
55400
0.075
221600
2752
0.35
0.35
55680
0.0875
222720
2777
0.4
0.4
55840
0.1
223360
2788
0.5
0.5
55200
0.125
220800
5552
0.55
0.55
54400
0.1375
217600
2740
0.6
0.6
52600
0.15
210400
2675
0.65
0.65
50040
0.1625
200160
2566
0.7
0.7
46760
0.175
187040
2420
u
t
=
35,988
Material toughness = 35,988 psi
40
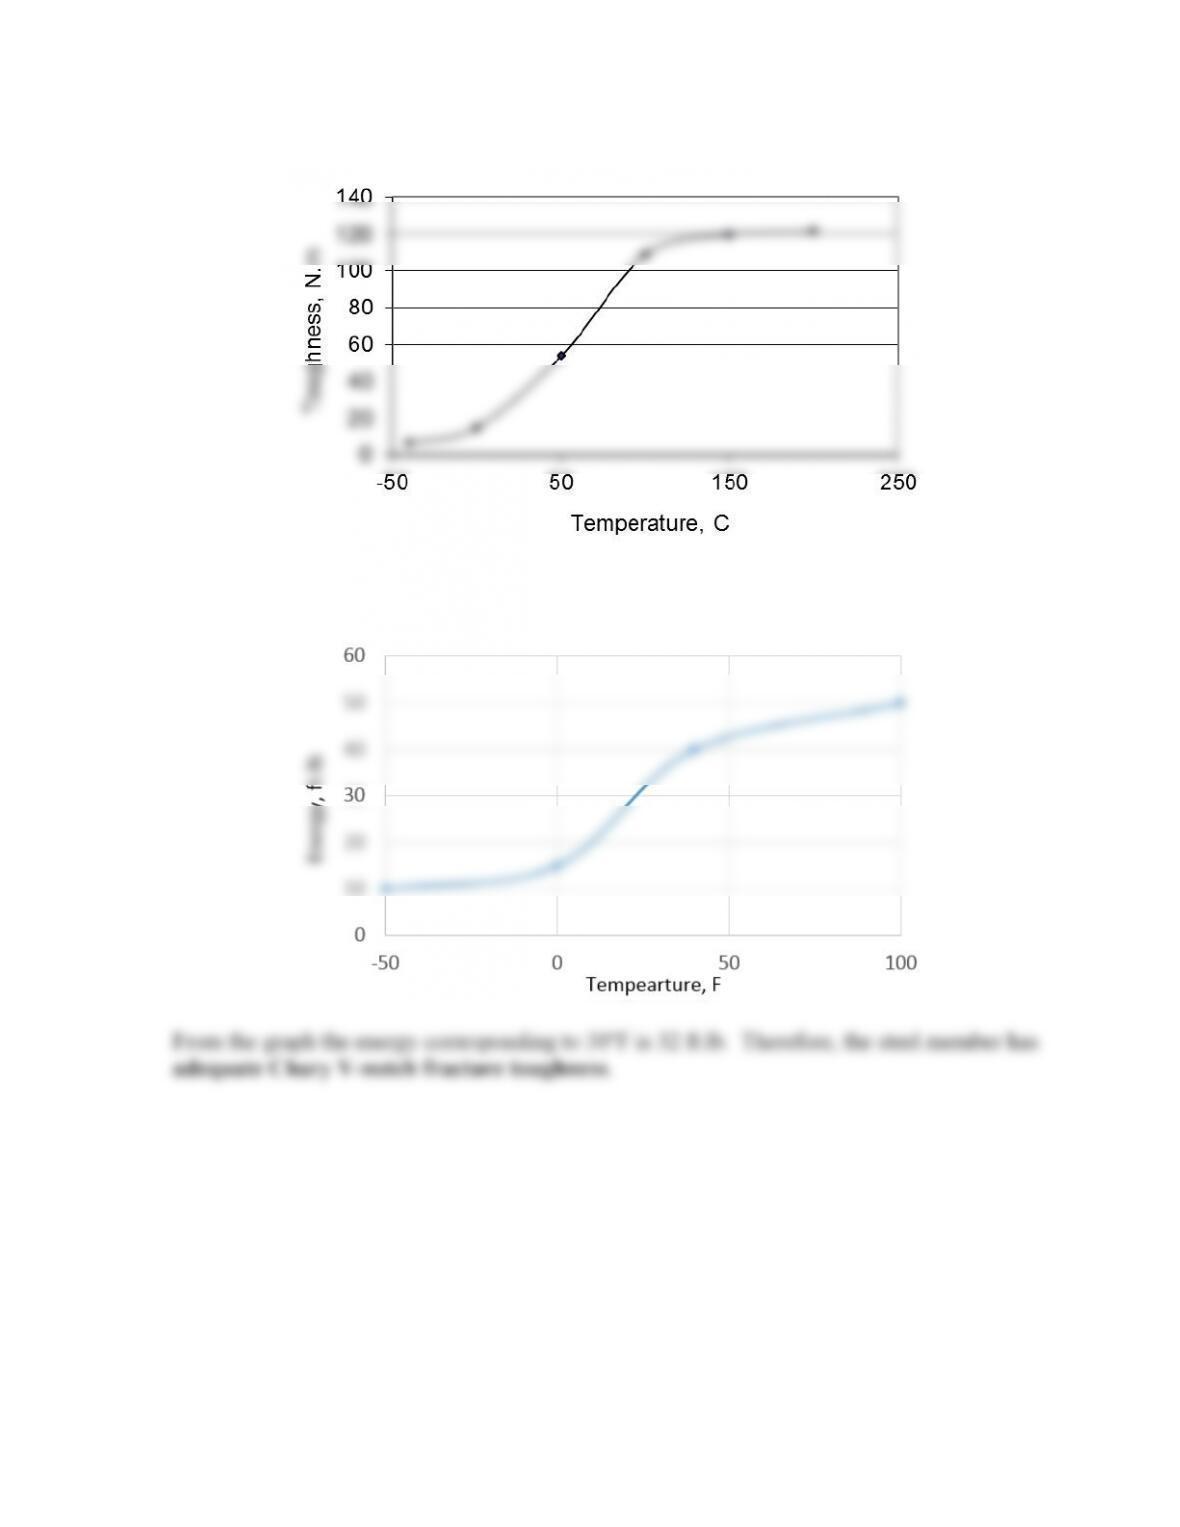
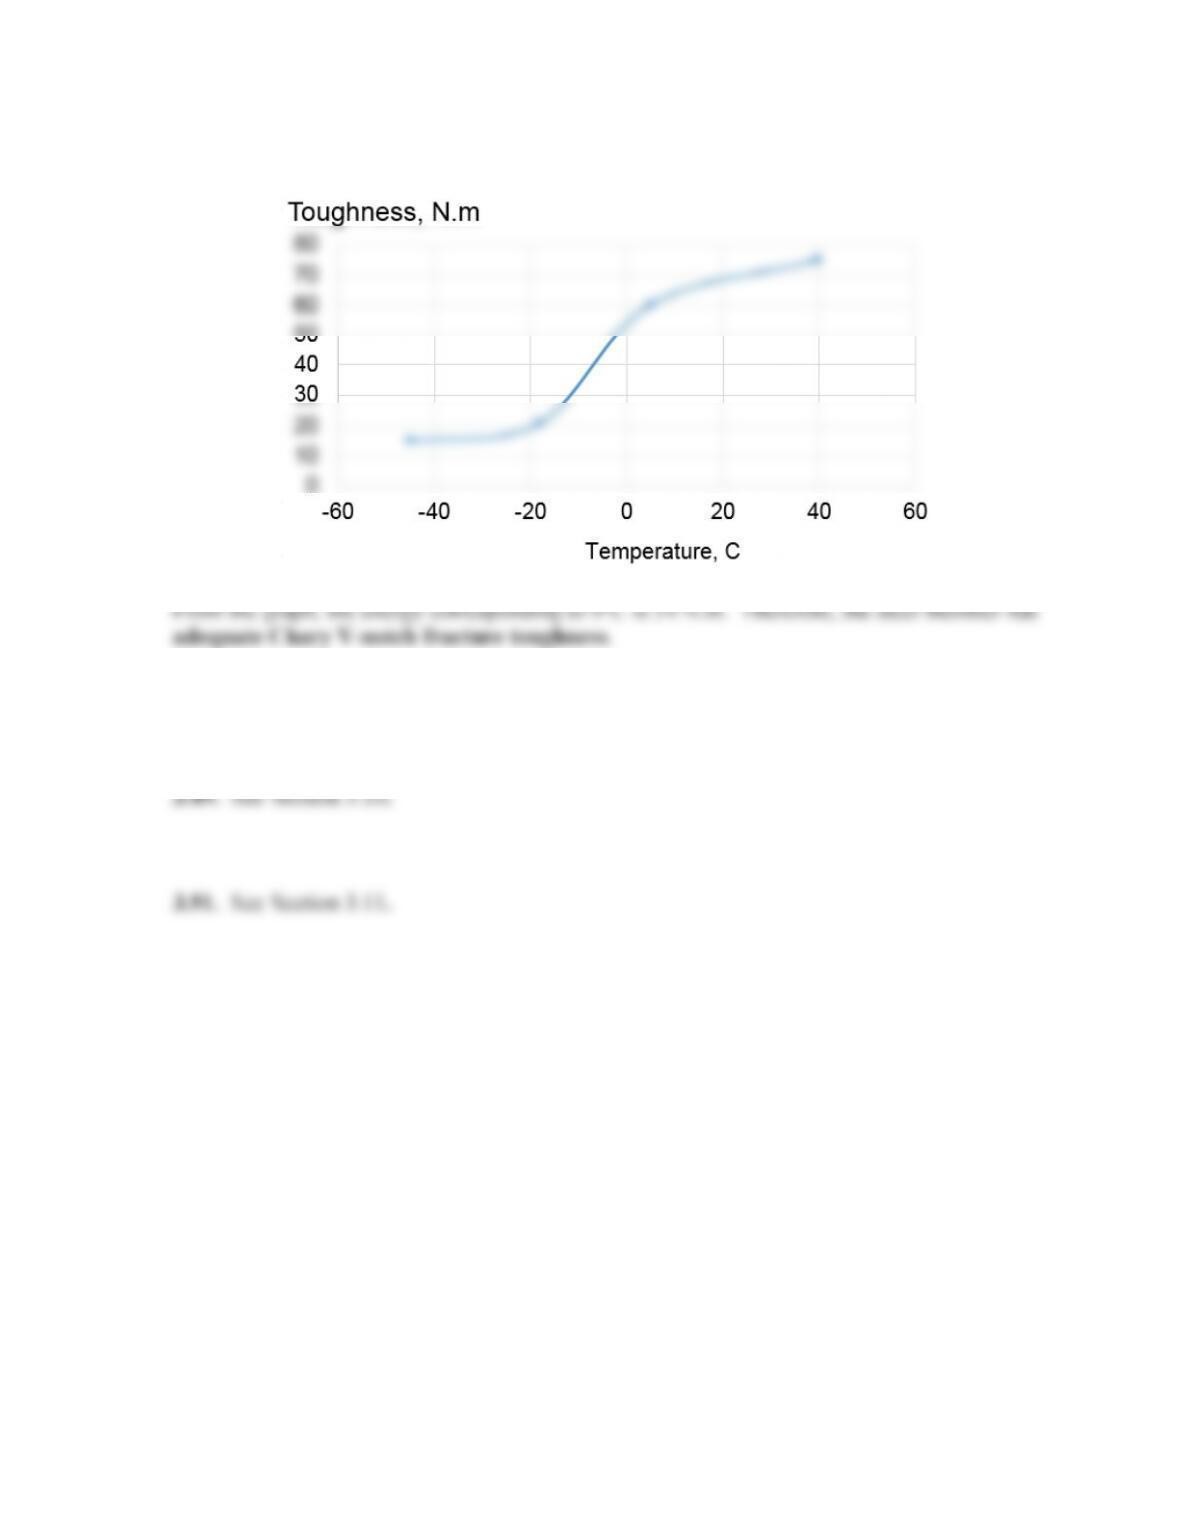
3.45. The toughness versus temperature relation is shown below.
Temperature transition zone between ductile and brittle behavior = 0–120oC
3.46.
41
3.47
3.48. See Section 3.10.
3.50. See Section 3.11.