15-1
CHAPTER 15. RELIABILITY AND RISK ANALYSIS OF
SYSTEMS
CHAPTER 15. RELIABILITY AND RISK ANALYSIS OF SYSTEMS ……….………………………….1
15.1. Reliability of Systems……………………………………………………………………………………..………..1
15.2. and 15.3 Risk Analysis and Risk-Based Decision Analysis …………………………………………..5
The following table provides a summary of the problems with their appropriate sections:
Section Problems
15.1 None
15.1. Reliability of Systems
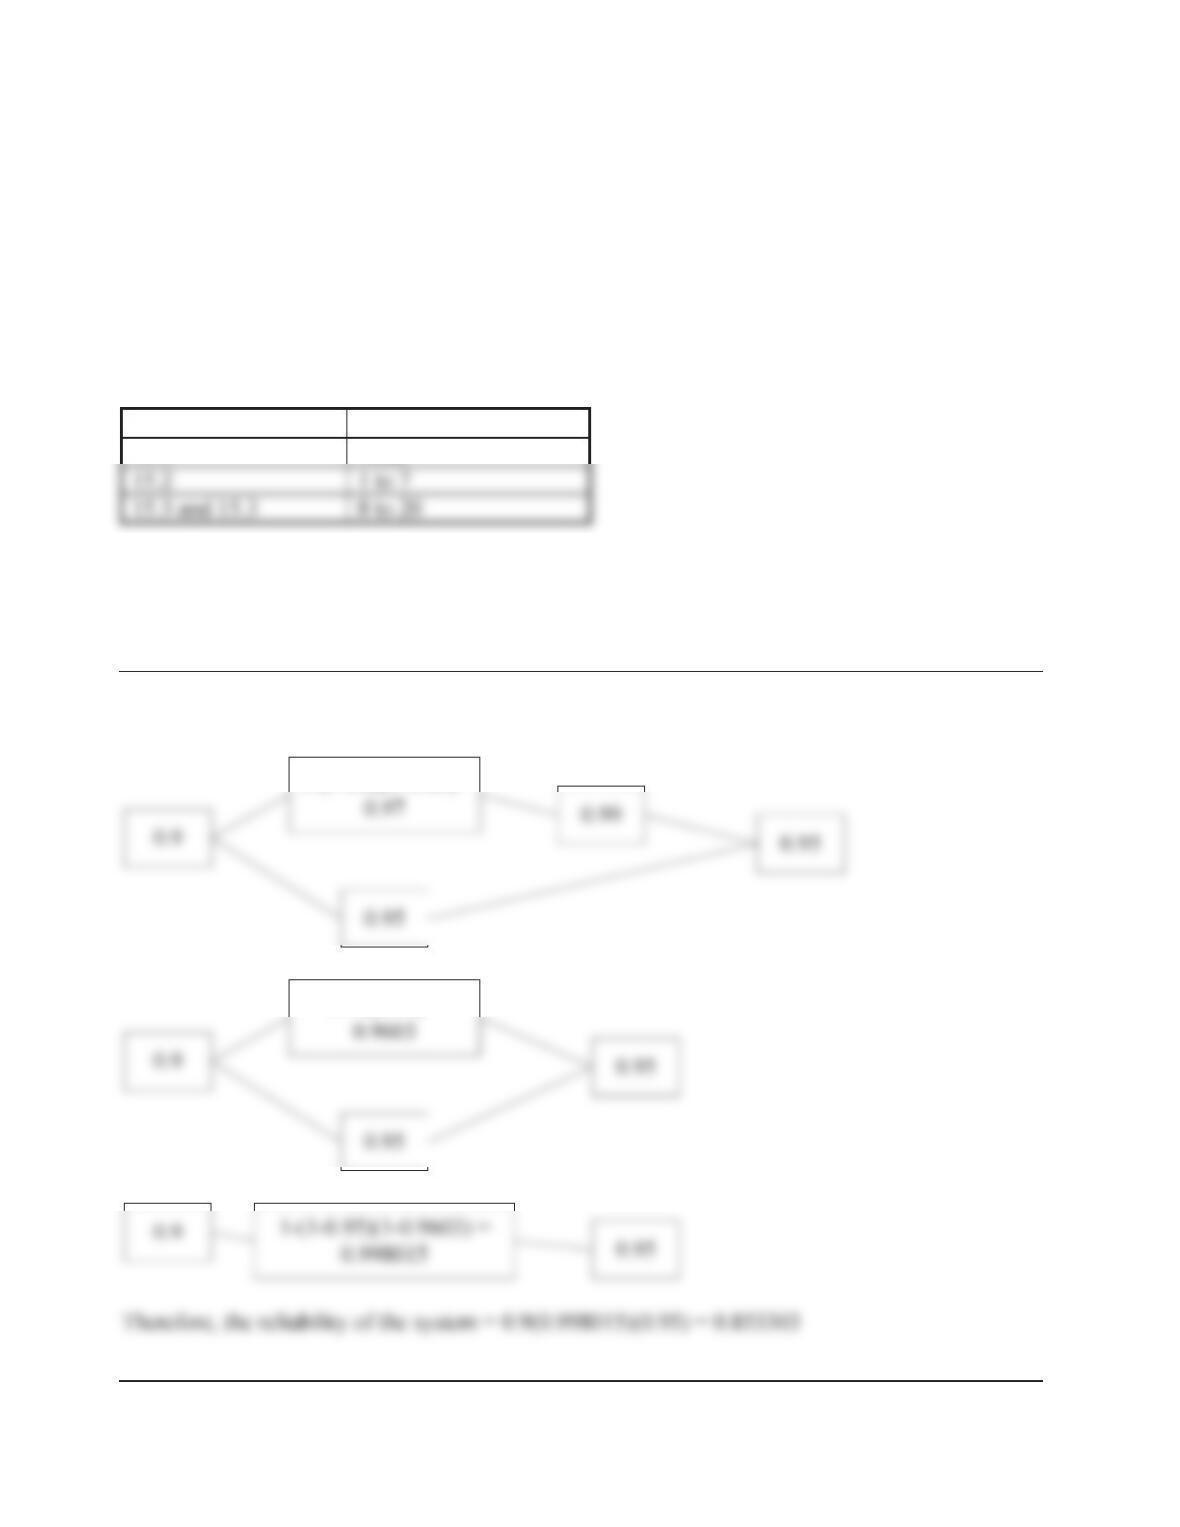
Problem 15-1.
The reliability of the system can be computed in steps as follows:
Step 1
1-(1-0.8)(1-0.85)=
Step 2
0.97(0.99) =
Step 3
Problem 15-2.
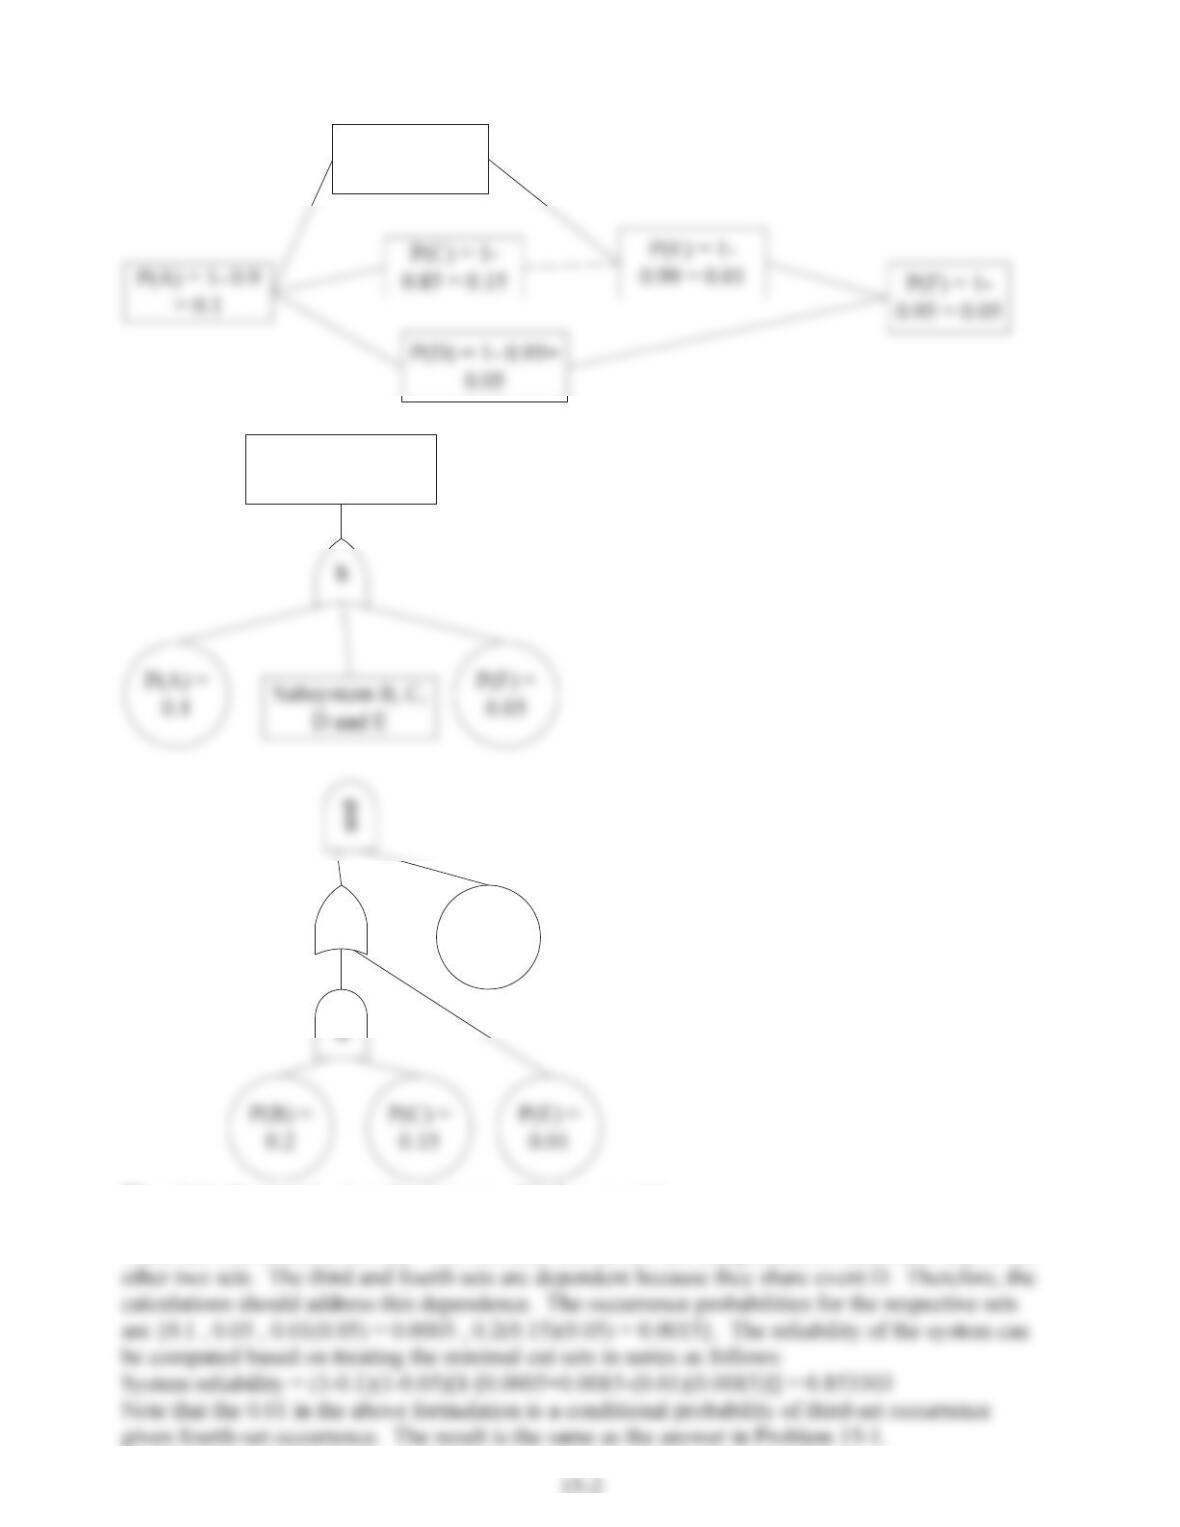
The following basic (failure) events can be defined:
P(B) = 1- 0.8 =
0.2
The following fault tree model can then be developed:
Top Event:
System Failure
P(D) =
0.05
or
The minimal cut set is given by (in terms of failure events)
{(A), (F), (D,E), (B,C,D)}
There are four minimal cut sets. The first and second sets are independent of each other and of the
15-3
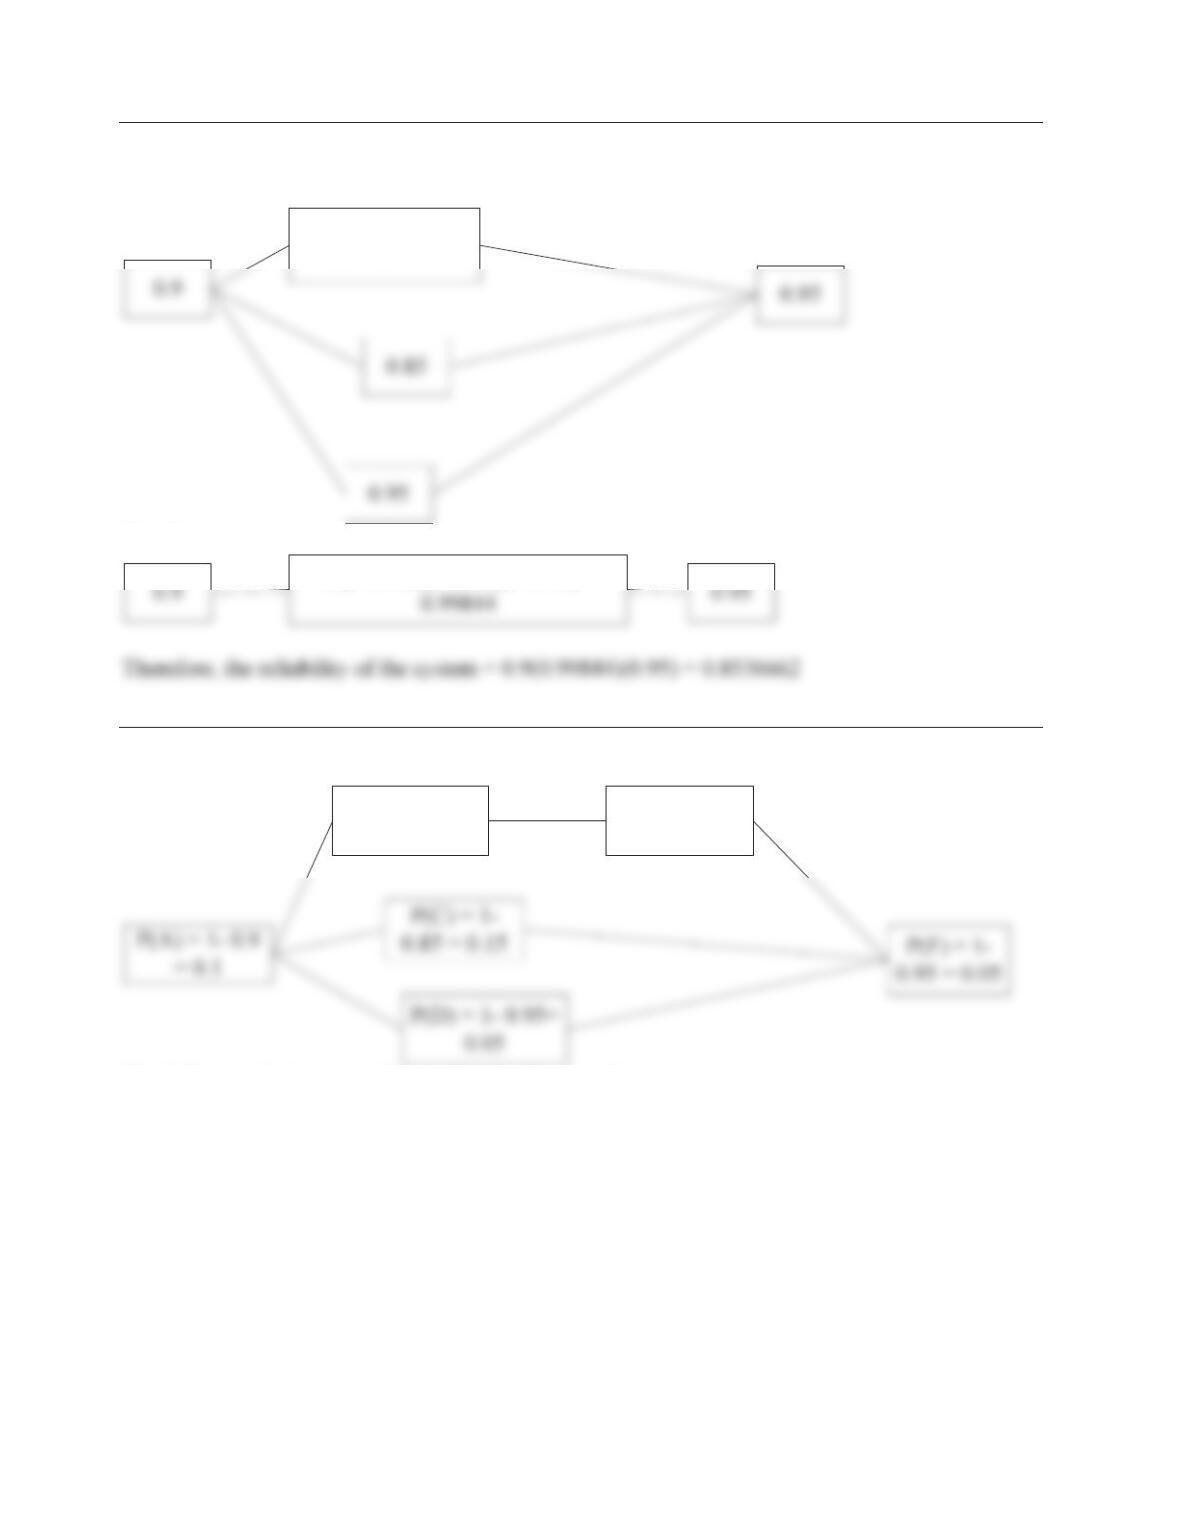
Problem 15-3.
The reliability of the system can be computed in steps as follows:
Step 1
0.8(0.99) = 0.792
Step 2
1-(1-0.792)(1-0.85)(1-0.95) =
Problem 15-4.
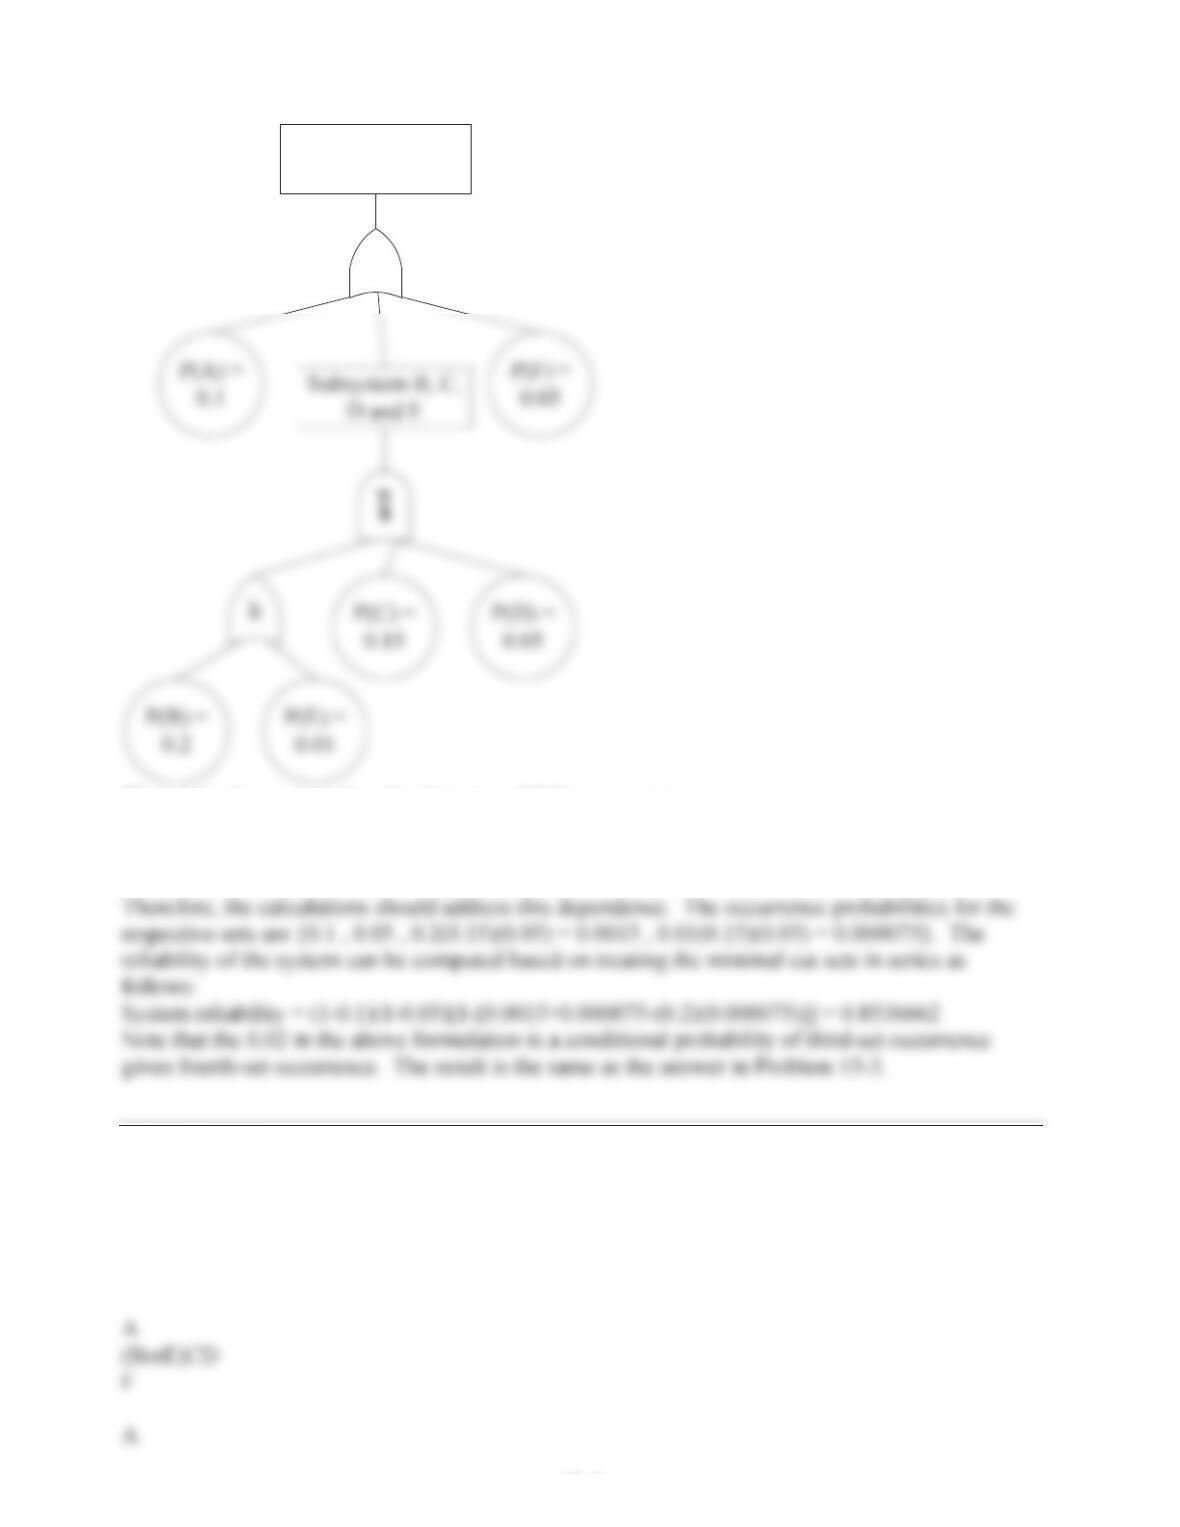
The following basic (failure) events can be defined:
P(E) = 1-
0.99 = 0.01
P(B) = 1- 0.8 =
0.2
The following fault tree model can then be developed:
15-4
Top Event:
System Failure
or
The minimal cut set is given by (in terms of failure events)
{(A), (F), (B,C,D), (E,C,D)}
There are four minimal cut sets. The first and second sets are independent of each other and of the
other two sets. The third and fourth sets are dependent because they share events C and D.
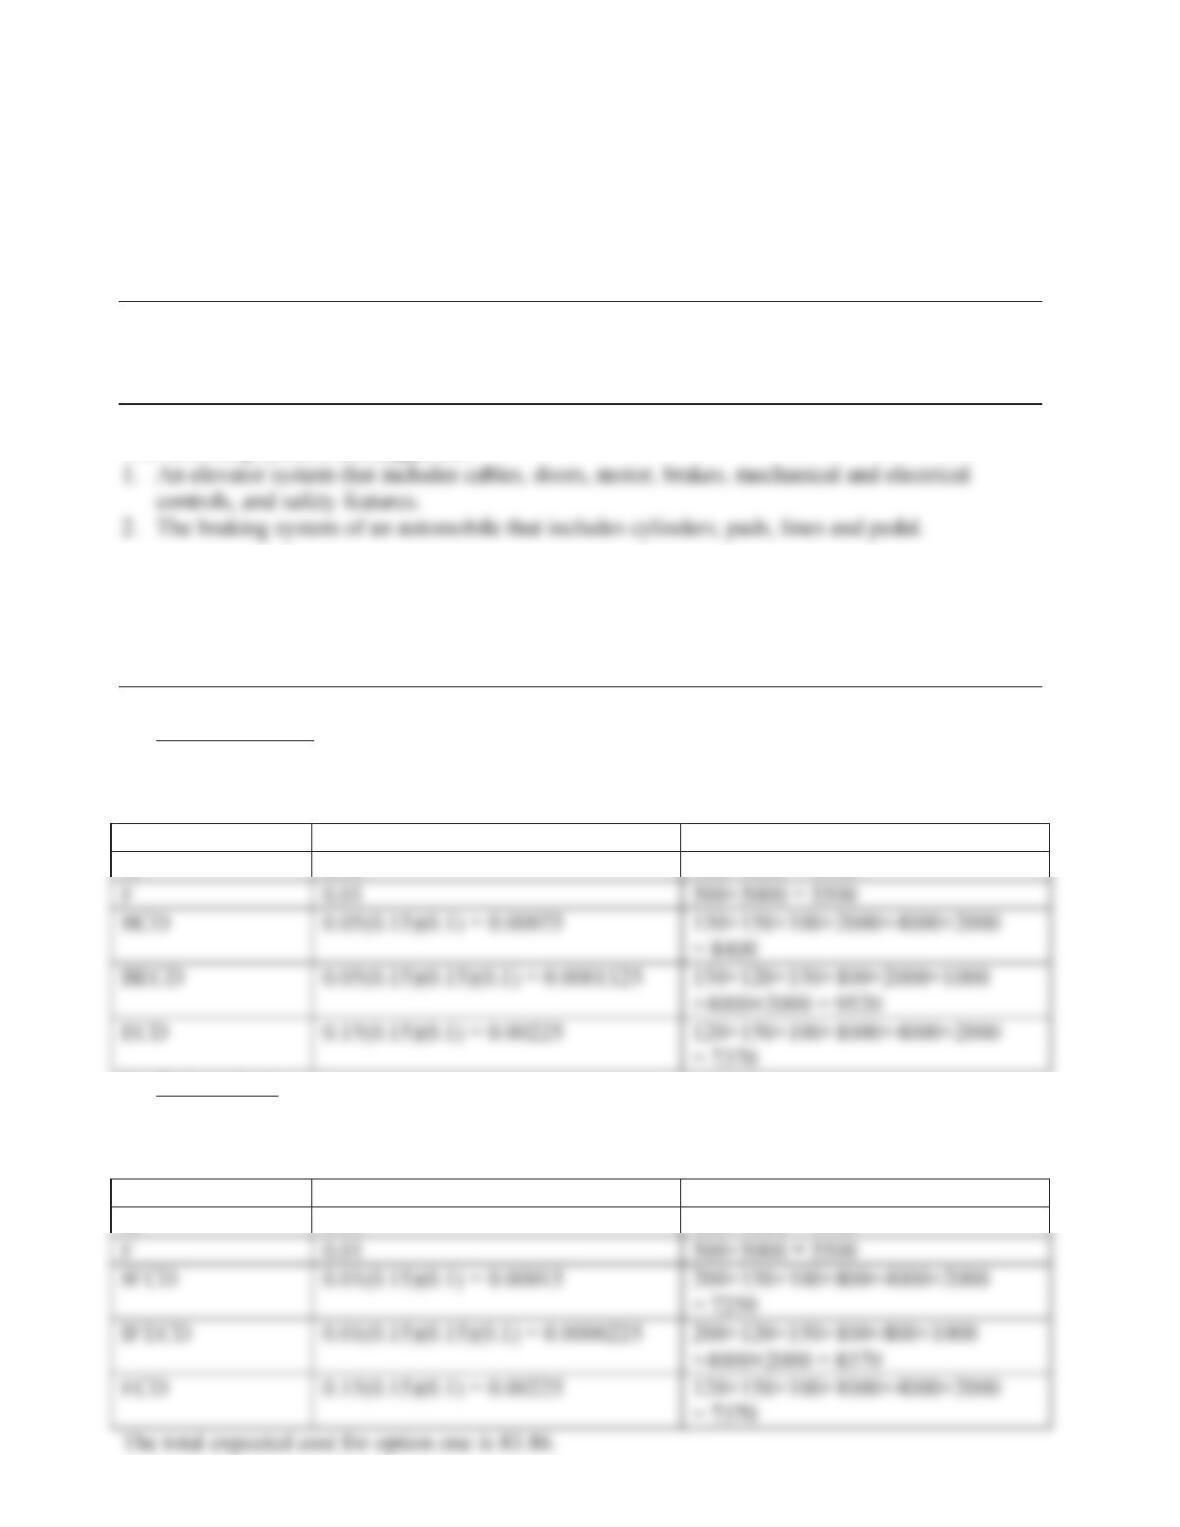
Problem 15-5.
Top Event
A
Subsystem
F
15-5
BCD
ECD
F
The computations from here on are similar to problem 15-4.
Problem 15-6.
The solution for this problem is not provided.
Problem 15-7.
The following systems are suggested:
15.2. and 15.3 Risk Analysis and Risk-Based Decision Analysis
Problem 15-8.
a) Event tree model
Define the events A, B, C, D, E, and F as the failure events of the corresponding components.
System failure is defined as the failure in connectivity between A and F. The following failure
scenarios result in the failure of the intact system:
Event Intersection Occurrence Probability Failure Cost
A 0.01 100+1000 = 1100
b) Risk analysis
The above case produces a total expected cost of the sum of the product of occurrence probability
time failure cost of 89.95.
For the first option, the above table can be revised as follows:
Event Intersection Occurrence Probability Failure Cost
A 0.01 100+1000 = 1100
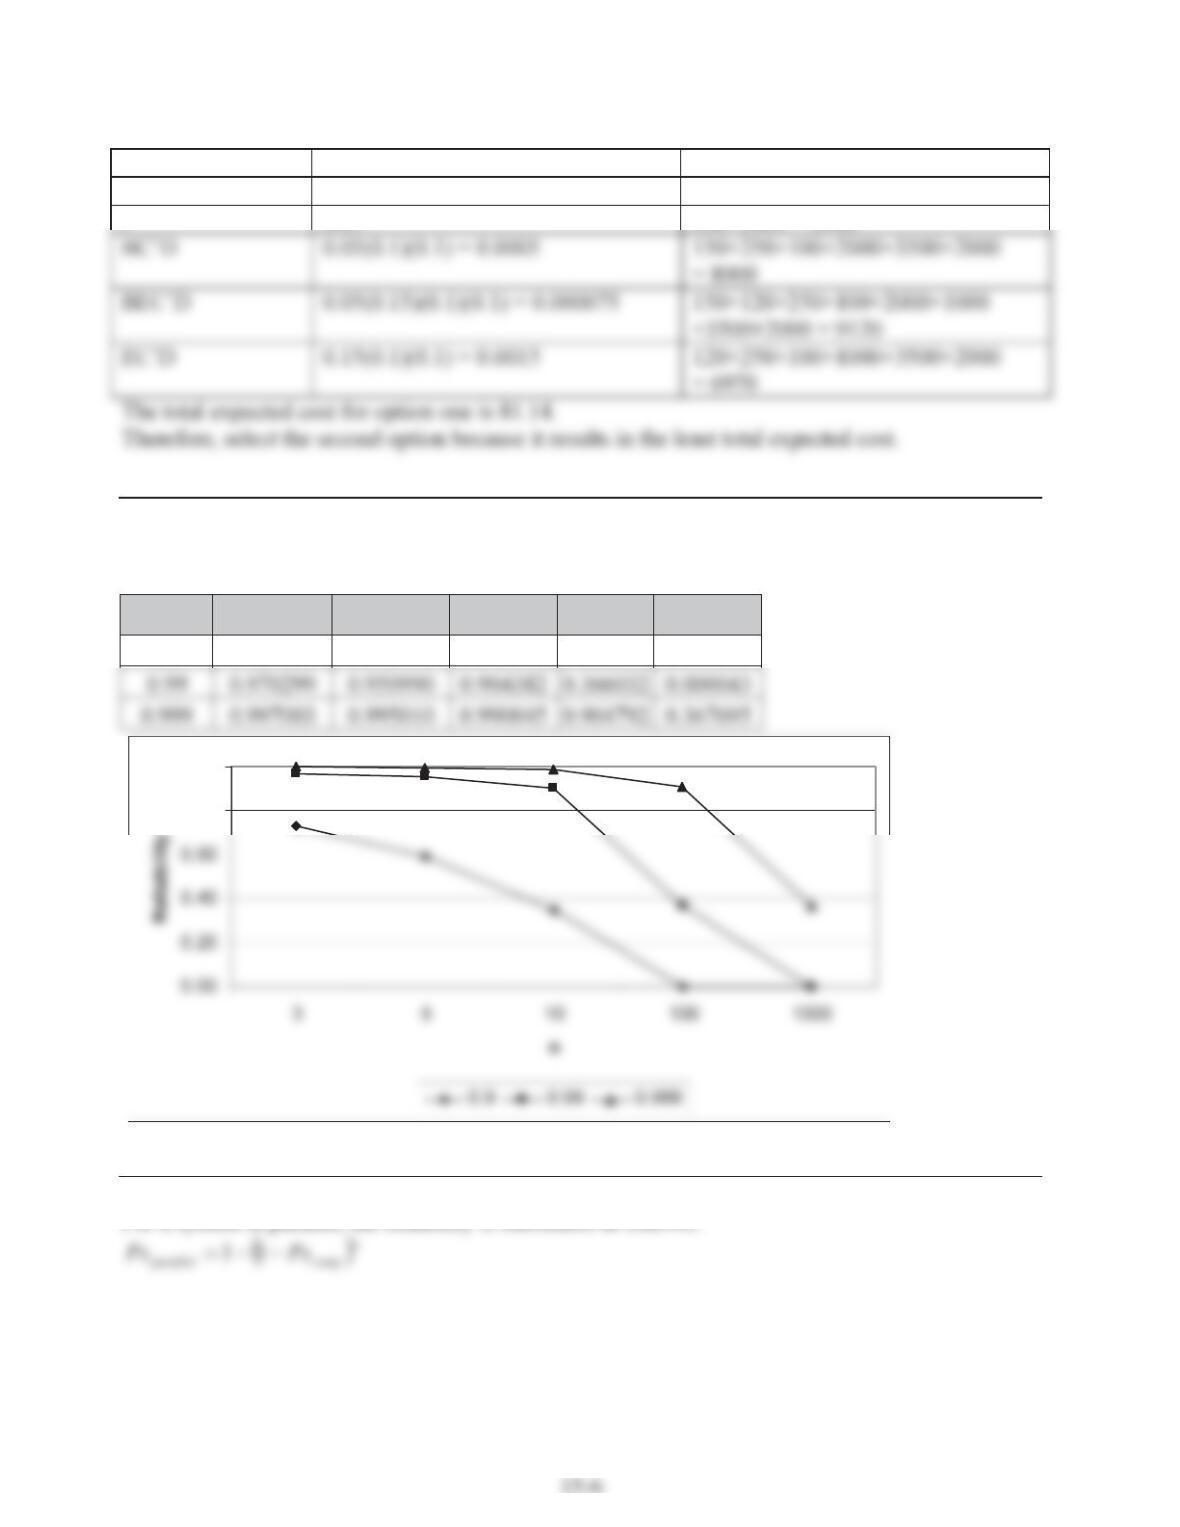
For the second option, the above table can be revised as follows:
Event Intersection Occurrence Probability Failure Cost
A 0.01 100+1000 = 1100
F 0.01 500+5000 = 5500
Problem 15-9.
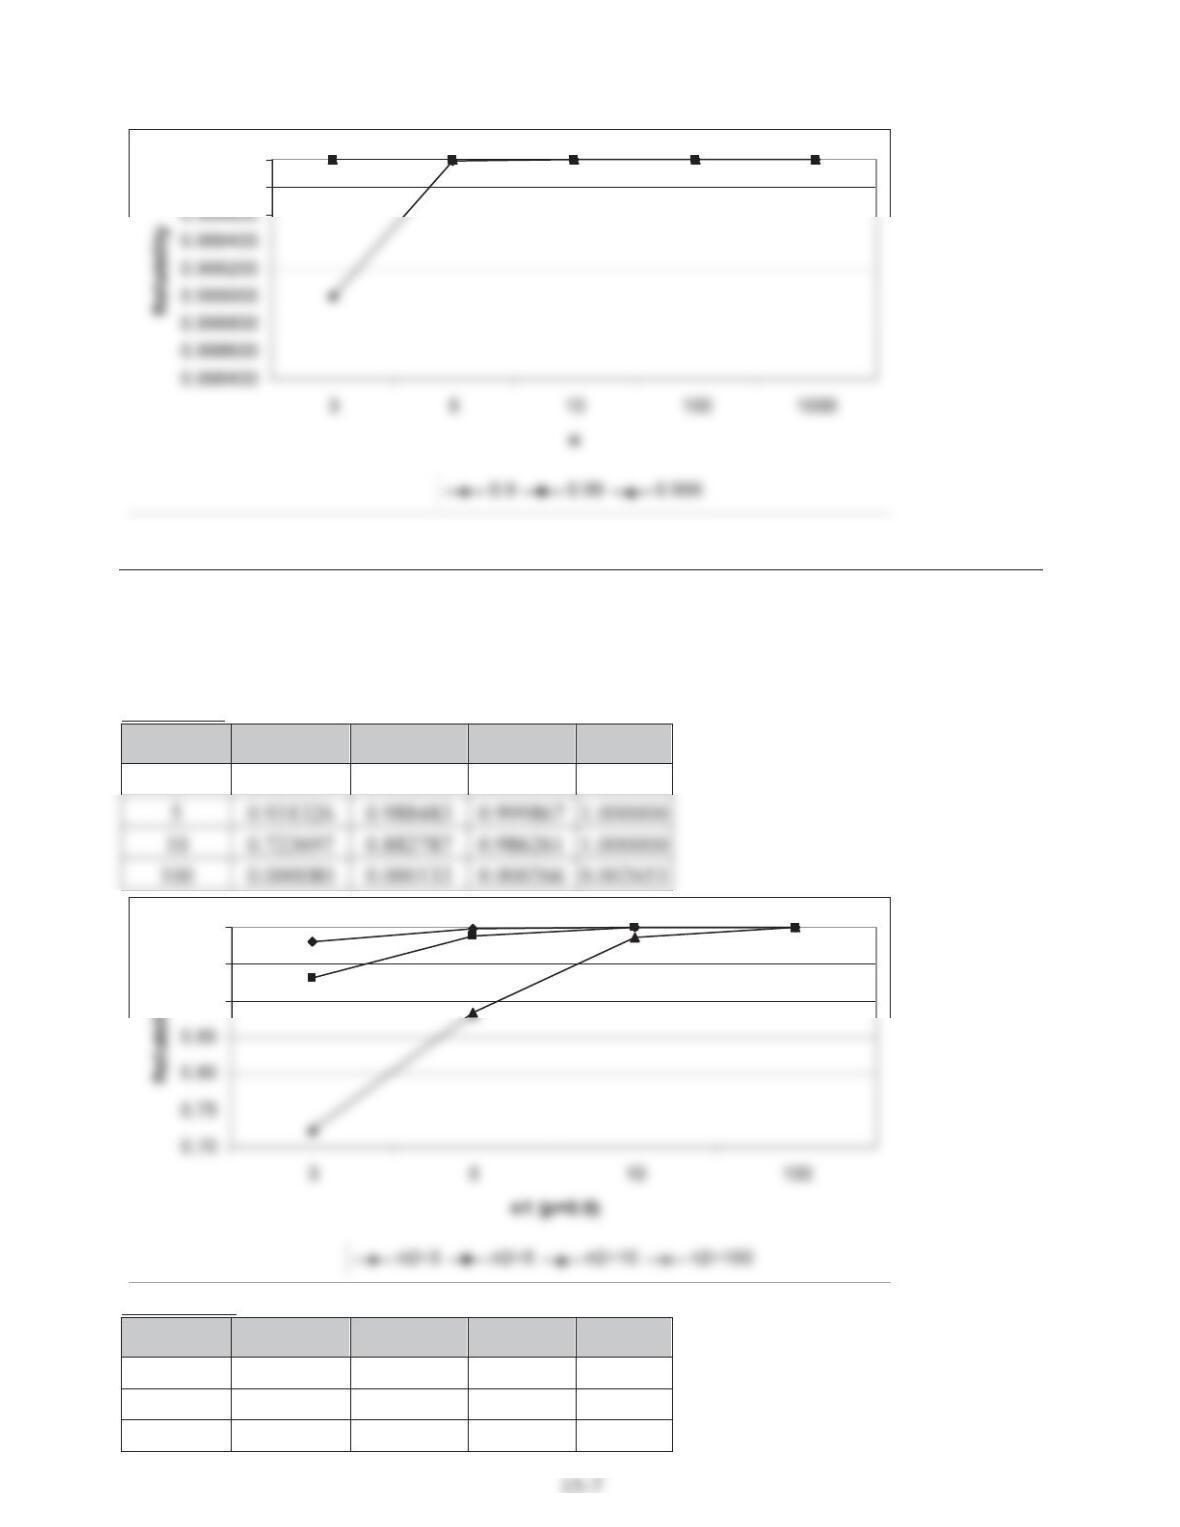
For a system in series, the reliability is calculated as follows:
n
compseries PsPs
p
R n3 5 10 100 1000
0.9 0.729000 0.590490 0.348678 0.000027 0.000000
Problem 15-10.
For a system in parallel, the reliability is calculated as follows:
0.80
1.00
Problem 15-11.
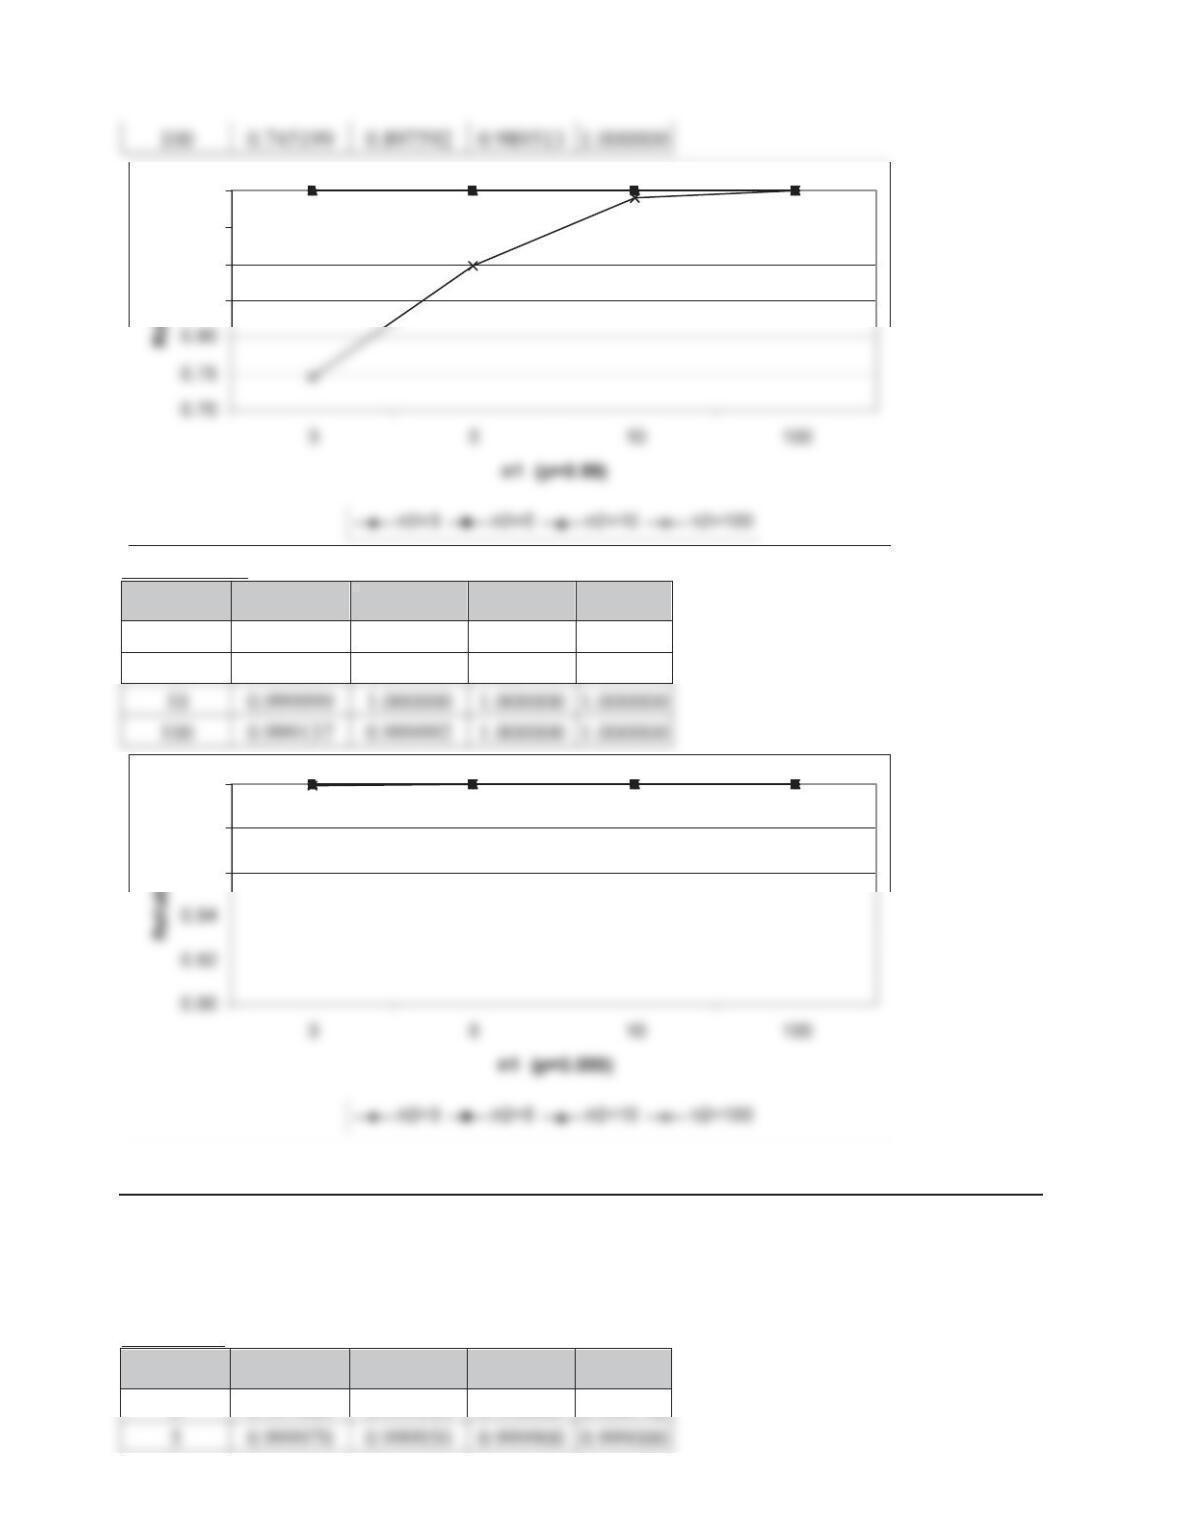
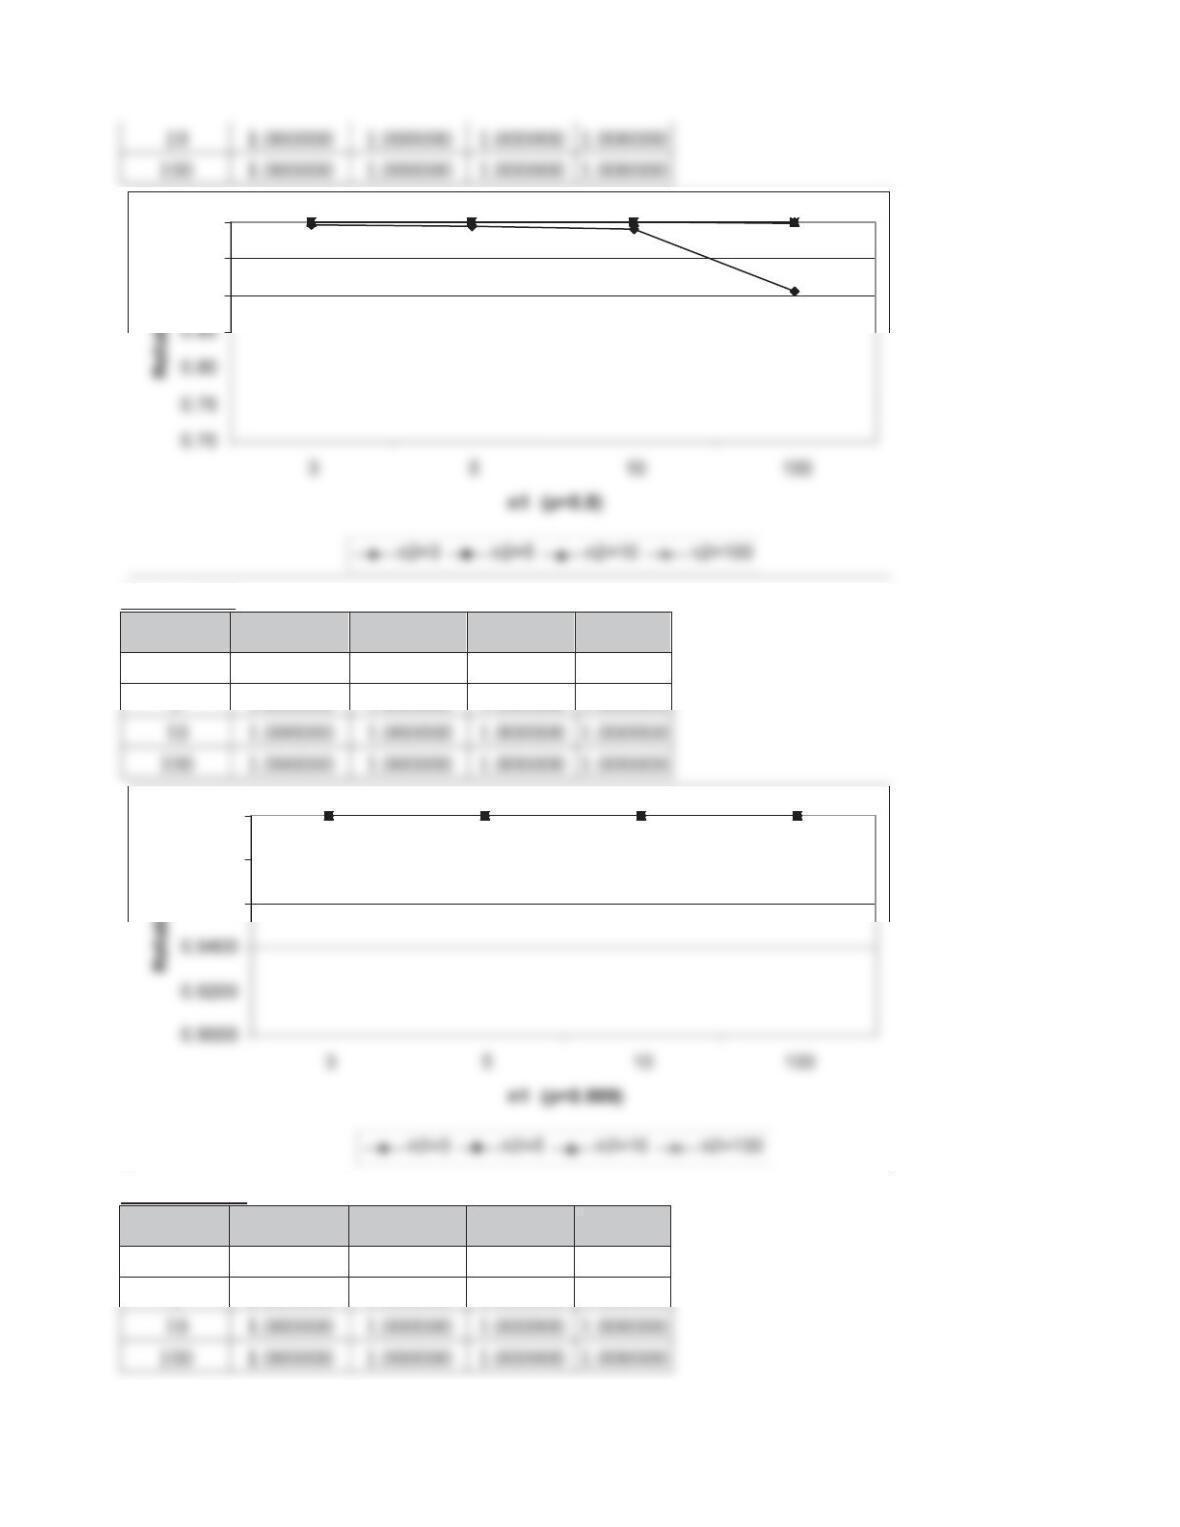
For n1 sets in parallel of n2 sets identical components in series, the reliability is calculated as
follows:
>@
1
2
11 n
n
comp
PsPs
For p = 0.9
n2 R n1 3 5 10 100
3 0.980097 0.998538 0.999998 1.000000
For p = 0.99
n2 R n1 3 5 10 100
3 0.999974 1.000000 1.000000 1.000000
5 0.999882 1.000000 1.000000 1.000000
10 0.999126 0.999992 1.000000 1.000000
0.999800
1.000000
0.90
0.95
1.00
15-8
For p = 0.999
n2 R n1 3 5 10 100
3 1.000000 1.000000 1.000000 1.000000
5 1.000000 1.000000 1.000000 1.000000
Problem 15-12.
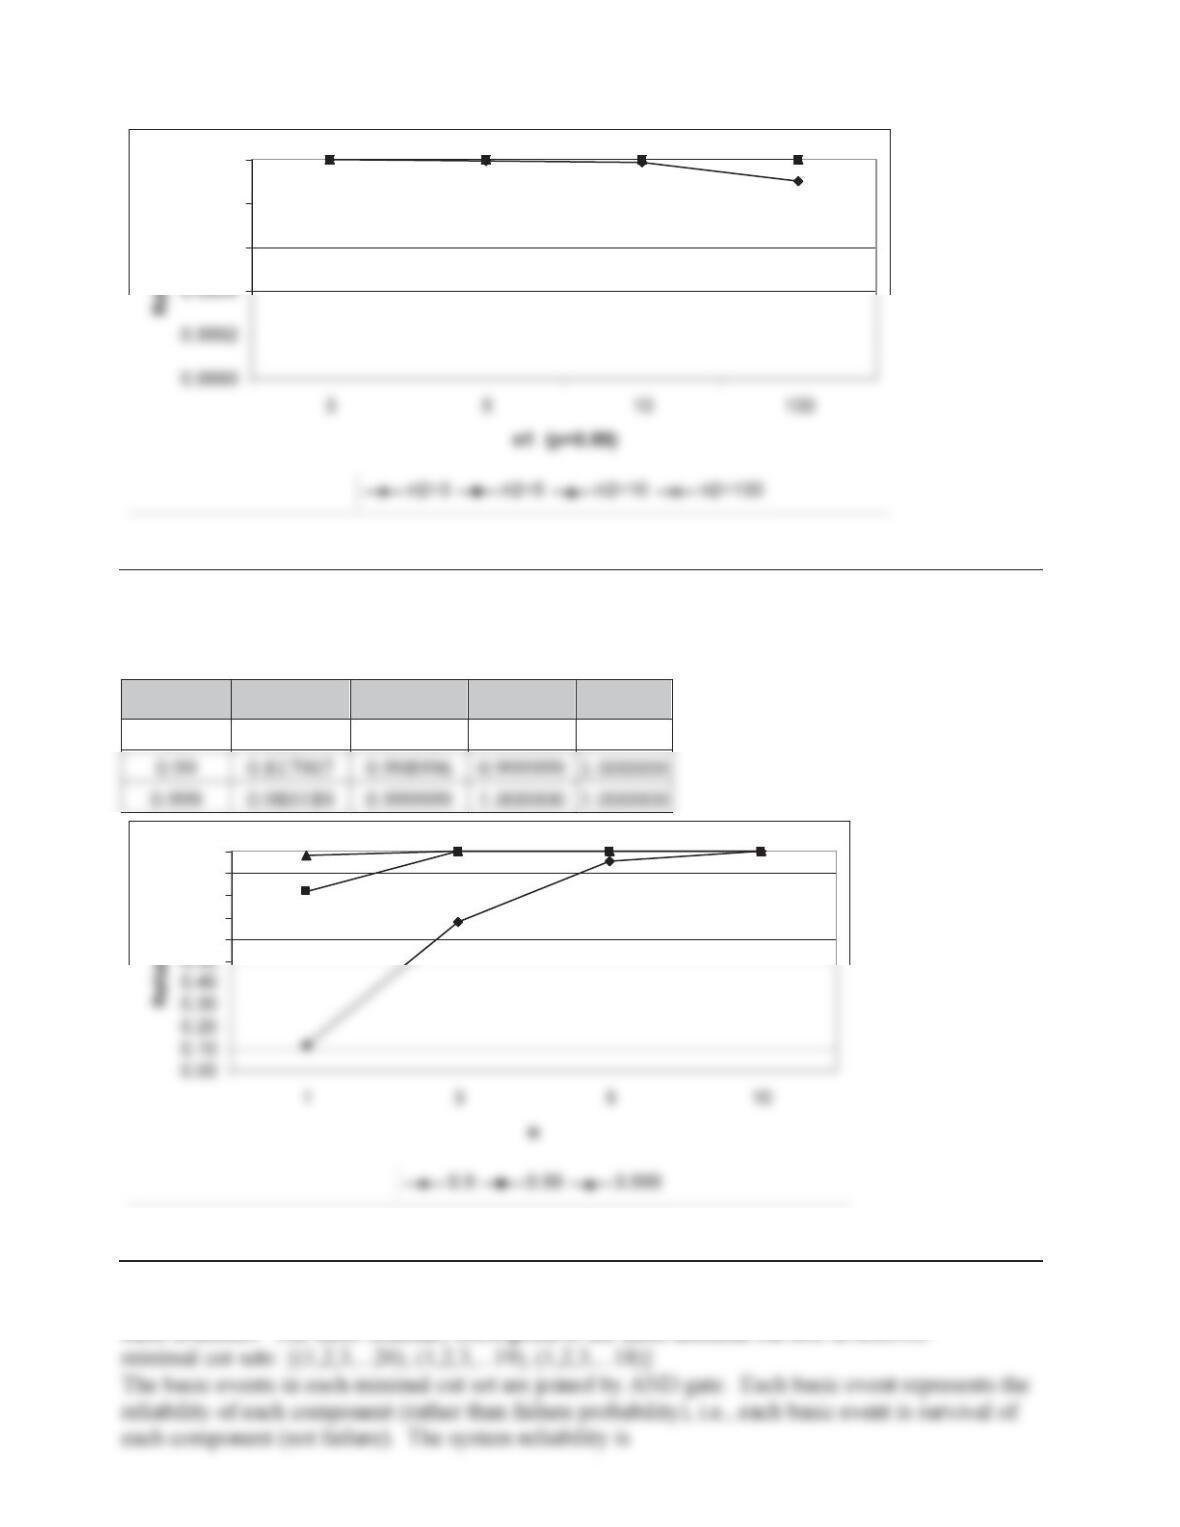
For n1 sets in series of n2 sets identical components in parallel, the reliability is calculated as
follows:
>@
1
2
11 n
n
comp
PsPs
For p = 0.9
n2 R n1 3 5 10 100
3 0.997003 0.995010 0.990045 0.904792
0.85
0.90
0.95
1.00
0.96
0.98
1.00
15-9
For p = 0.99
n2 R n1 3 5 10 100
3 0.999997 0.999995 0.999990 0.999900
For p = 0.999
n2 R n1 3 5 10 100
3 1.000000 1.000000 1.000000 1.000000
5 1.000000 1.000000 1.000000 1.000000
0.90
0.95
1.00
0.9600
0.9800
1.0000
15-10
Problem 15-13.
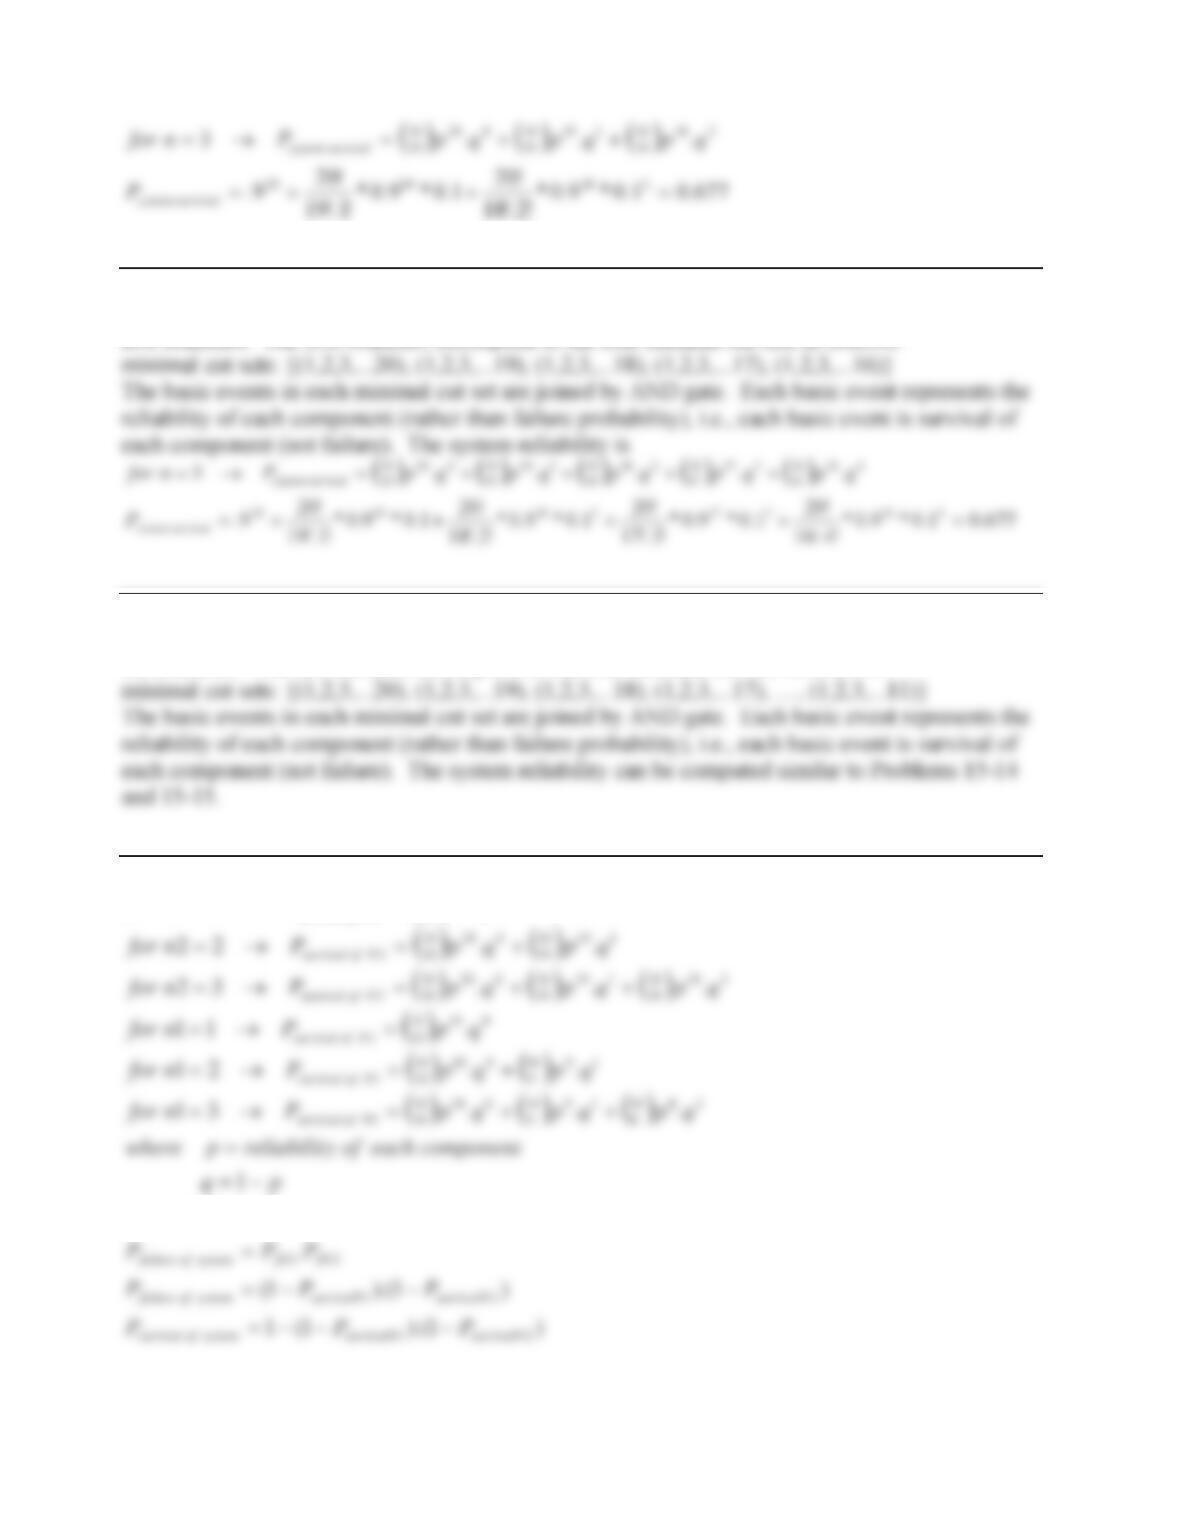
Using the binomial distribution probability mass function equation, the following results can be
obtained.
For N = 20
p
R n1 3 5 10
0.9 0.121577 0.676927 0.956826 0.999993
Problem 15-14.
The top event is defined as system survival. The fault tree has an OR gate under the top event with
three branches. The three branches correspond to the three minimal cut sets as follows:
0.9996
0.9998
1.0000
0.60
0.70
0.80
0.90
1.00
15-11
Problem 15-15.
The top event is defined as system survival. The fault tree has an OR gate under the top event with
five branches. The five branches correspond to the four minimal cut sets as follows:
Problem 15-16.
The top event is defined as system survival. The fault tree has an OR gate under the top event with
ten branches. The ten branches correspond to the four minimal cut sets as follows:
Problem 15-17.
02020
202
.12
qpPnfor
Nofsurvival
o
sin
compoentsbothoffailureissystemoffailurece
15-12
Problem 15-18.
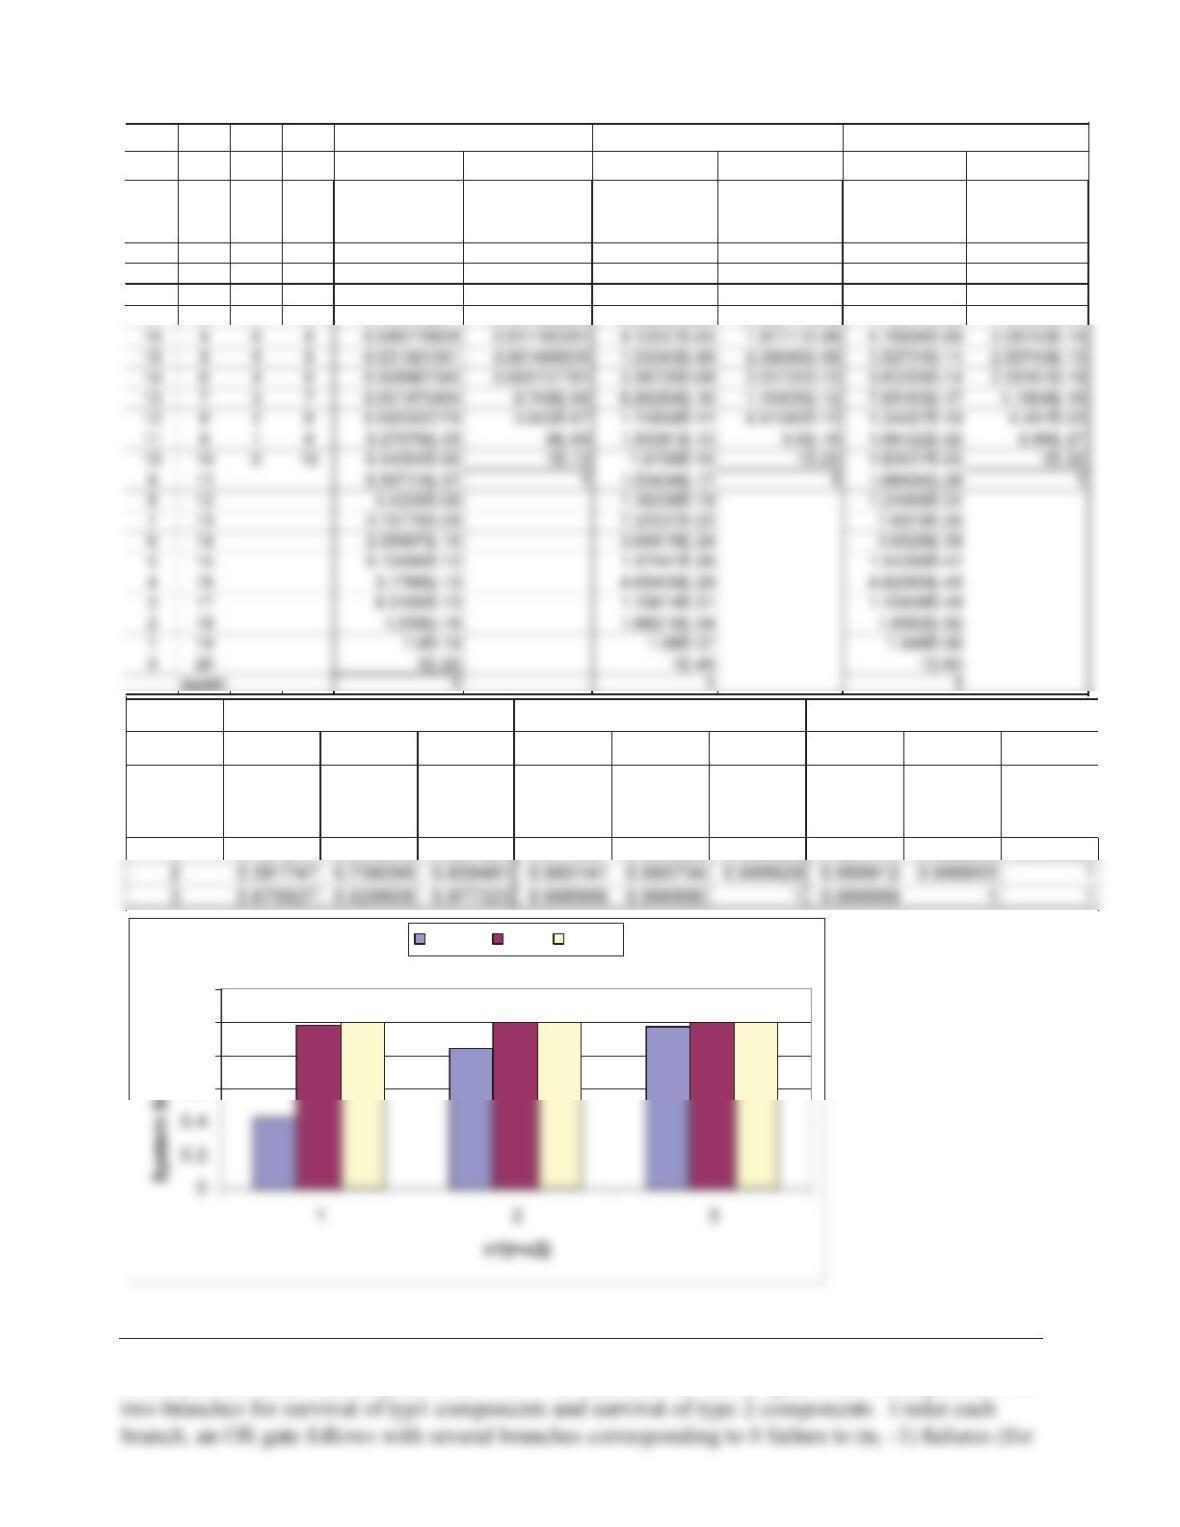
The top event is defined as system survival. The fault tree has an OR gate under the top event with
p=
TYPE-2 TYPE-1 TYPE-2 TYPE-1 TYPE-2 TYPE-1
m
n
(1-m) k
s
(1-k) (
20
m
)p
m
(1-p)
n
(
10
k
)p
k
(1-p)
s
(
20
m
)p
m
(1-p)
n
(
10
k
)p
k
(1-p)
s
(
20
m
)p
m
(1-p)
n
(
10
k
)p
k
(1-p)
s
20 0 10 0 0.121576655 0.34867844 0.817906938 0.904382075 0.980188865 0.99004488
19 1 9 1 0.270170344 0.387420489 0.165233725 0.091351725 0.019623401 0.009910359
18 2 8 2 0.285179807 0.193710245 0.015855761 0.004152351 0.000186609 4.46413E-05
17 3 7 3 0.190119871 0.057395628 0.000960955 0.000111848 1.12077E-06 1.19163E-07
0.9 0.99 0.999
p=
nP
N2survival
P
N1survival
P
s
y
s
P
N2survival
P
N1survival
P
s
y
s
P
N2survival
P
N1survival
P
s
y
s
1 0.121577 0.348678 0.427864 0.817907 0.904382 0.982589 0.980189 0.990045 0.999803
0.9 0.99 0.999
0.6
0.8
1
1.2
p= 0.9 0.99 0.999
15-13
Problem 15-19.
The top event is defined as system survival. The fault tree has an OR gate under the top event with
Problem 15-20.
The top event is defined as system survival. The fault tree has an OR gate under the top event with