122
CHAPTER 10. WOOD
10.2. See Section 10.1.1.
10.3. I would choose sample B because higher specific gravity indicates more cellulose and a
10.5. See Section 10.2.
10.7. See Section 10.3.
10.8. According to Figure 10.5 the FSP = 28. The changes in dimensions are due to the
reduction of moisture below the FSP.
10.9. a. No dimension change occurs above FSP.
c. XMC = XFSP (1 – Rate of dimension change x Change in moisture content)
Assume a 30% FSP
123
Assume a 1% swelling of the green dimension per 5% increase in moisture content below
10.12. See Section 10.4.1
10.14. See Section 10.5
10.16. See Section 10.8 and Figure 10.12
10.17. E = V/H = 20 / (0.00225) = 8,889 MPa
10.18. The typical load duration used in designing wood structures is 10 years.
10.19. Testing of structural-size members is more important than testing small, clear specimens
10.20. The actual dimensions of the 2 x 4 lumber is 1.5″ x 3.5″.
124
10.21. a. The actual dimensions of the 4 x 4 lumber is 3.5″ x 3.5″.
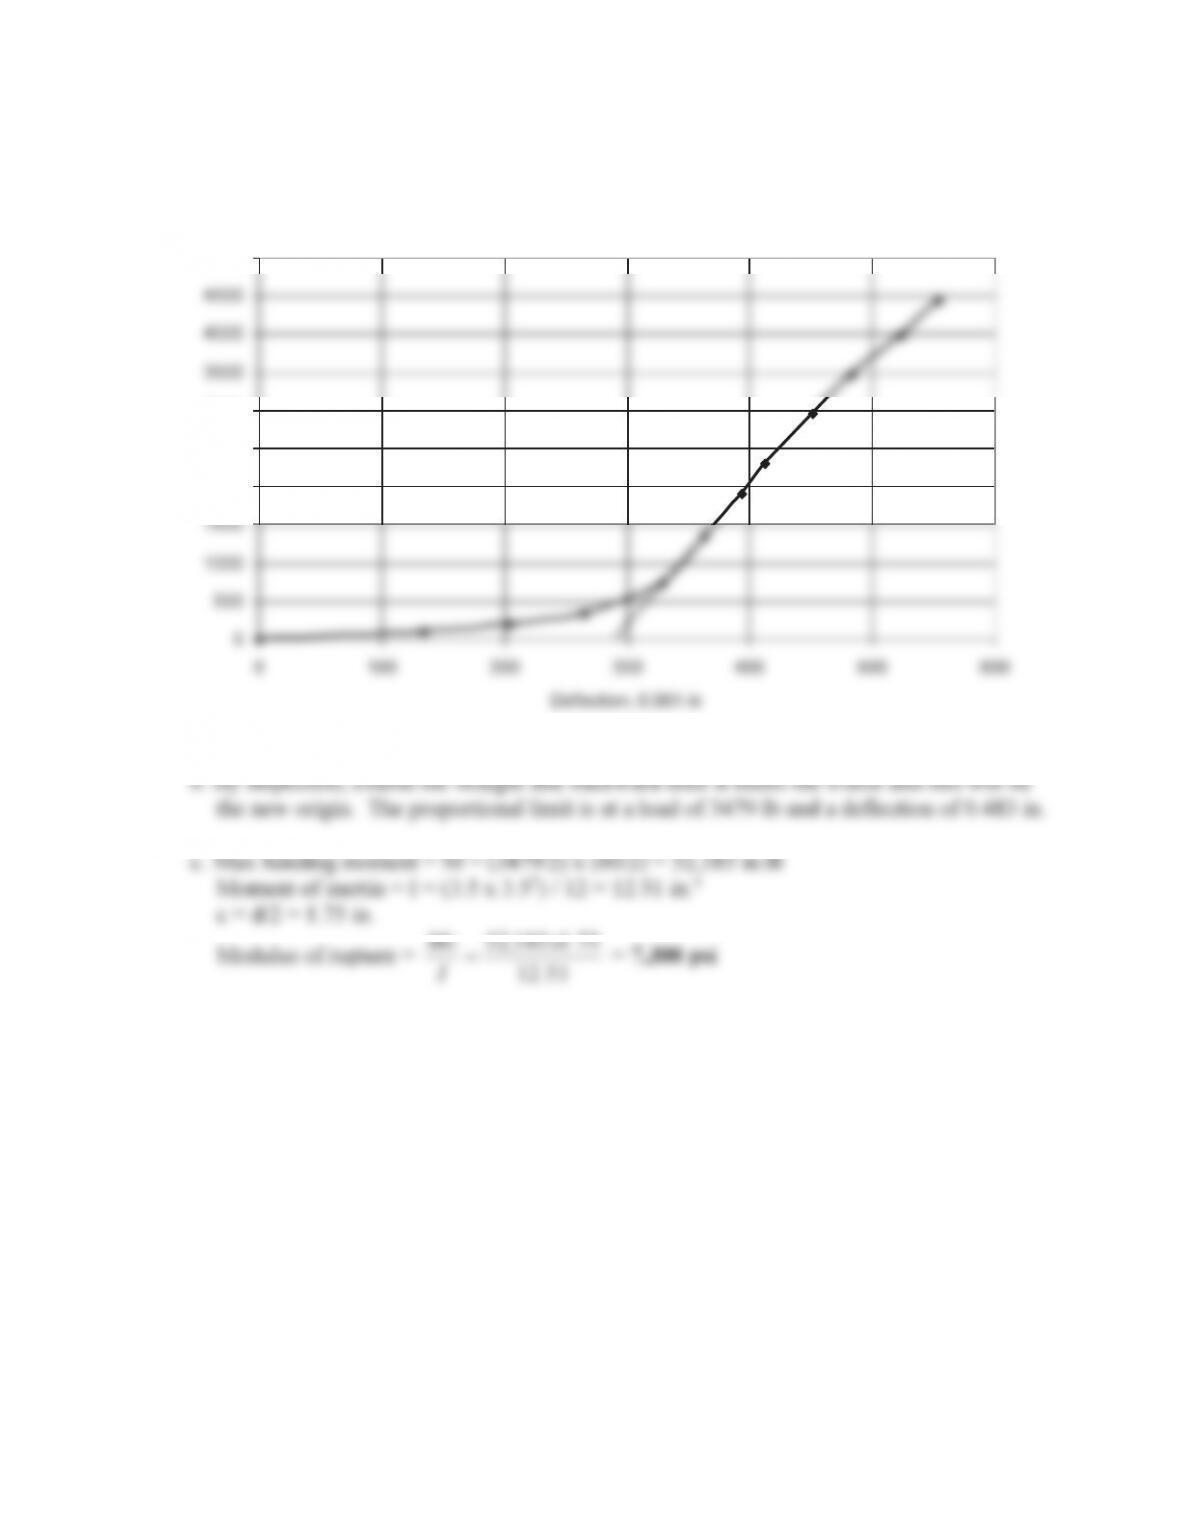
The load versus deflection is shown below.
b. By inspection, extend the straight line backward until it meets the x-axis and this will be
the new origin. The proportional limit is at a load of 3479 lb and a deflection of 0.483 in.
c. Max bending moment = M = (3479/2) x (60/2) = 52,185 in.lb
Moment of inertia = I = (3.5 x 3.53) / 12 = 12.51 in.4
c = d/2 = 1.75 in.
Modulus of rupture =
51.12
75.1185,52 x
I
Mc
=7,300 psi
‘HIOHFWLRQLQ
/RDGOE
125
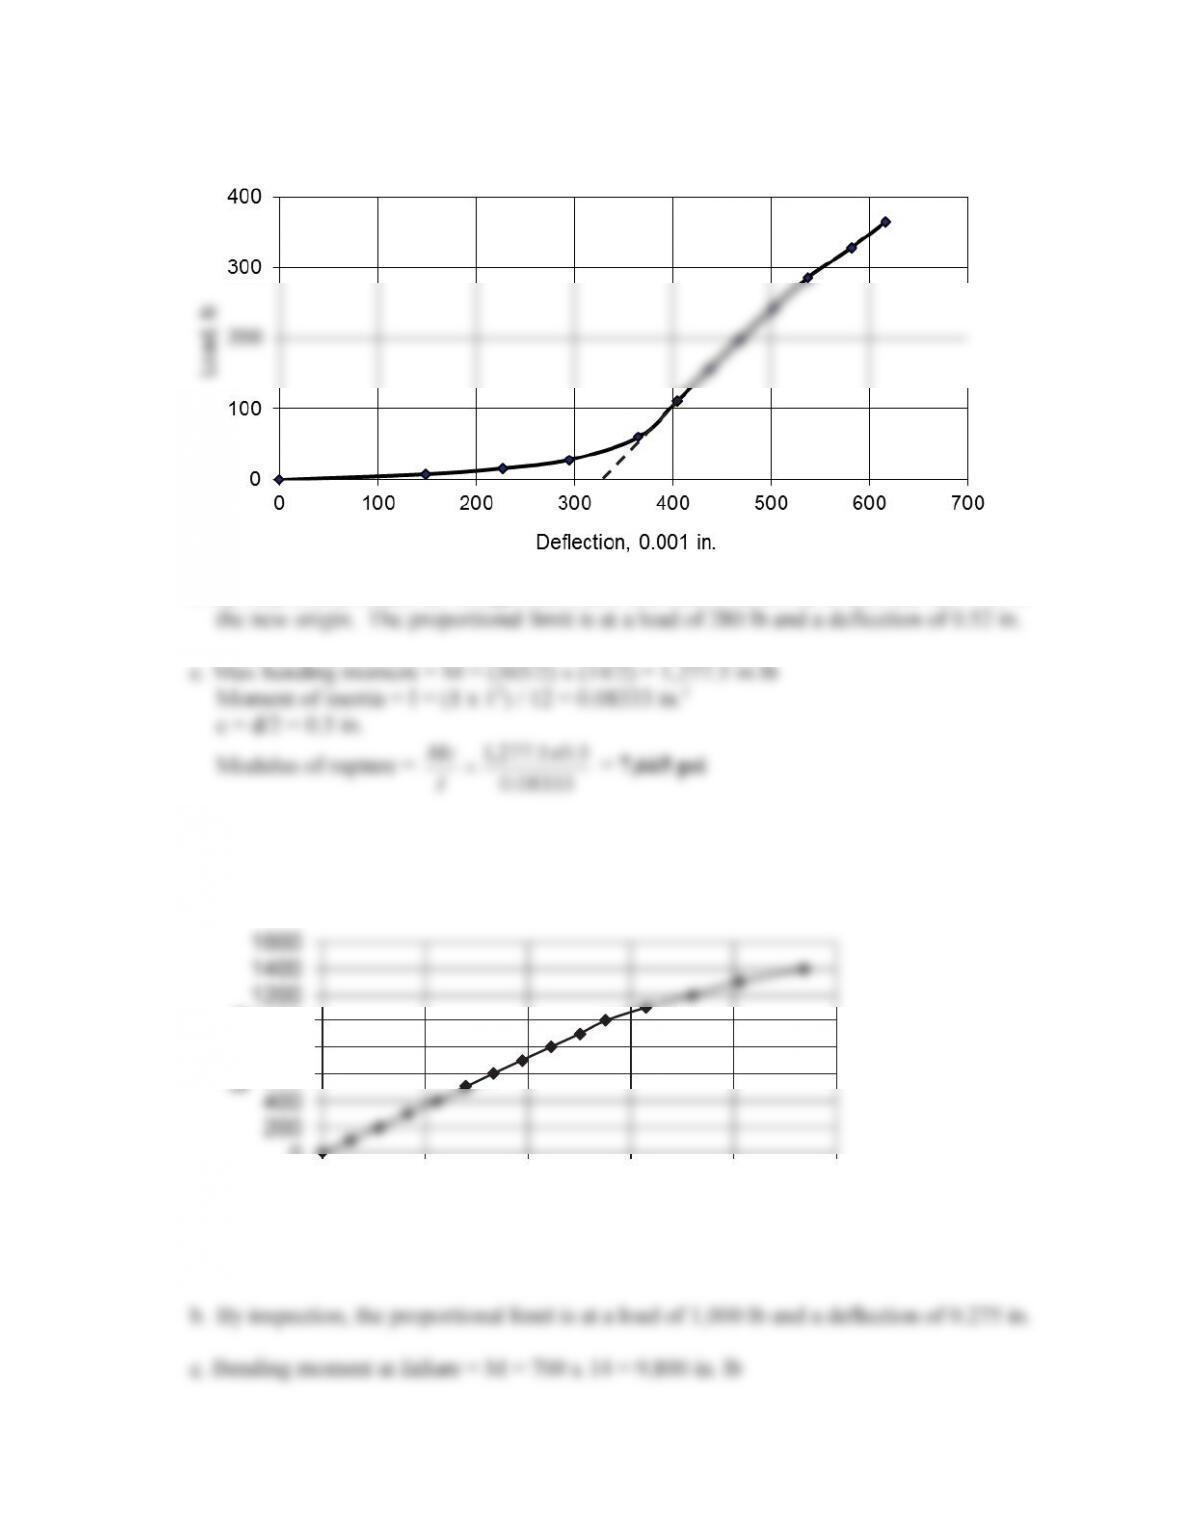
10.22. a. The load versus deflection is shown below.
b. By inspection, extend the straight line backward until it meets the x-axis and this will be
08333.0
I
10.23. a. The load versus deflection is shown below.
‘HIOHFWLRQLQ
126
333.1
I
d. The modulus of rupture computed does not truly represent the extreme fiber stresses in
10.24. a. Stress (psi) = Load (lb) / (1 in. x 1 in.)
Load,
lb
Displacement,
in.
Stress,
psi
Strain,
in./in.
0
0.000
0
0.000
7
0.012
7
0.003
10
0.068
10
0.017
87
0.164
87
0.041
530
0.180
530
0.045
1705
0.208
1705
0.052
2864
0.236
2864
0.059
3790
0.268
3790
0.067
4606
0.300
4606
0.075
5338
0.324
5338
0.081
5116
0.360
5116
0.090
4468
0.384
4468
0.096
4331
0.413
4331
0.103
127
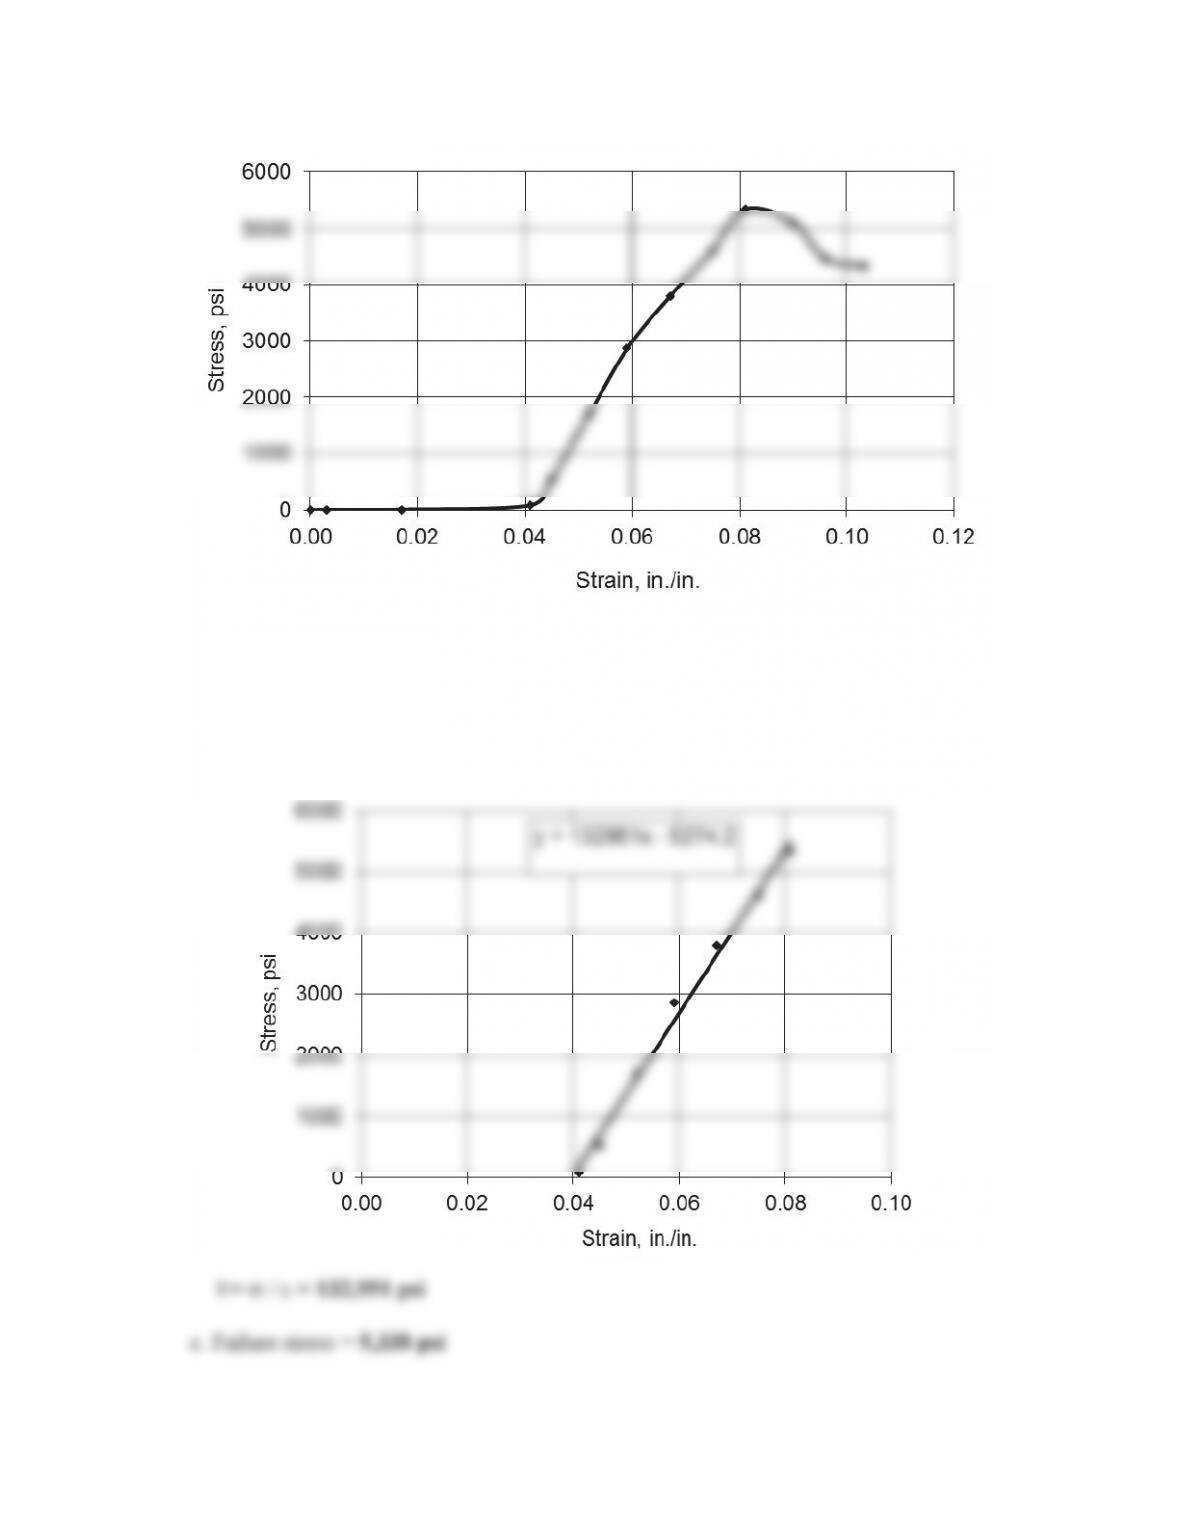
b. The modulus of elasticity is the slope of the stress-stain line. The first part of the curve
includes an experimental error probably due to the lack of full contact between the
machine head and the specimen. Therefore, ignore the first portion of the curve and
draw the best fit straight line up to the maximum stress. The modulus of elasticity is the
slope of the line as shown on the figure below:
128
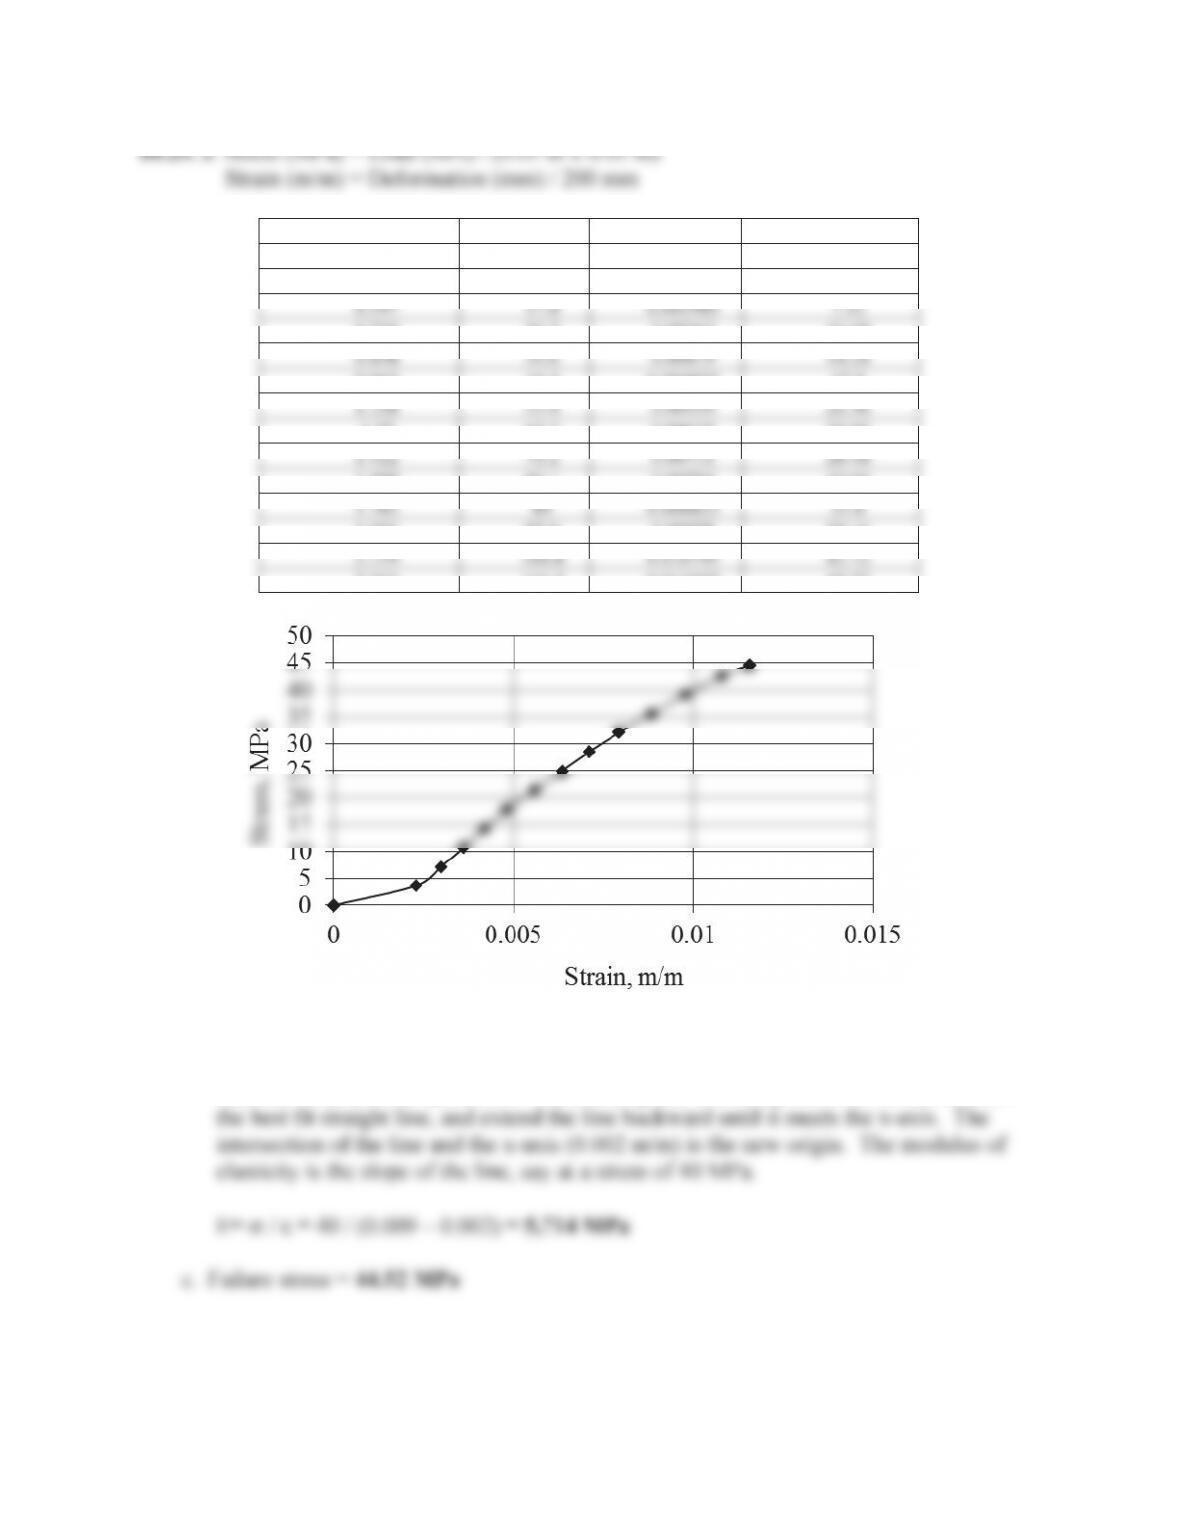
Deformation, mm
Load kN
Strain
Stress (N/mm2)
0
0
0
0
0.457
8.9
0.002285
3.56
0.597
17.8
0.002985
7.12
0.724
26.7
0.00362
10.68
0.838
35.6
0.00419
14.24
0.965
44.5
0.004825
17.8
1.118
53.4
0.00559
21.36
1.27
62.3
0.00635
24.92
1.422
71.2
0.00711
28.48
1.588
80.1
0.00794
32.04
1.765
89
0.008825
35.6
1.956
97.9
0.00978
39.16
2.159
106.8
0.010795
42.72
2.311
111.3
0.011555
44.52
b. The modulus of elasticity is the slope of the stress-stain line. The first part of the curve
includes an experimental error probably due to the lack of full contact between the
machine head and the specimen. Therefore, ignore the first portion of the curve, draw
129
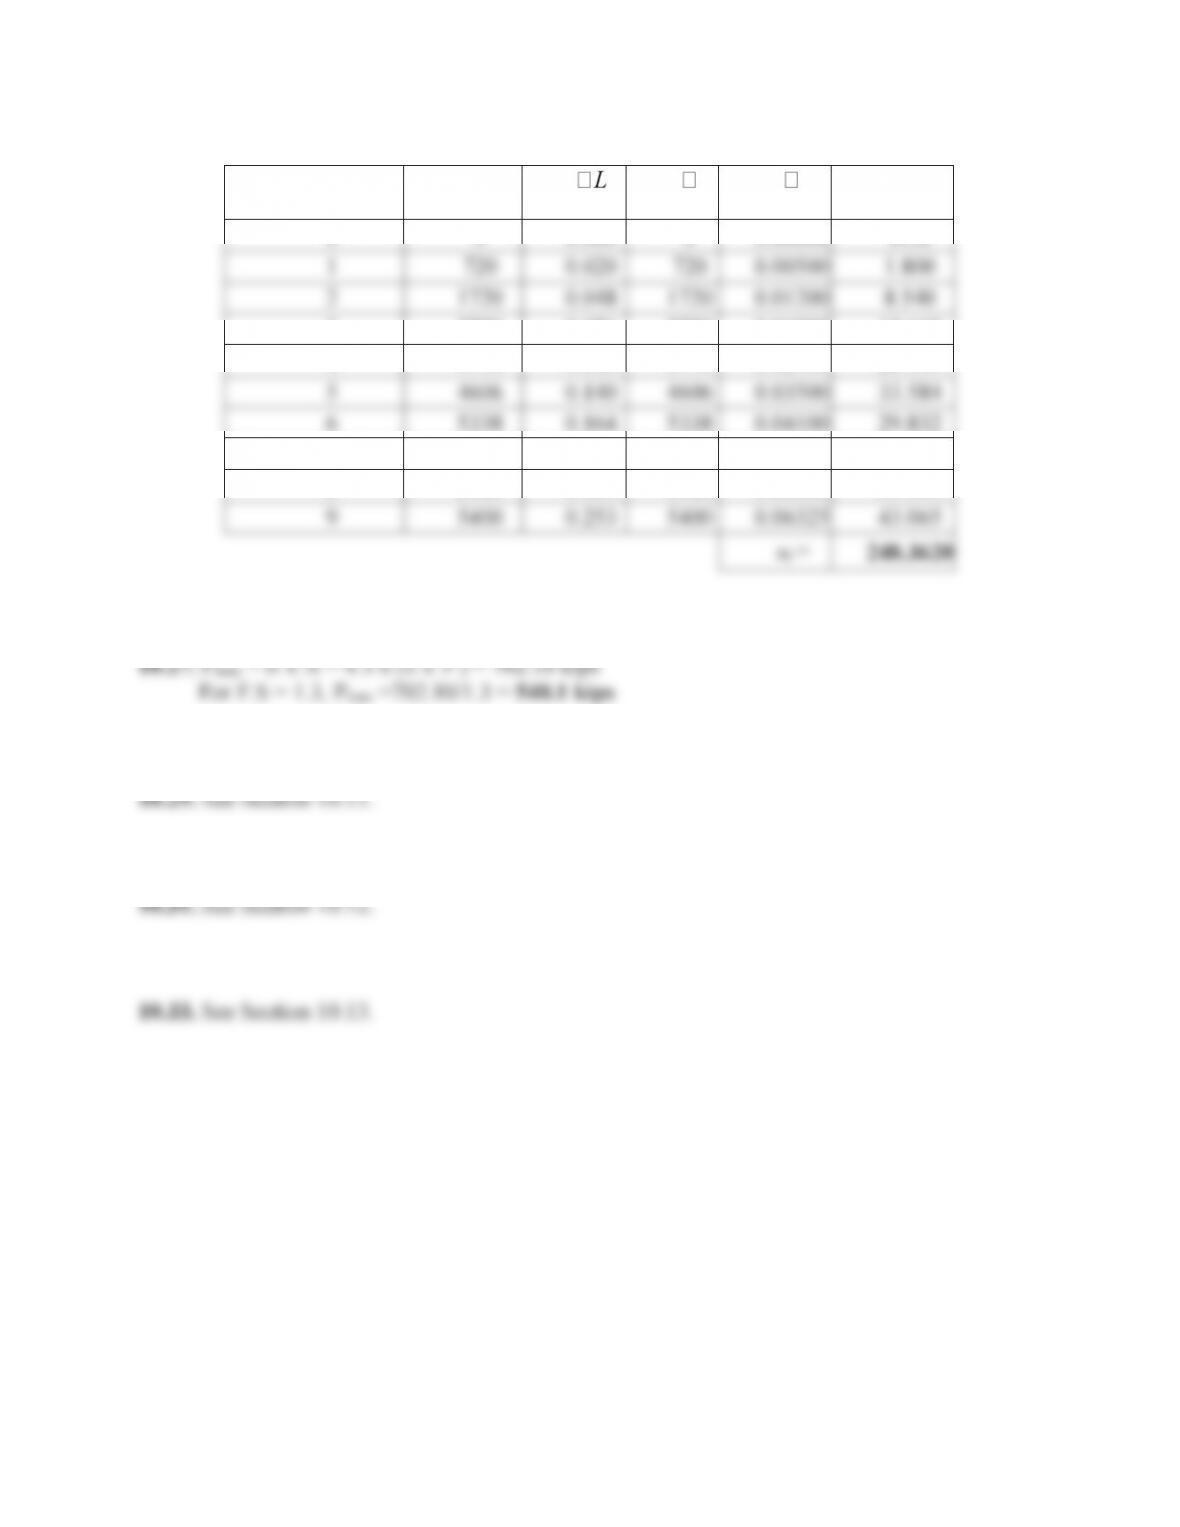
10.26.
Observation
No.
P
(lb)
(in.)
(psi)
(in./in.)
u
i
(psi)
0
0
0.000
0
0.00000
N/A
1
720
0.020
720
0.00500
1.800
2
1720
0.048
1720
0.01200
8.540
3
2750
0.076
2750
0.01900
15.645
4
3790
0.108
3790
0.02700
26.160
5
4606
0.140
4606
0.03500
33.584
6
5338
0.164
5338
0.04100
29.832
7
6170
0.200
6170
0.05000
51.786
8
6480
0.224
6480
0.05600
37.950
9
5400
0.253
5400
0.06325
43.065
u
t
=
248.3620
10.27. Pmax =Vx A = 4.3 x (Sx 52) = 702.10 kips
For F.S = 1.3, Pmax =702.10/1.3 = 540.1 kips
10.28. See Section 10.10.
10.30. See Section 10.12.
10.32. See Section 10.13.