9-1
Chapter 9
Chapter 9 (Short Answers)
9.1. Simple interest is calculated such that the interest is based on the original principal.
9.2 The nominal interest rate is a number based on interest payments once per year; however,
if interest is compounded multiple times per year, the interest rate for the period is the
9.3
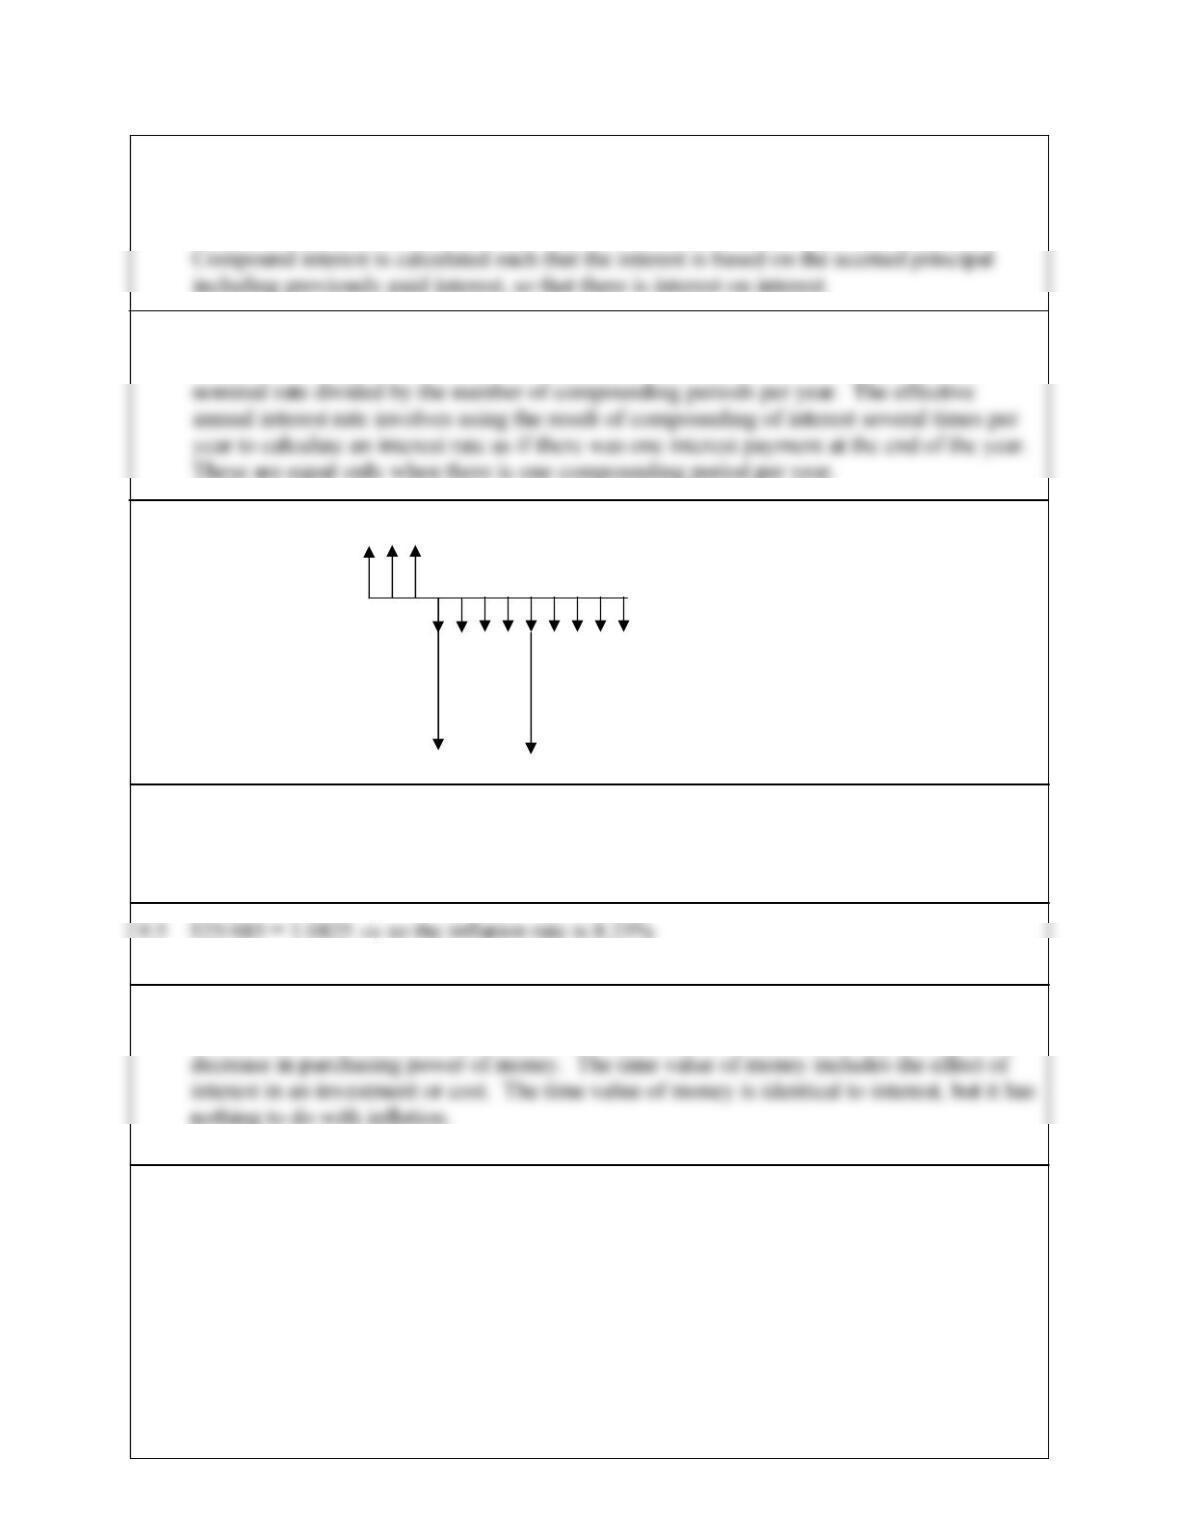
9.4 An annuity is a uniform (constant) series of transactions at the same interval. Examples
include a loan payment, a fixed monthly deduction from a paycheck into savings, etc.
9.6 Interest is the return on an investment or the charge for borrowing money. Inflation is the
increase in cost over time of goods, commodities, and services, which is equivalent to the
9.7 This term is depreciation
S O N D J F M A May
Jn Jl A
9-2
9.8 Depreciation is an accounting procedure that allows a company to reduce their taxable
9.9 The time value of money suggests that “a dollar today is worth more than a dollar
9.10 A company can only use depreciation to offset revenue. Depreciation can never exceed
profit. Therefore, a small company, with only one project, may have to defer depreciation
9.11 After-tax profit is the net profit from the project taking into account all expenses including
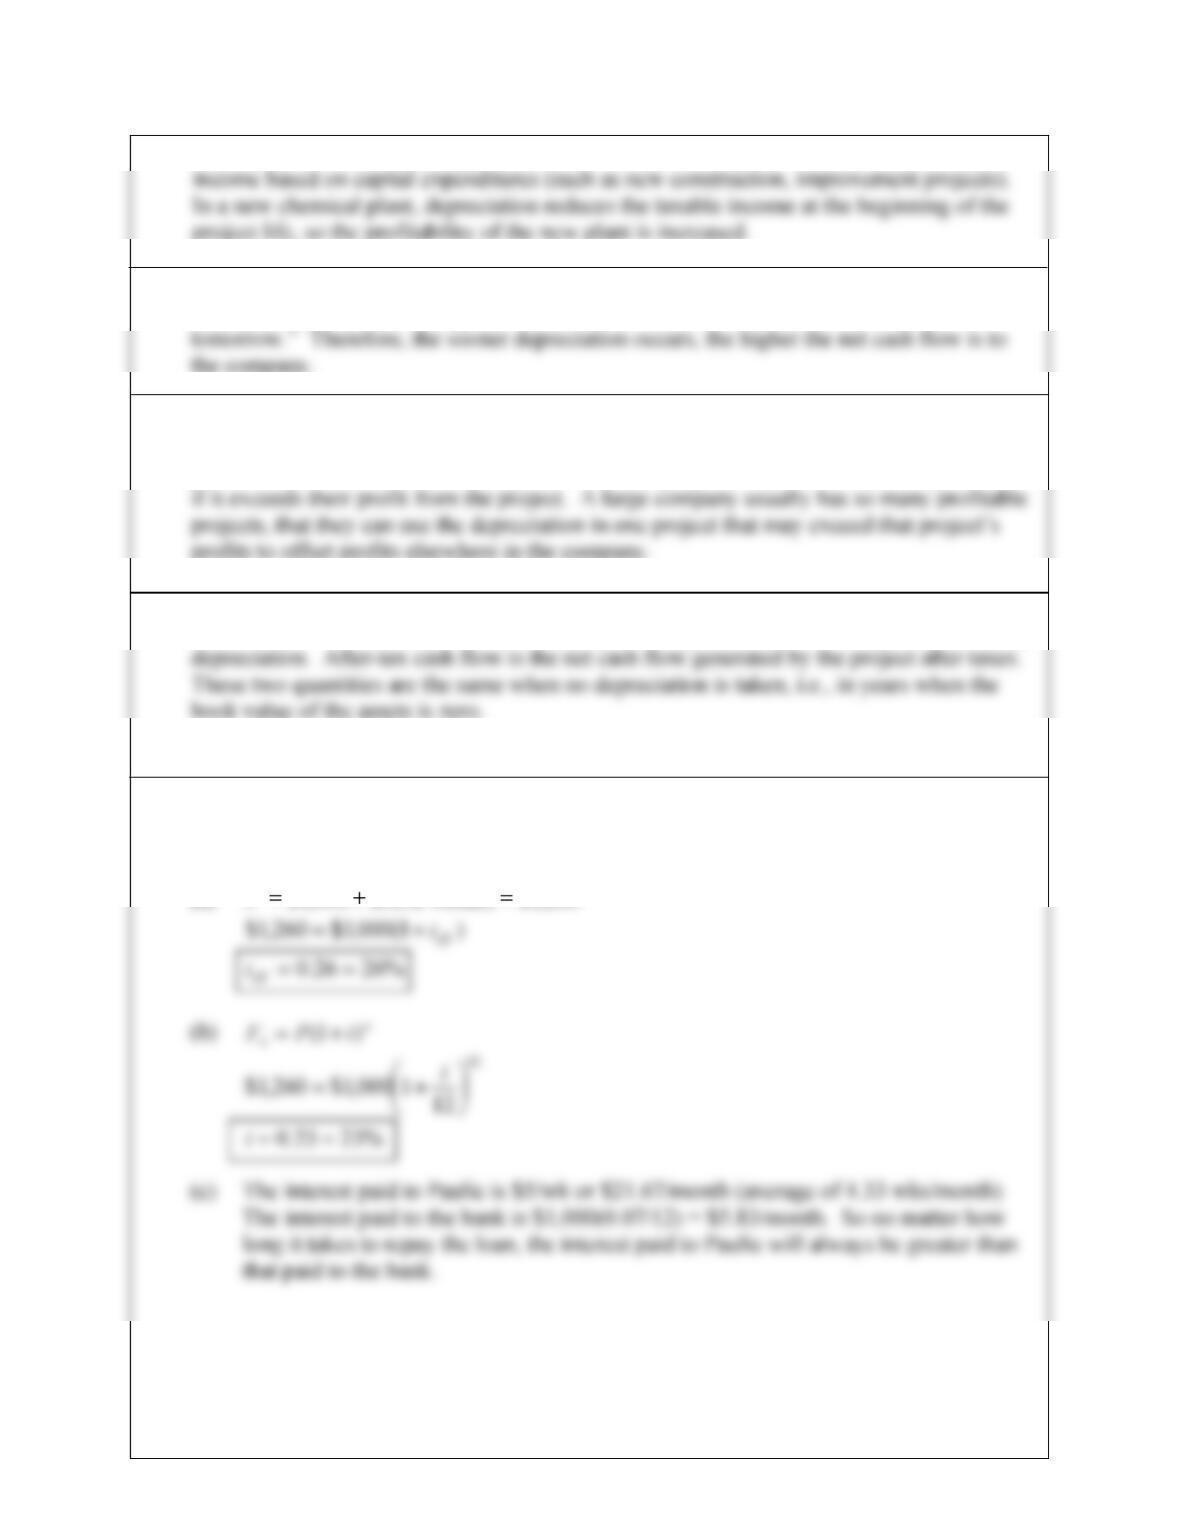
9.12 P = $1,000
F = $1,000(1 + ieff)
(a) 260,1$) weeks52(5$000,1$F
9.13
(a)
mn
m
i
P
F1
000,1$P
(b) F = P(1 + ieff)
1000,1$21.109,1$
eff
i
9-4
9.14 n
iPF 1
2
P
F
9.15 11
mn
eff m
i
i
i ie
ff
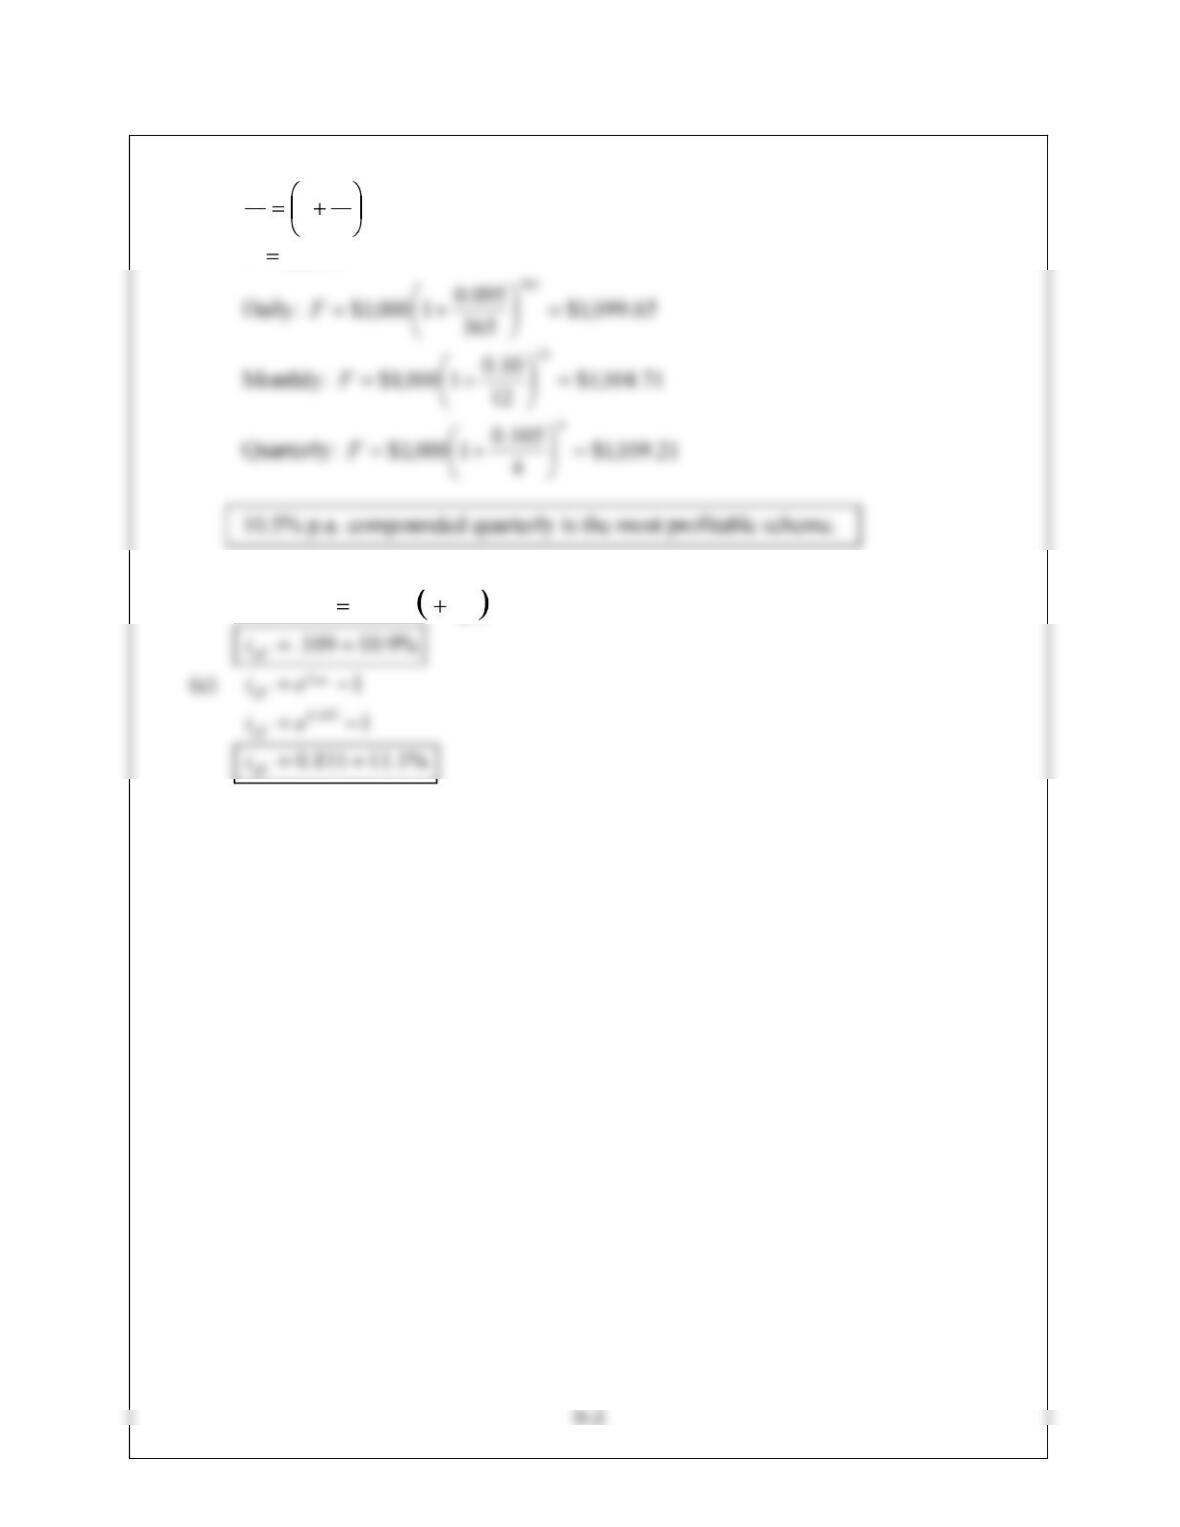
0.04 0.0408
9.16 in
cont
mn
PeF
m
i
P
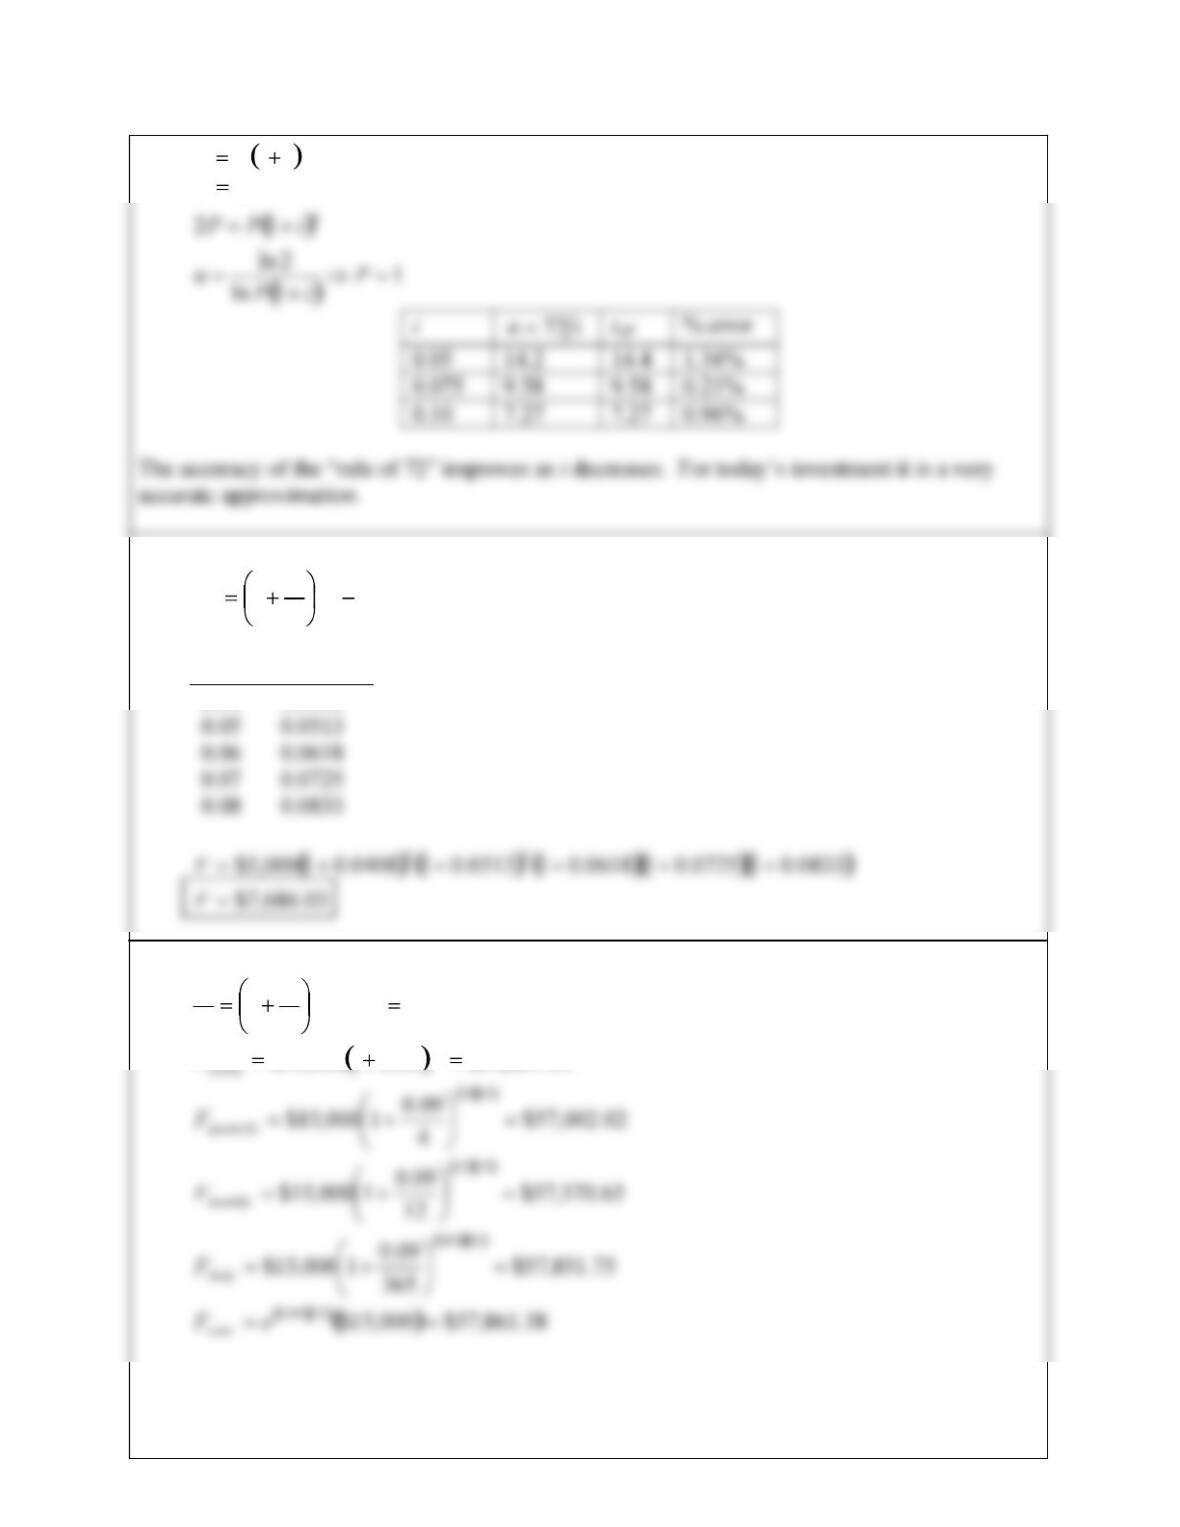
F;1
24.637,54$09.01000,15$
15
F
9.17
mn
m
i
P
F1
If P= $1
9.18
(a)
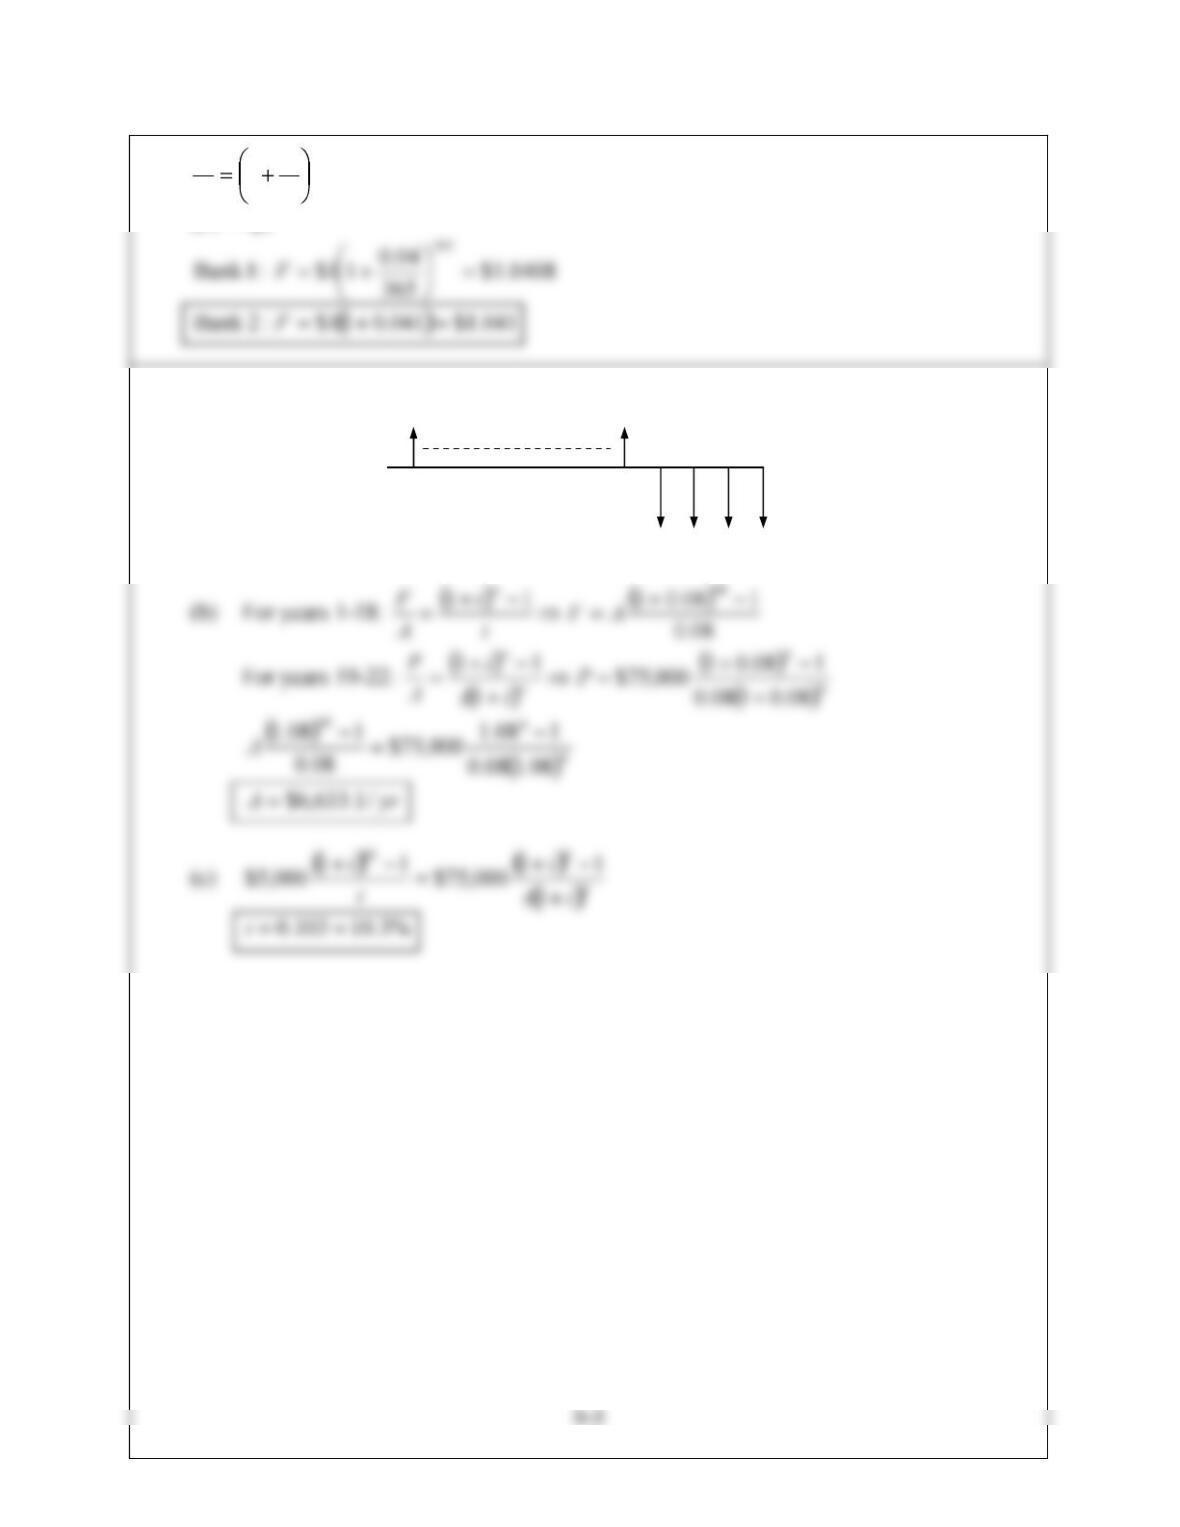
0 1 18
19 20 21 22
A
75 75 75 75
9-6
9.19
(a)
50
10
555
0 1 8 25
9.20
(a)
(b) i
i
A
F
i
P
Fn
n11
;1
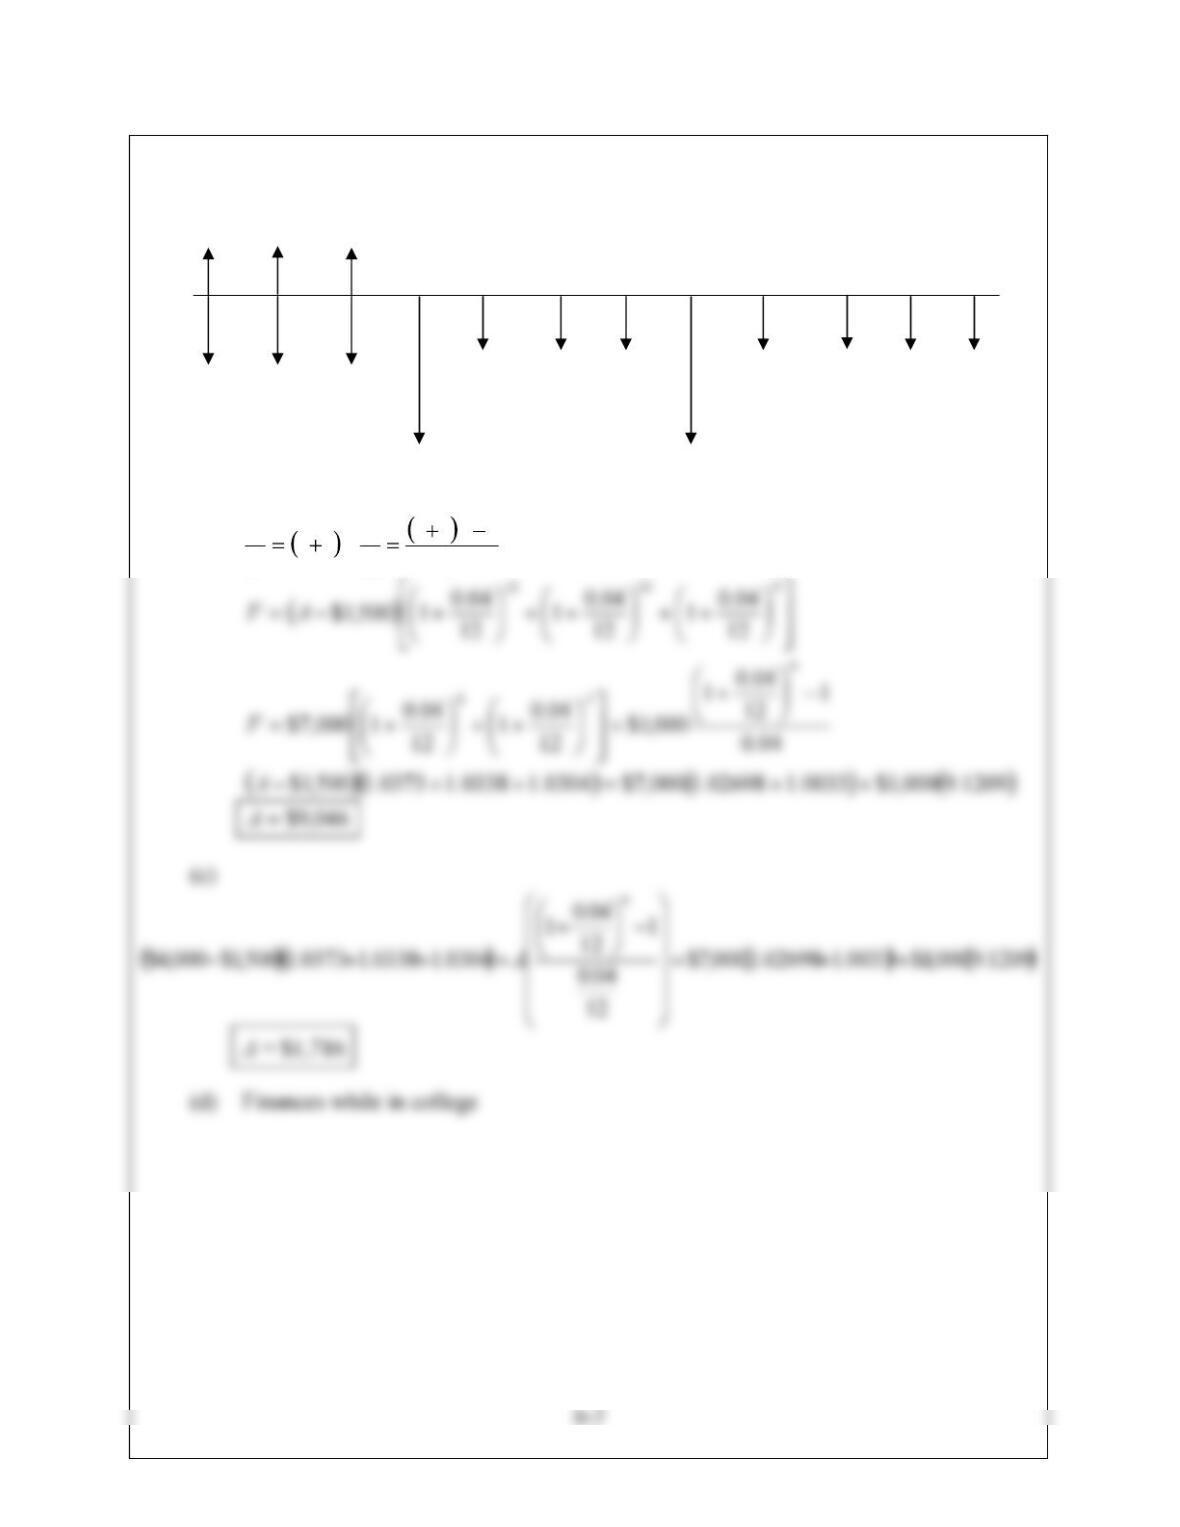
June Jul Aug Sept Oct Nov Dec Jan Feb March April May
AAA
1500 1500 1500
8000
1000 1000 1000 1000 1000 1000 1000
8000
9.21
(a)
nm
m
i
PF 1
9.22 i
i
A
Fn11
(a) i
i11
000,6$000,000,1$
40
%29.60629.0i
9-9
9.23
(a) 16,09.0,000,6$16,09.0,25,09.0,000,5$ A
F
P
F
A
F
F
9.24 11
1
n
n
i
ii
P
A
1
12
07.0
1
12
07.0
1
12
07.0
000,25$ 312
312
A
9.25 11
1
n
n
i
ii
P
A
9.26 11
1
n
n
i
ii
P
A
(a)
1
065.0
1
12
065.0
1
12
065.0
000,200$ 3012
3012
A
9-11
9.27 11
1
n
n
i
ii
P
A
1
1
12
1
12
000,225$600,1$ 2512
2512
i
ii
9.28 11
1
n
n
i
ii
P
A
9.29 11
1
n
n
i
ii
P
A
9-12
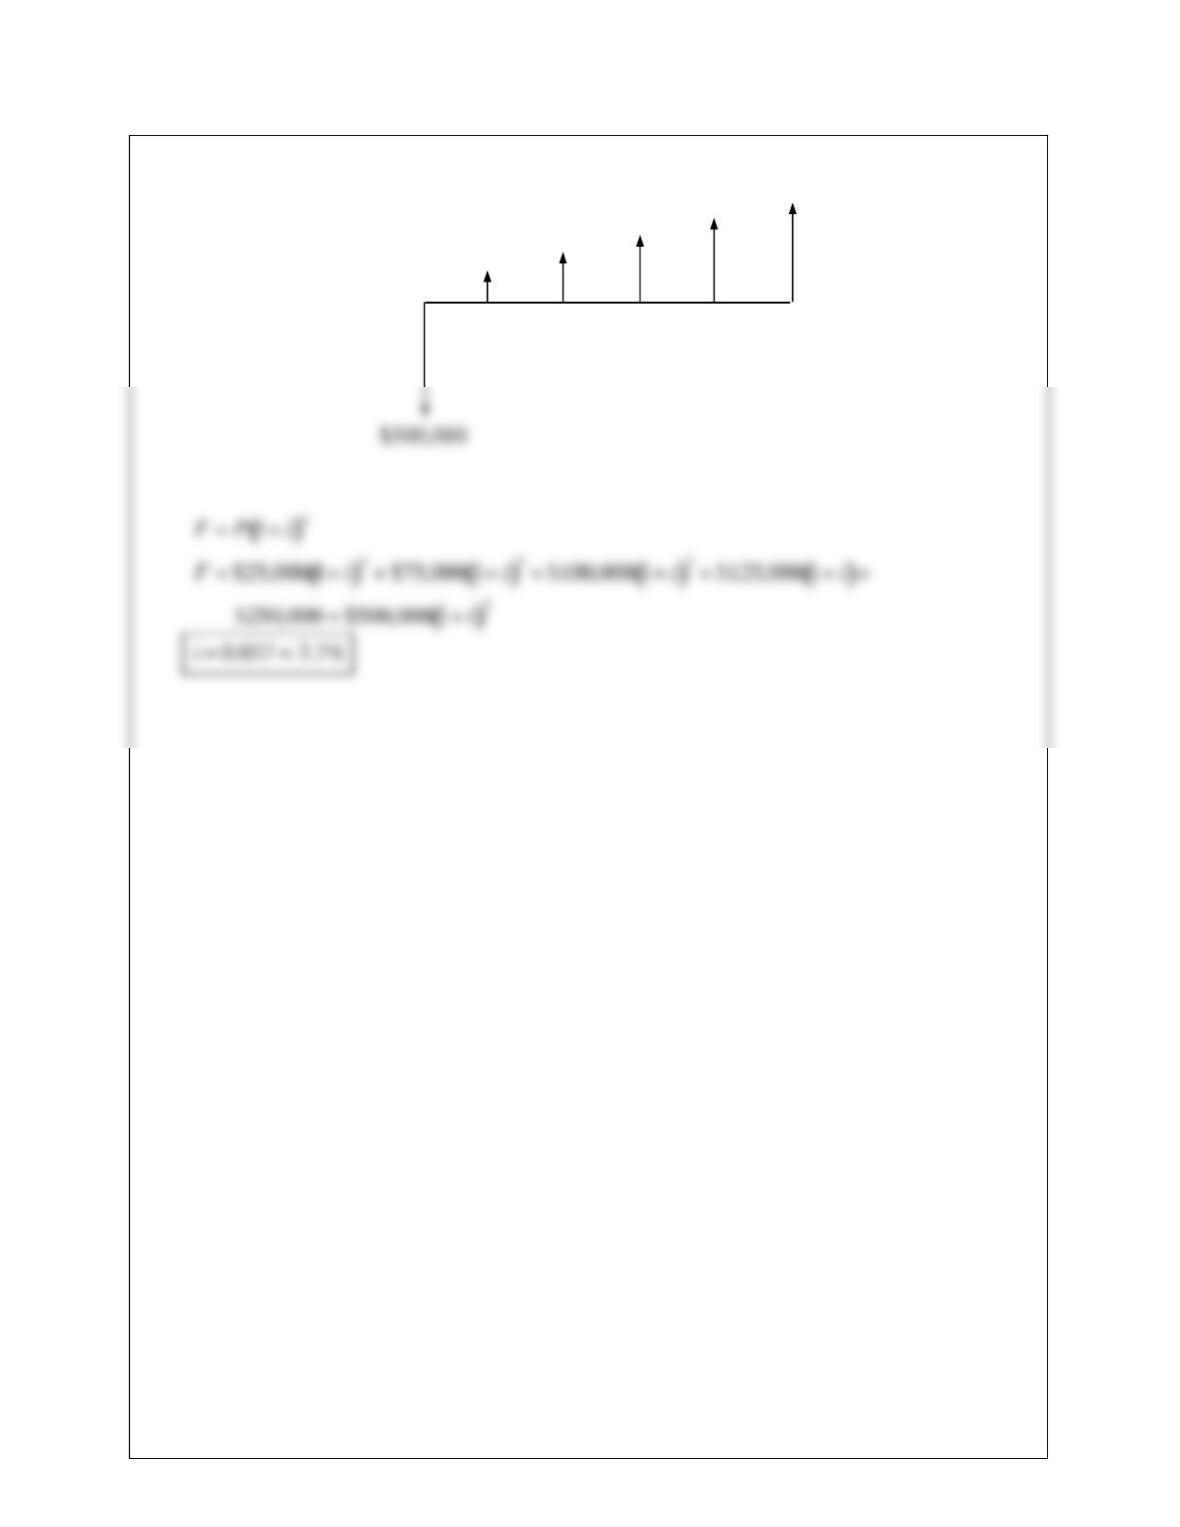
9.30
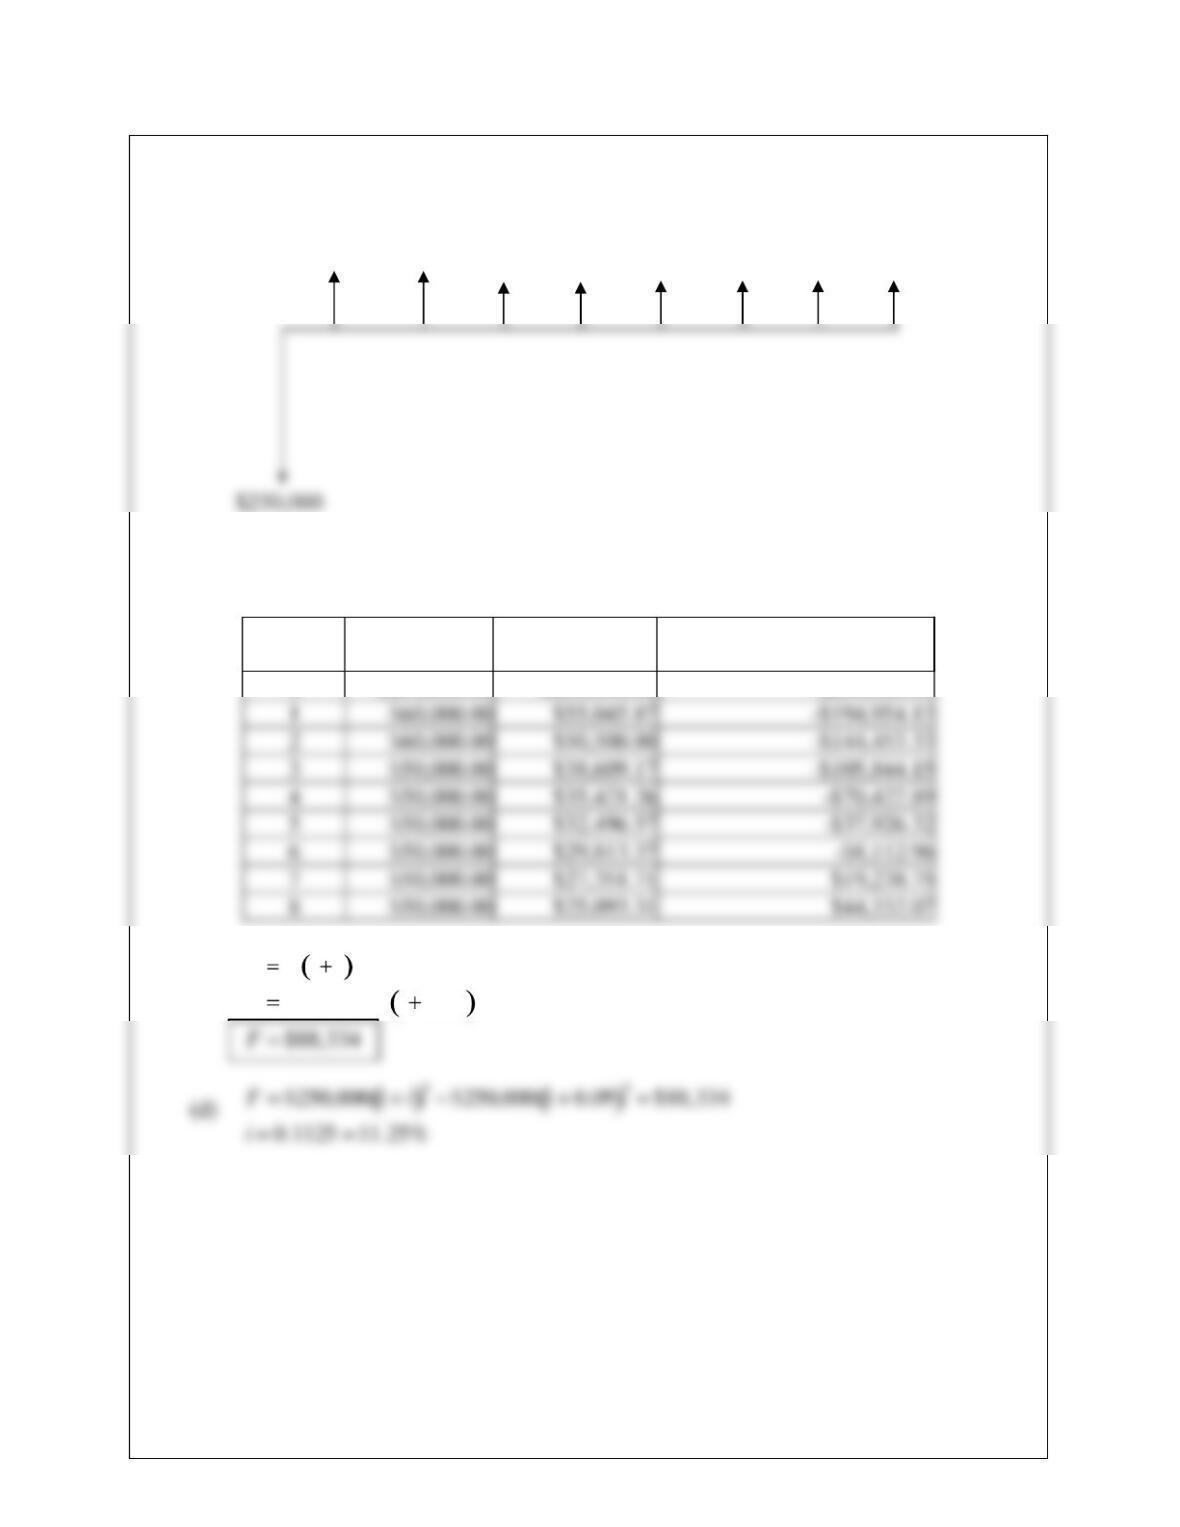
$25,000$75,000$100,000
$125,000$250,000
9-13
9.31
(a)
(b) Cumulative, discounted cash flow diagram
Year Cash Flow Discounted
Cash Flow
Cumulative, Discounted
Cash Flow
0 -$250,000.00 -$250,000.00
-$250,000.00
(c) F P 1in
F$44,332.07 1 0.09 8
$60,000 $60,000 $50,000…………………………………..$50,000
9-14
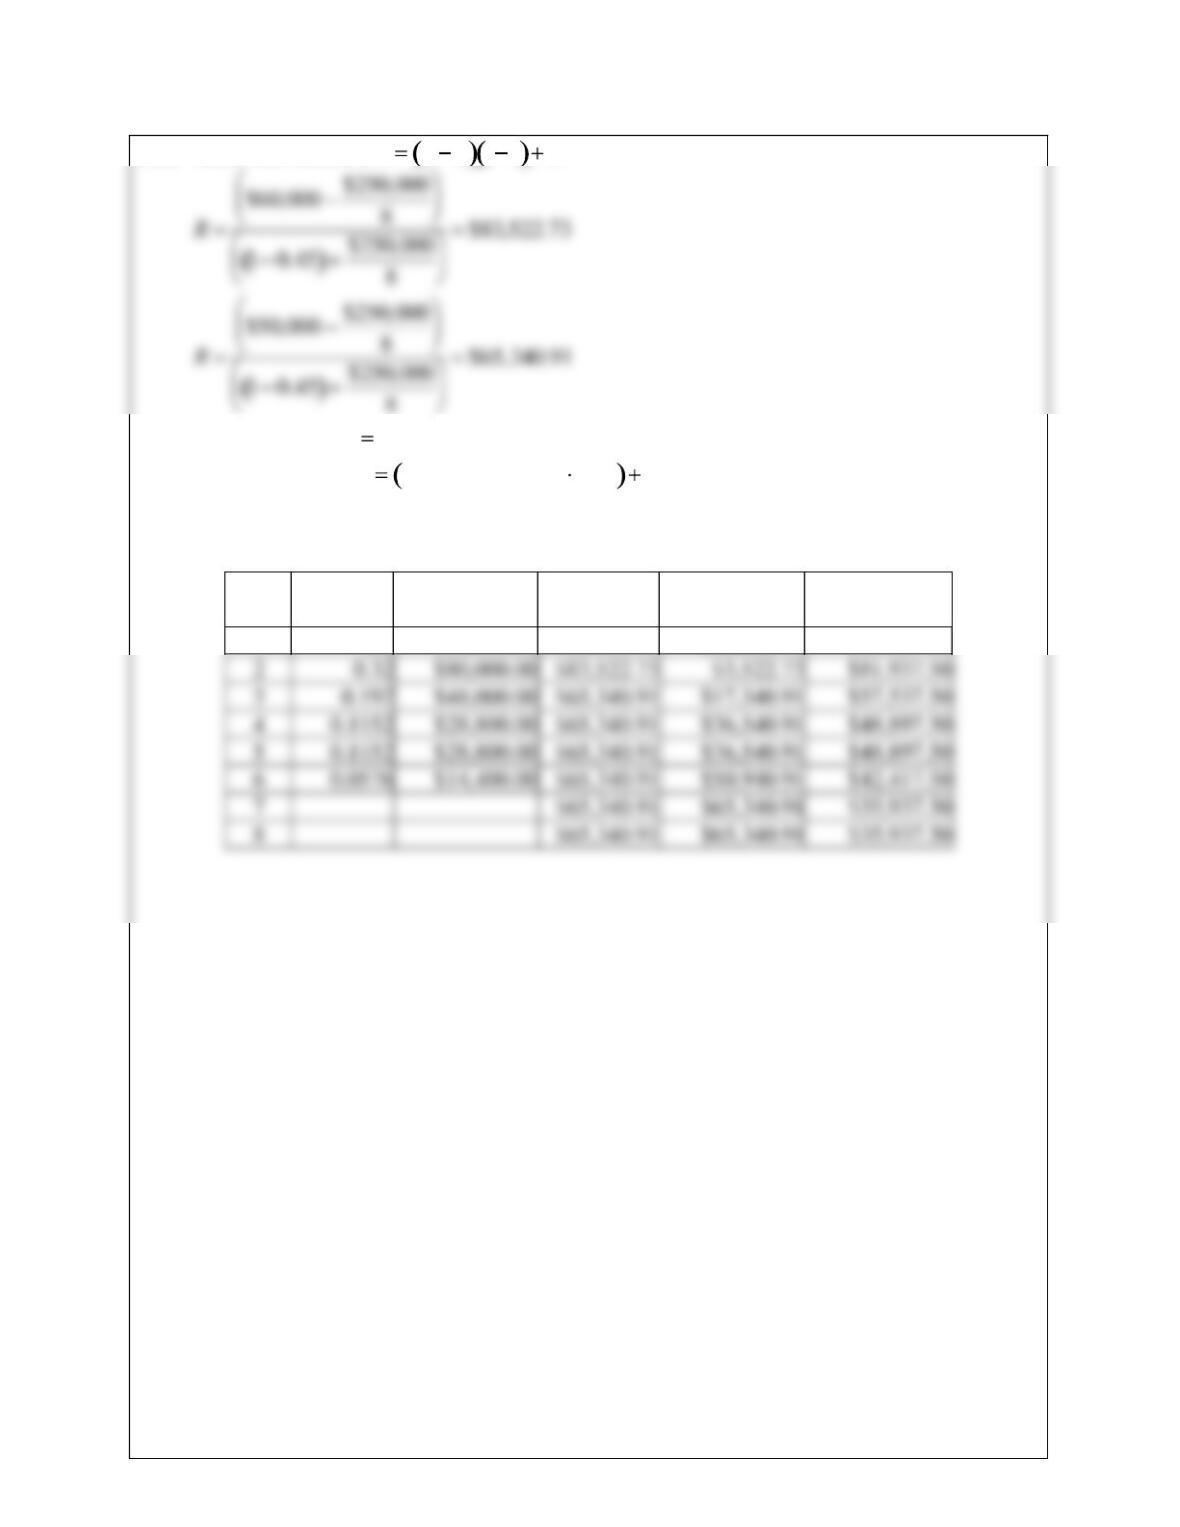
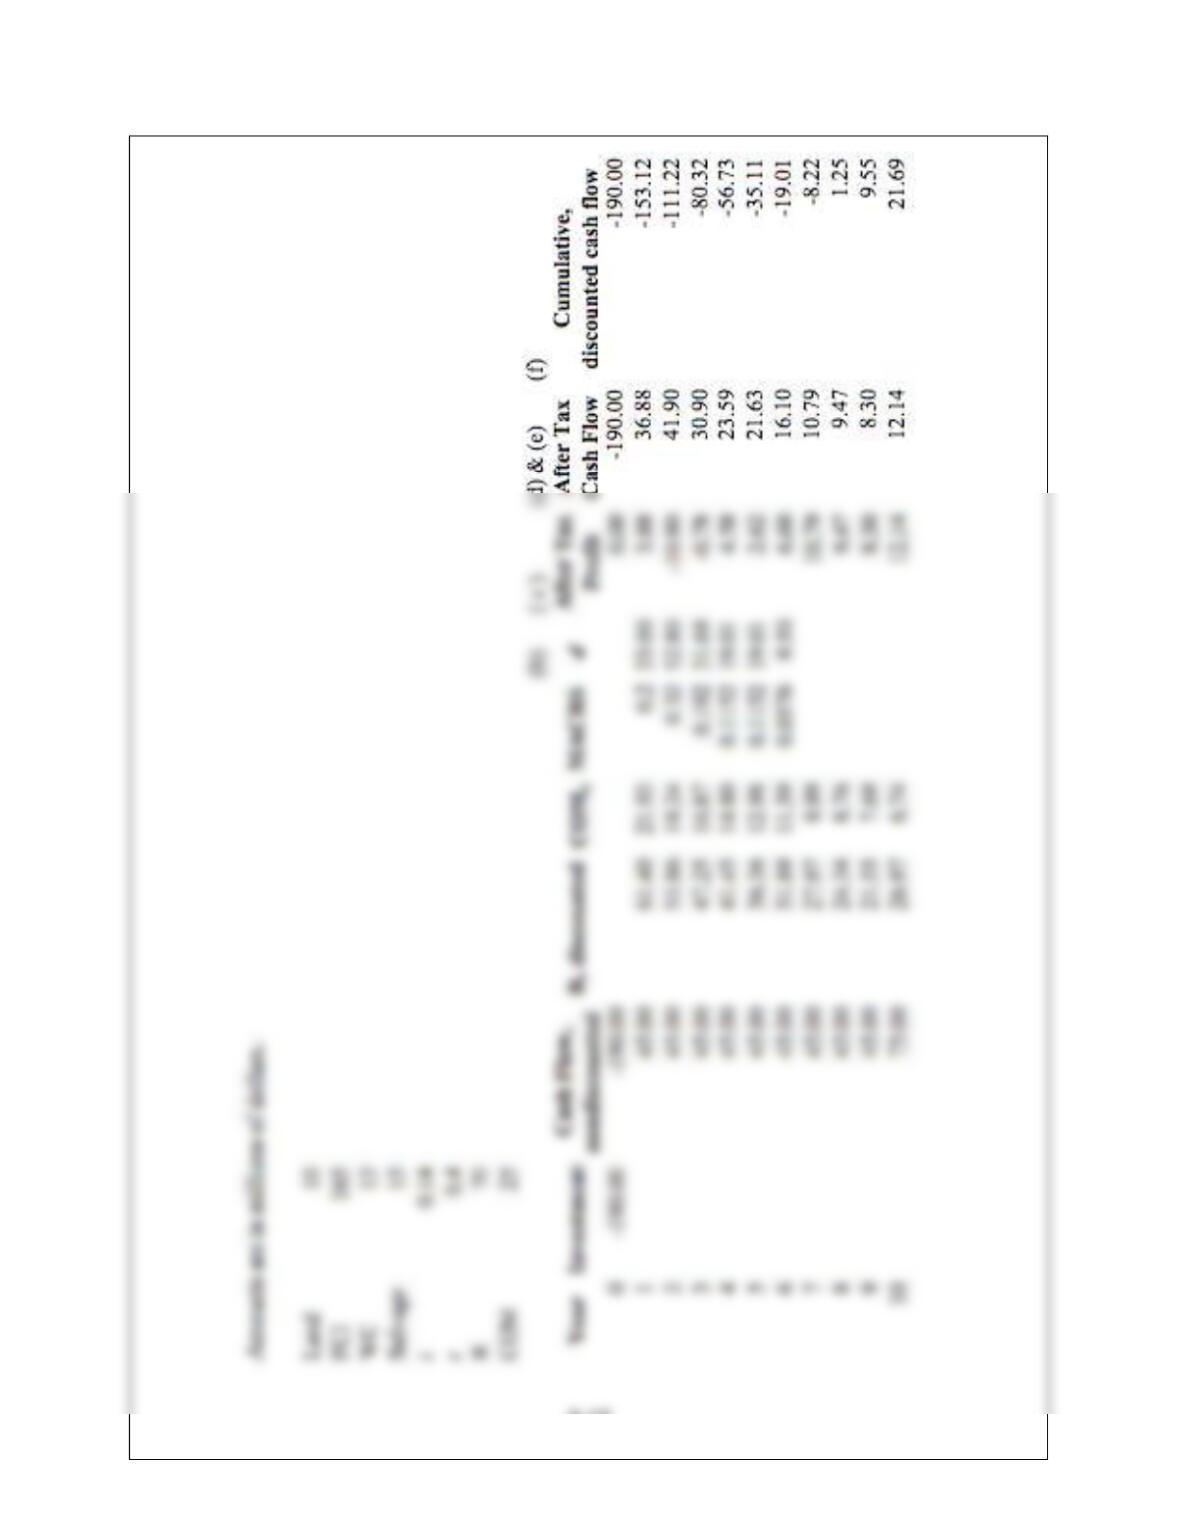
9.32 After Tax Cash Flow R d 1t d
Before Tax Profit Revenue – Depreciation
After Tax Revenue Before Tax Profit 0.55 Depreciation
Note: All values in millions of dollars.
Year MACRS Depreciation
Revenue
Before Tax
Profit
After Tax
Revenue
1 0.2 $50,000.00 $83,522.73 $33,522.73 $68,437.50
9-15
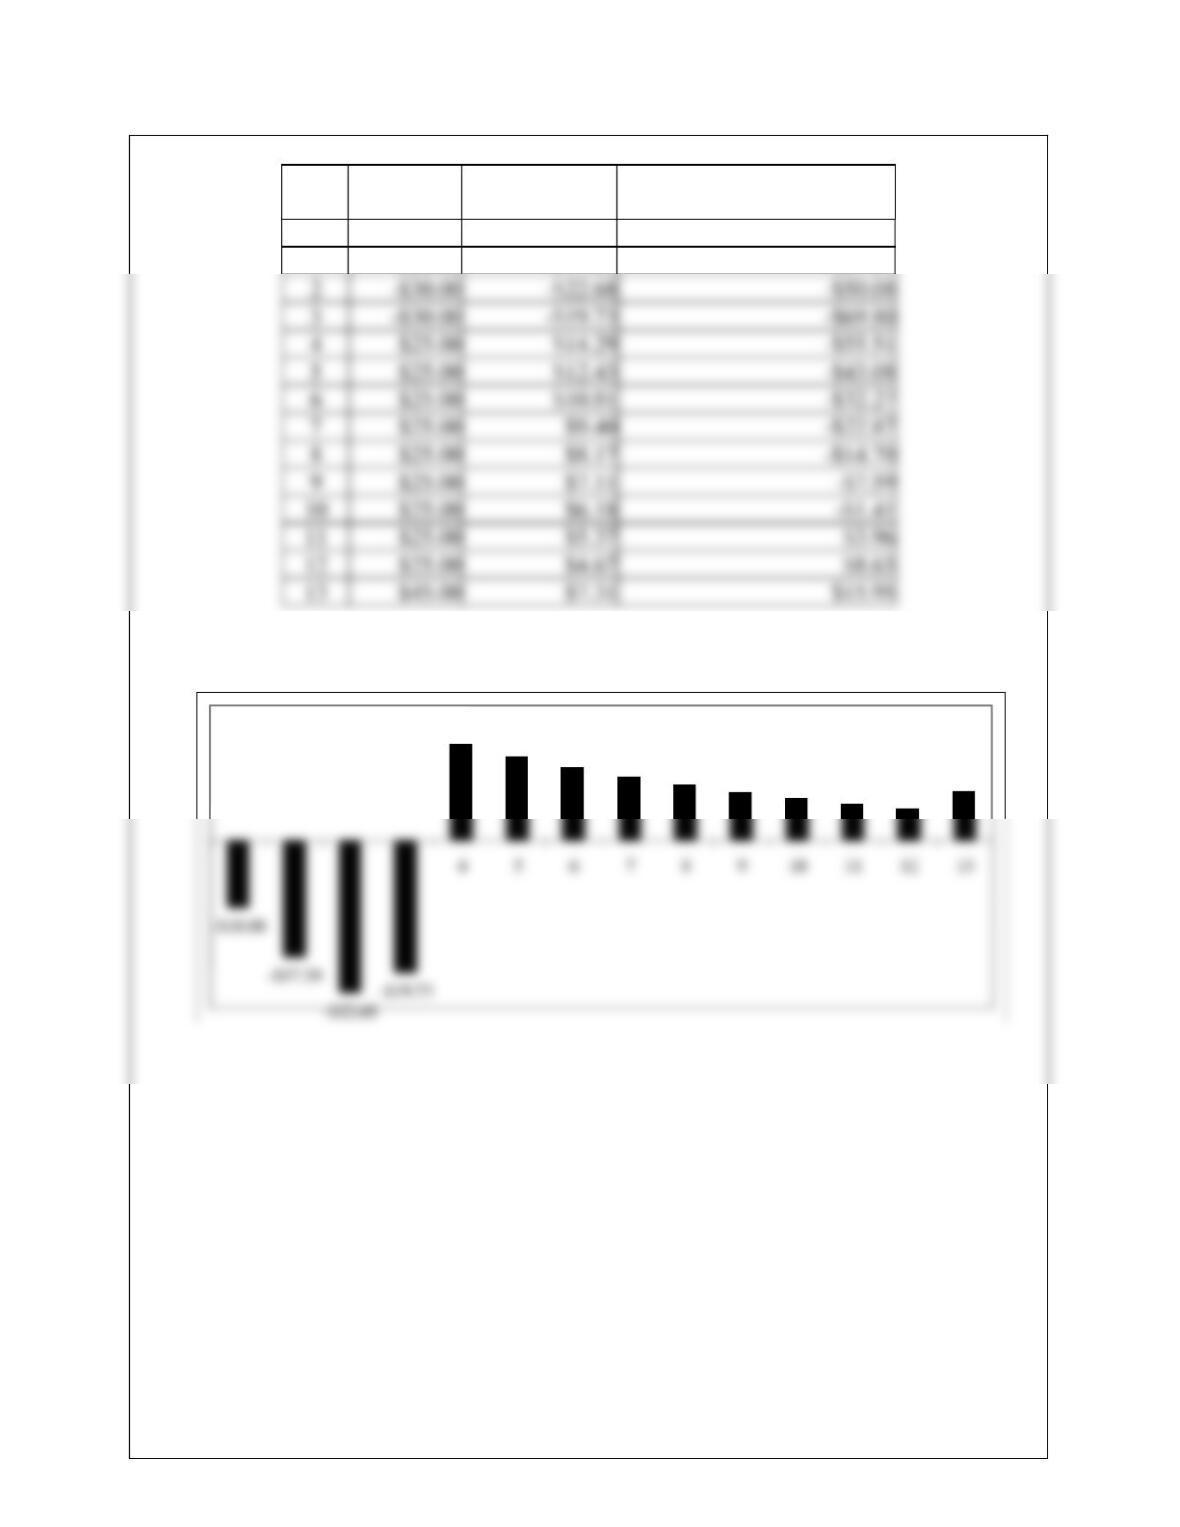
9.33
Year Cash Flow
Discounted
Cash Flow
Cumulative, Discounted
Cash Flow
0 -$10.00 -$10.00
-$10.00
1 -$20.00 -$17.39
-$27.39
(a)
$14.29 $12.43 $10.81 $9.40 $8.17 $7.11 $6.18 $5.37 $4.67
$7.31
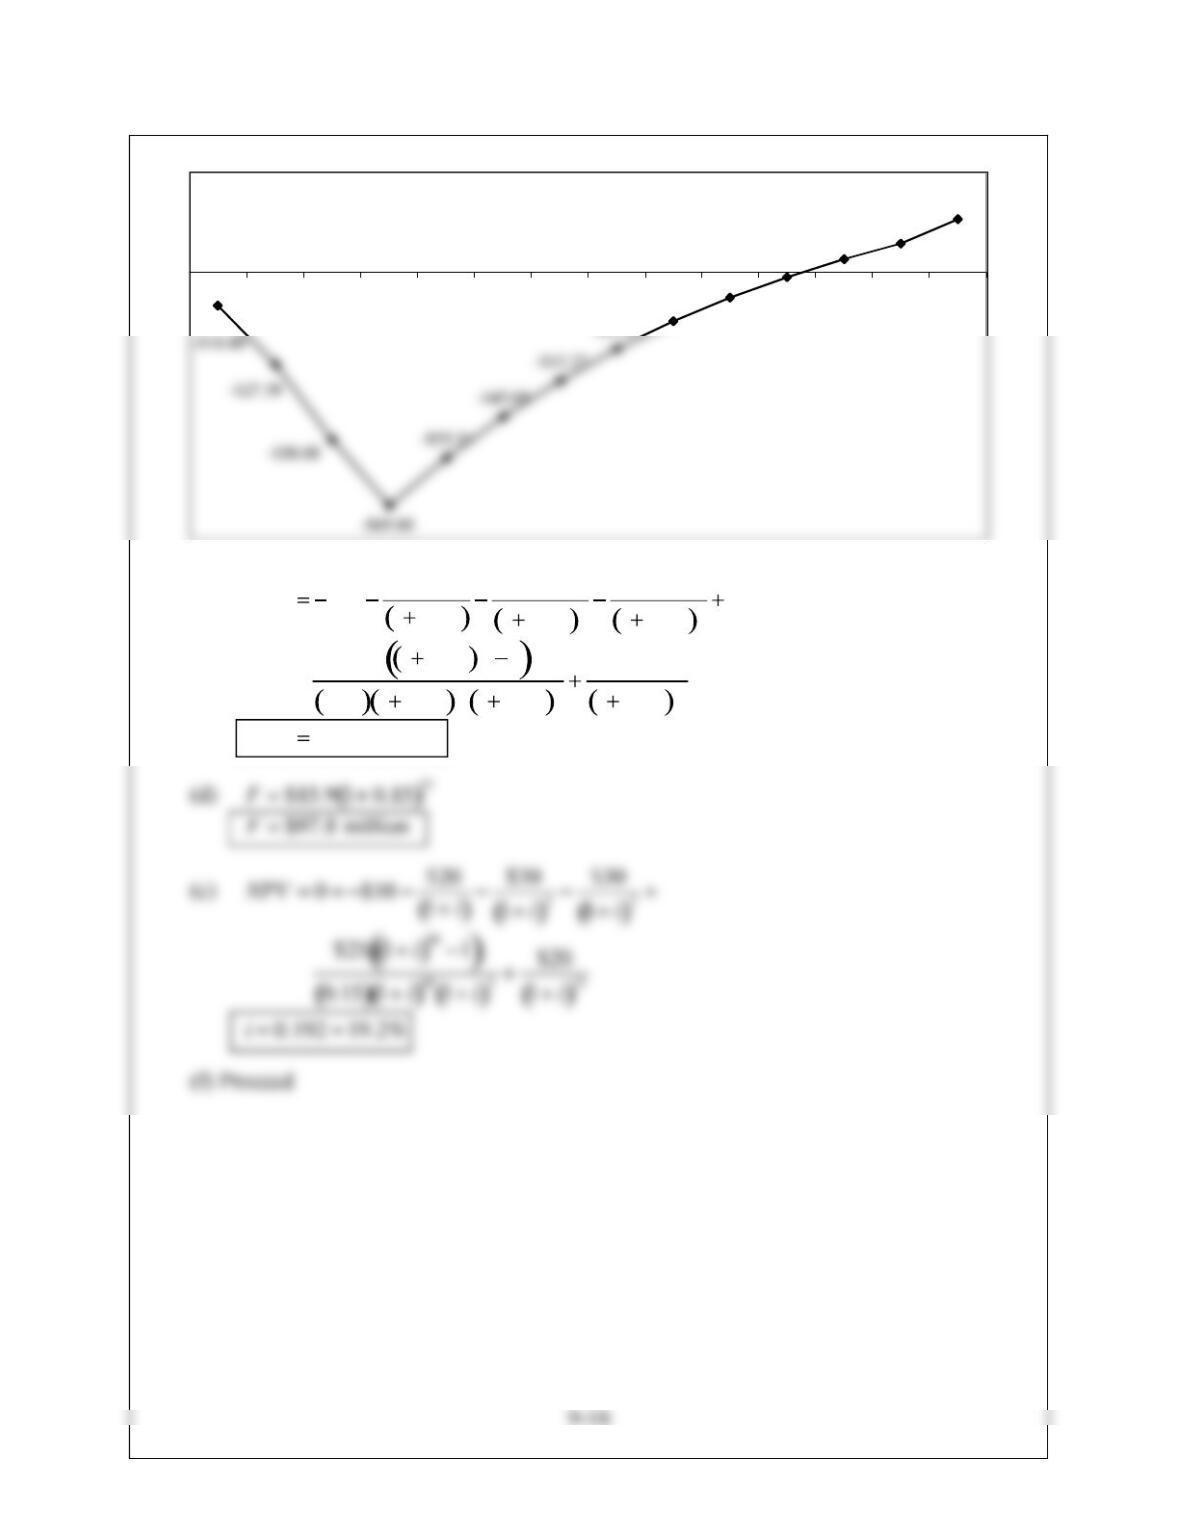
(b)
-$14.70
-$7.59
-$1.41
$3.96 $8.63
$15.95
0 1 2 3 4 5 6 7 8 9 10 11 12 13
(c) NPV $10 $20
1 0.15
$30
1 0.15 2
$30
1 0.15 3
$25 1 0.15 10 1
0.15 1 0.15 10 1 0.15 3
$20
10.15 13
NP
V
$15.9 million
9-17
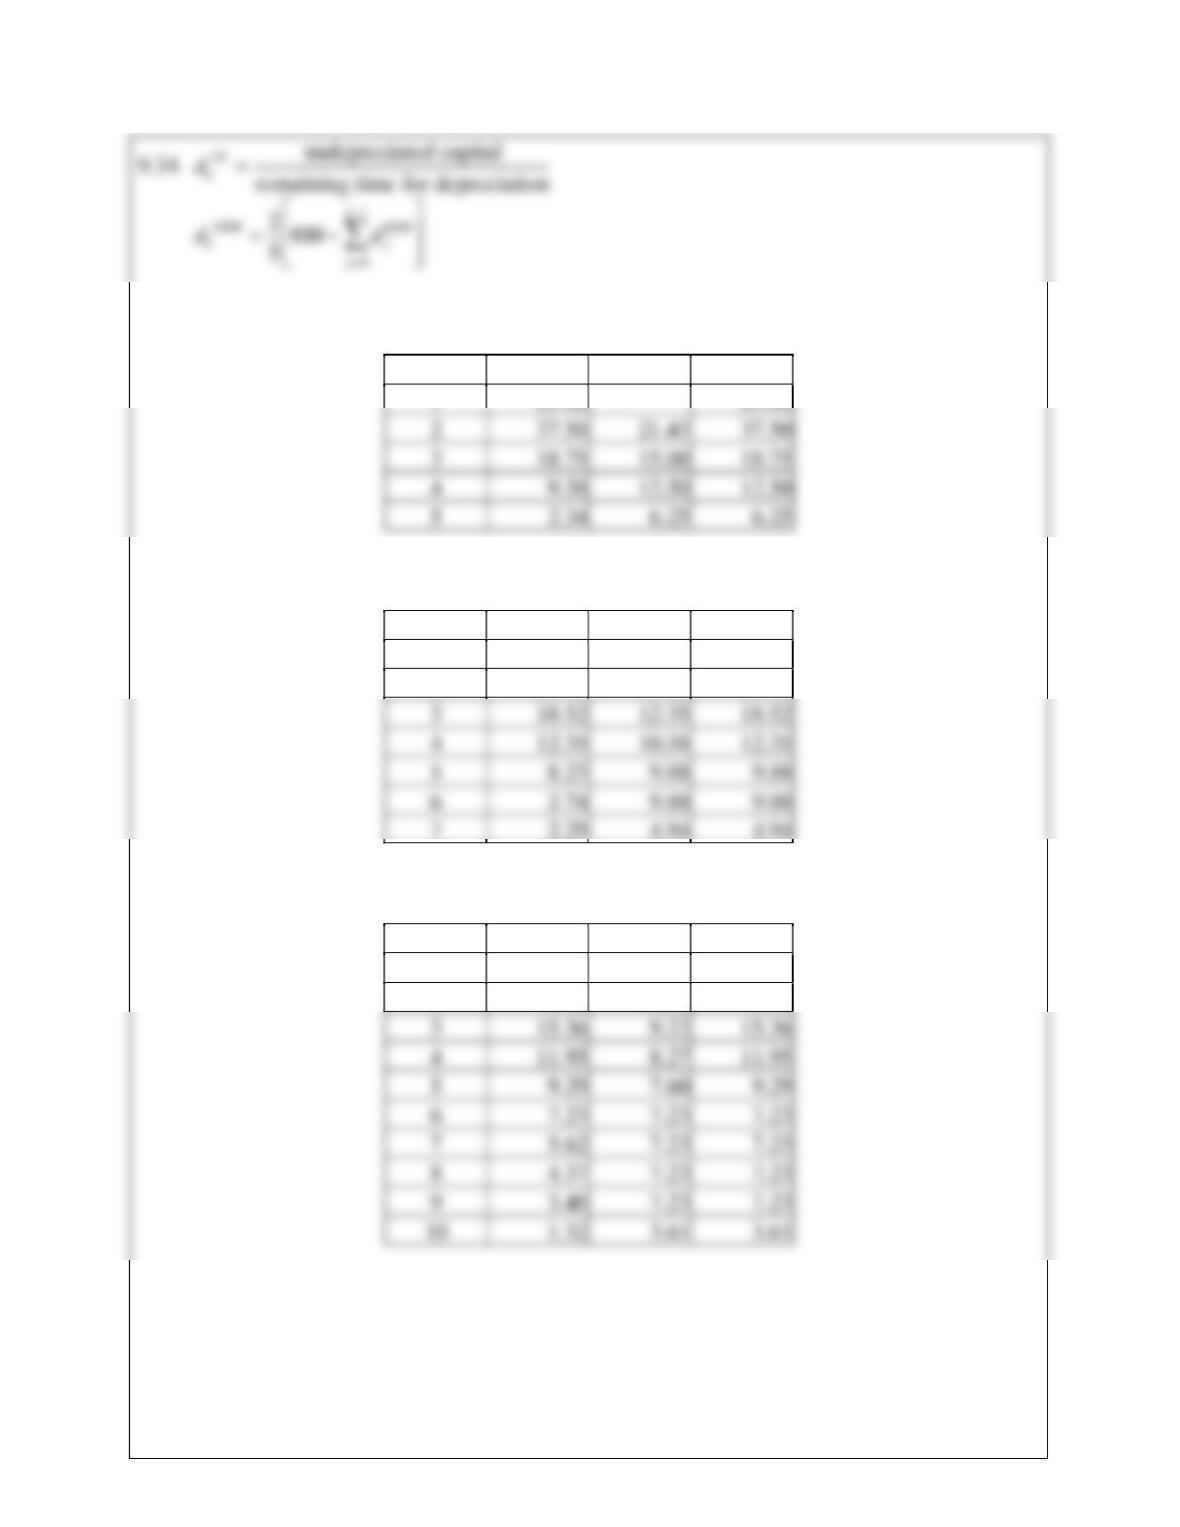
Four Year
Year DDB SL MACRS
Six Year
Year DDB SL MACRS
1 16.67
16.67
2 27.78
15.15 27.78
Nine Year
Year DDB SL MACRS
1 11.11
11.11
2 19.75
10.46 19.75
9.35
(a)
$75
9-19
9-20
(e)
(f)
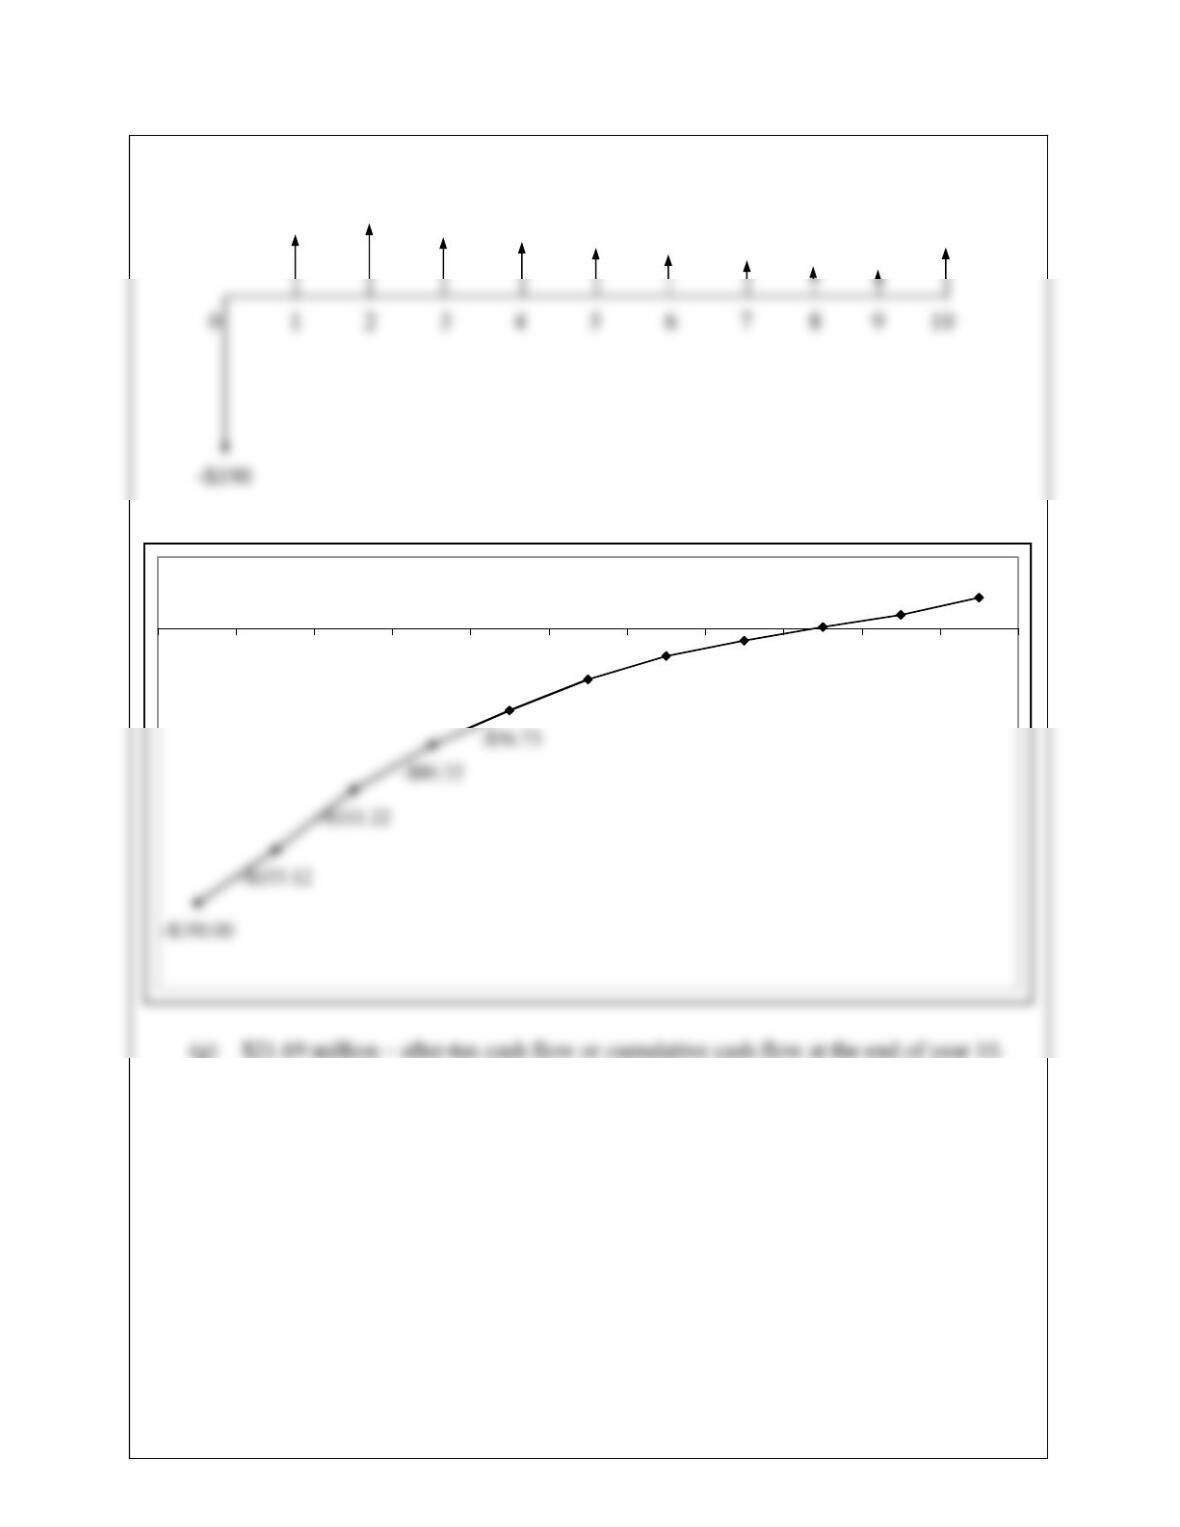
-$35.11
-$19.01 -$8.22
$1.25 $9.55 $21.69
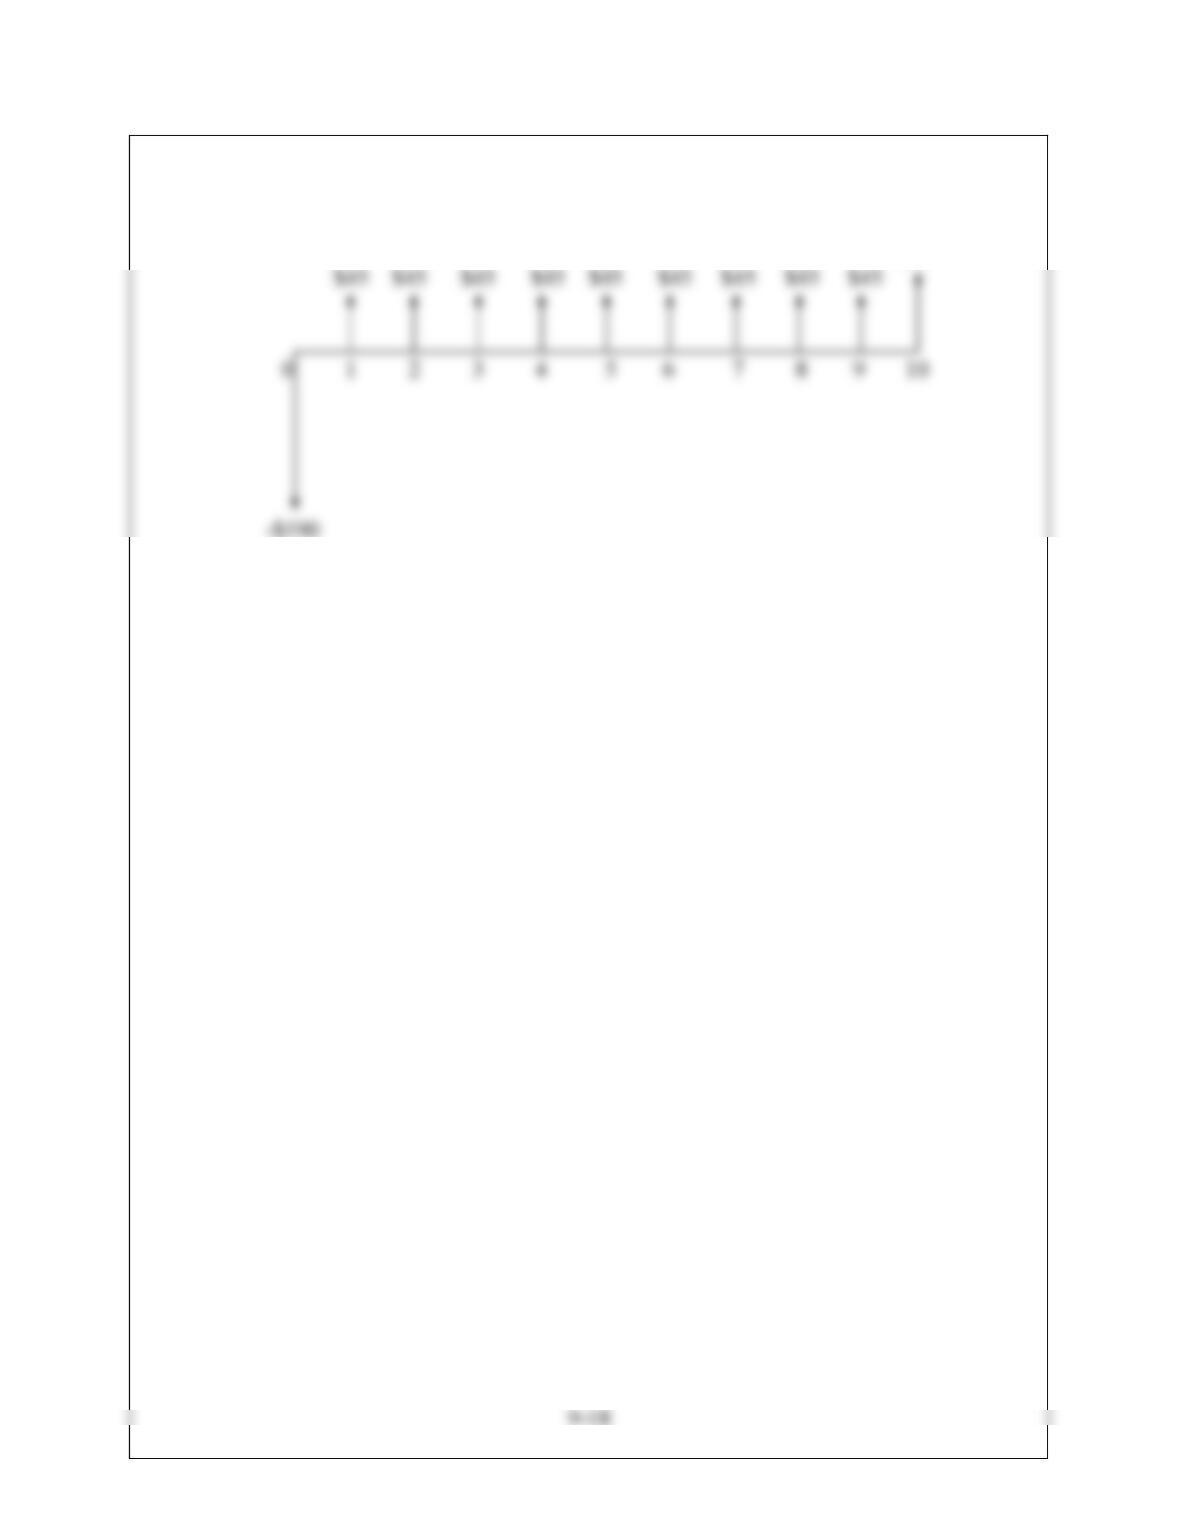
0 1 2 3 4 5 6 7 8 9 10
$36.88 $41.90 $30.90 $23.59 $21.63 $16.10 $10.79 $9.47 $8.30
$12.14