3-1
Chapter 3
3.1. What is a flowshop plant?
A flowshop plant is a plant in which several batch products are produced using all or a sub-
3.2. What is a jobshop plant?
A flowshop plant is a plant in which several batch products are produced using all or a sub-
3.3. What are the two main methods for sequencing multiproduct processes?
3.4. Give one advantage and one disadvantage of using single-product campaigns in a
multiproduct plant.
Advantage sequencing of single-product campaigns is relatively simple and repetitive and
3.5. What is the difference between a zero-wait and a uis process?
A zero-wait process is one in which the batch is transferred immediately from the current
3.6 Number of batches of A is twice that for B or C repeat Example 3.3 with this restriction
using a 500 h cycle time.
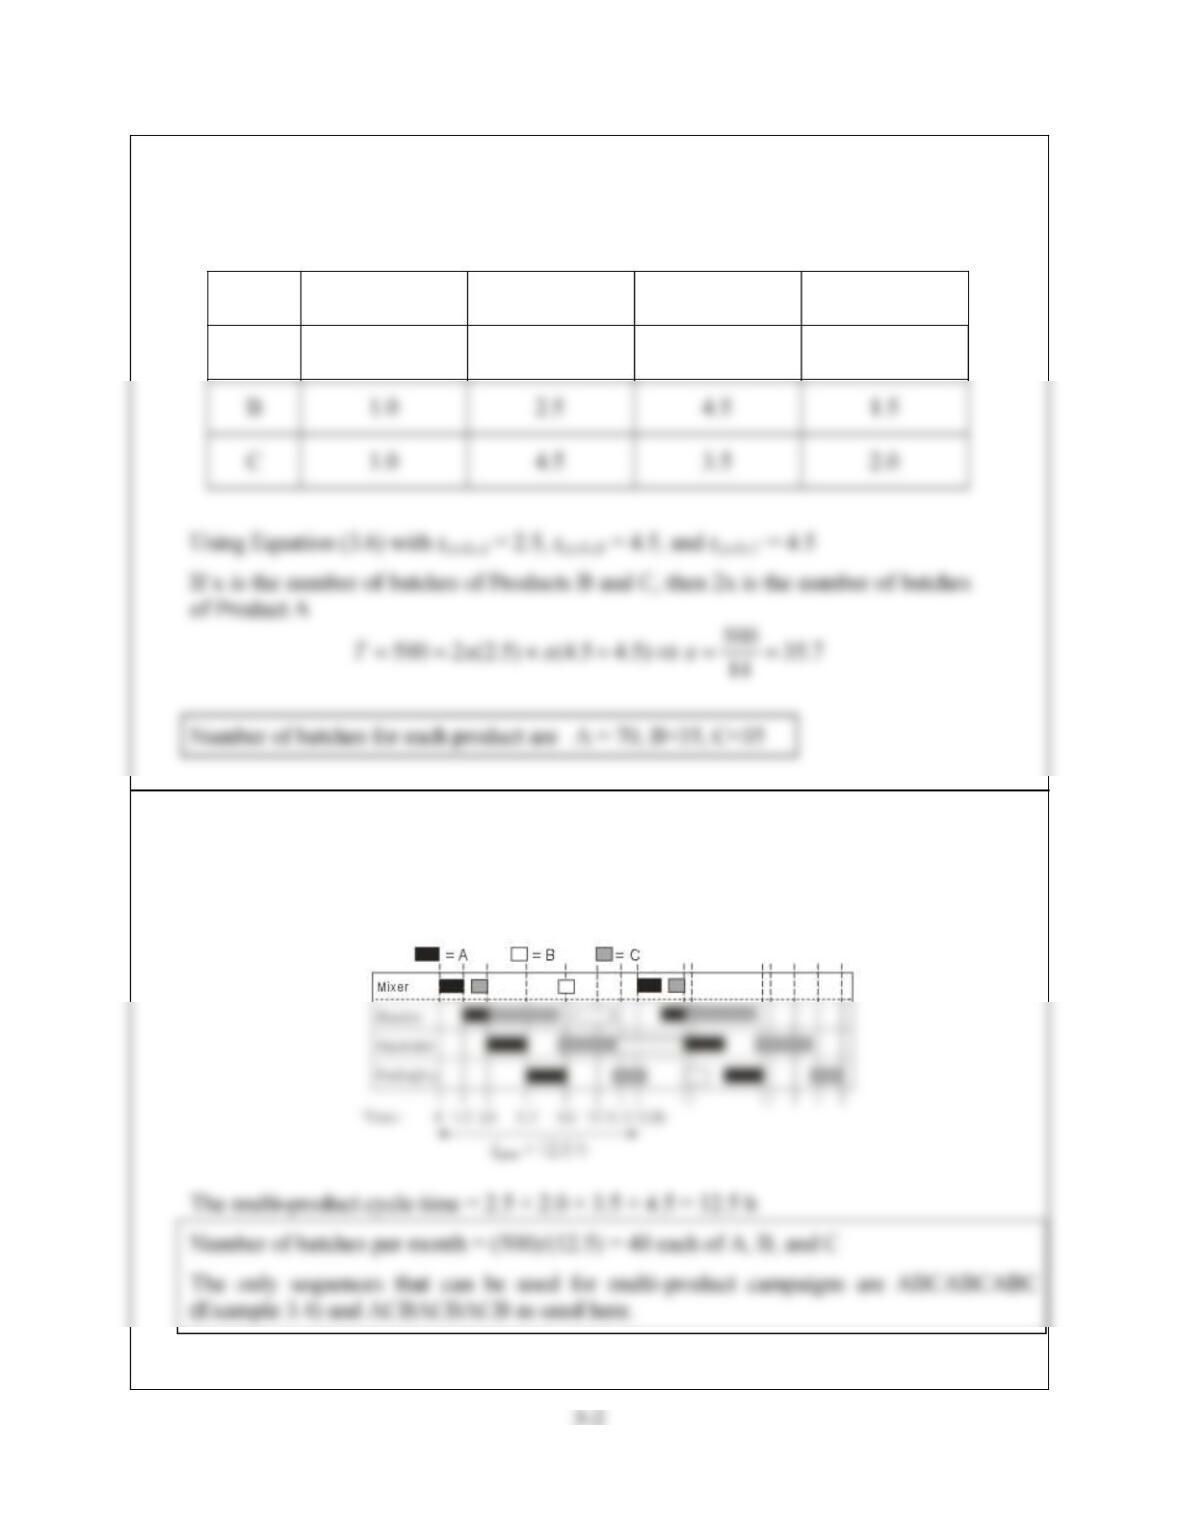
Table E3.3: Equipment times needed to produce A, B, and C
Product Time in Mixer Time in
Reactor
Time in
Separator
Time in
Packaging
A 1.5 1.5 2.5 2.5
3.7 For Examples 3.3 and 3.4, determine the number of batches that can be produced in a
month (500 h) using a multi-product campaign strategy with the sequence
ACBACBACB. Are there any other sequences for this problem other than the one used
in Example 3.4 and the one used here?
3-3
3.8 Consider the multi-product batch plant described in Table P3.8
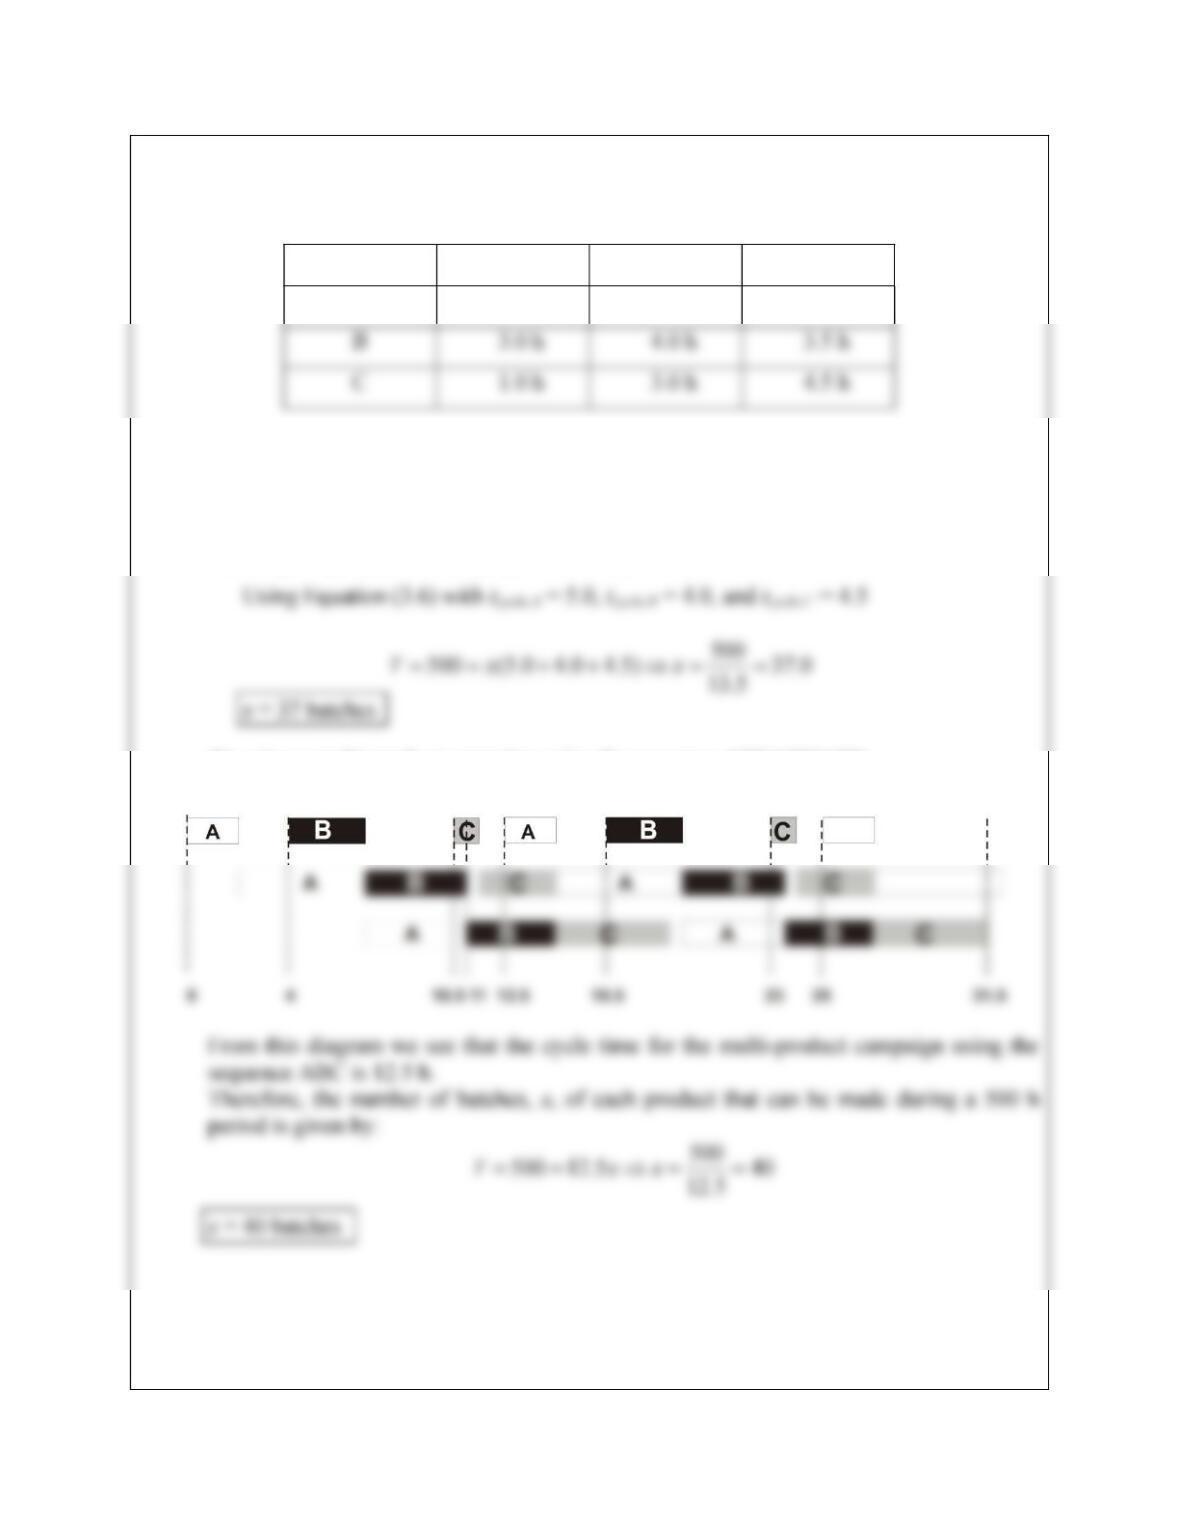
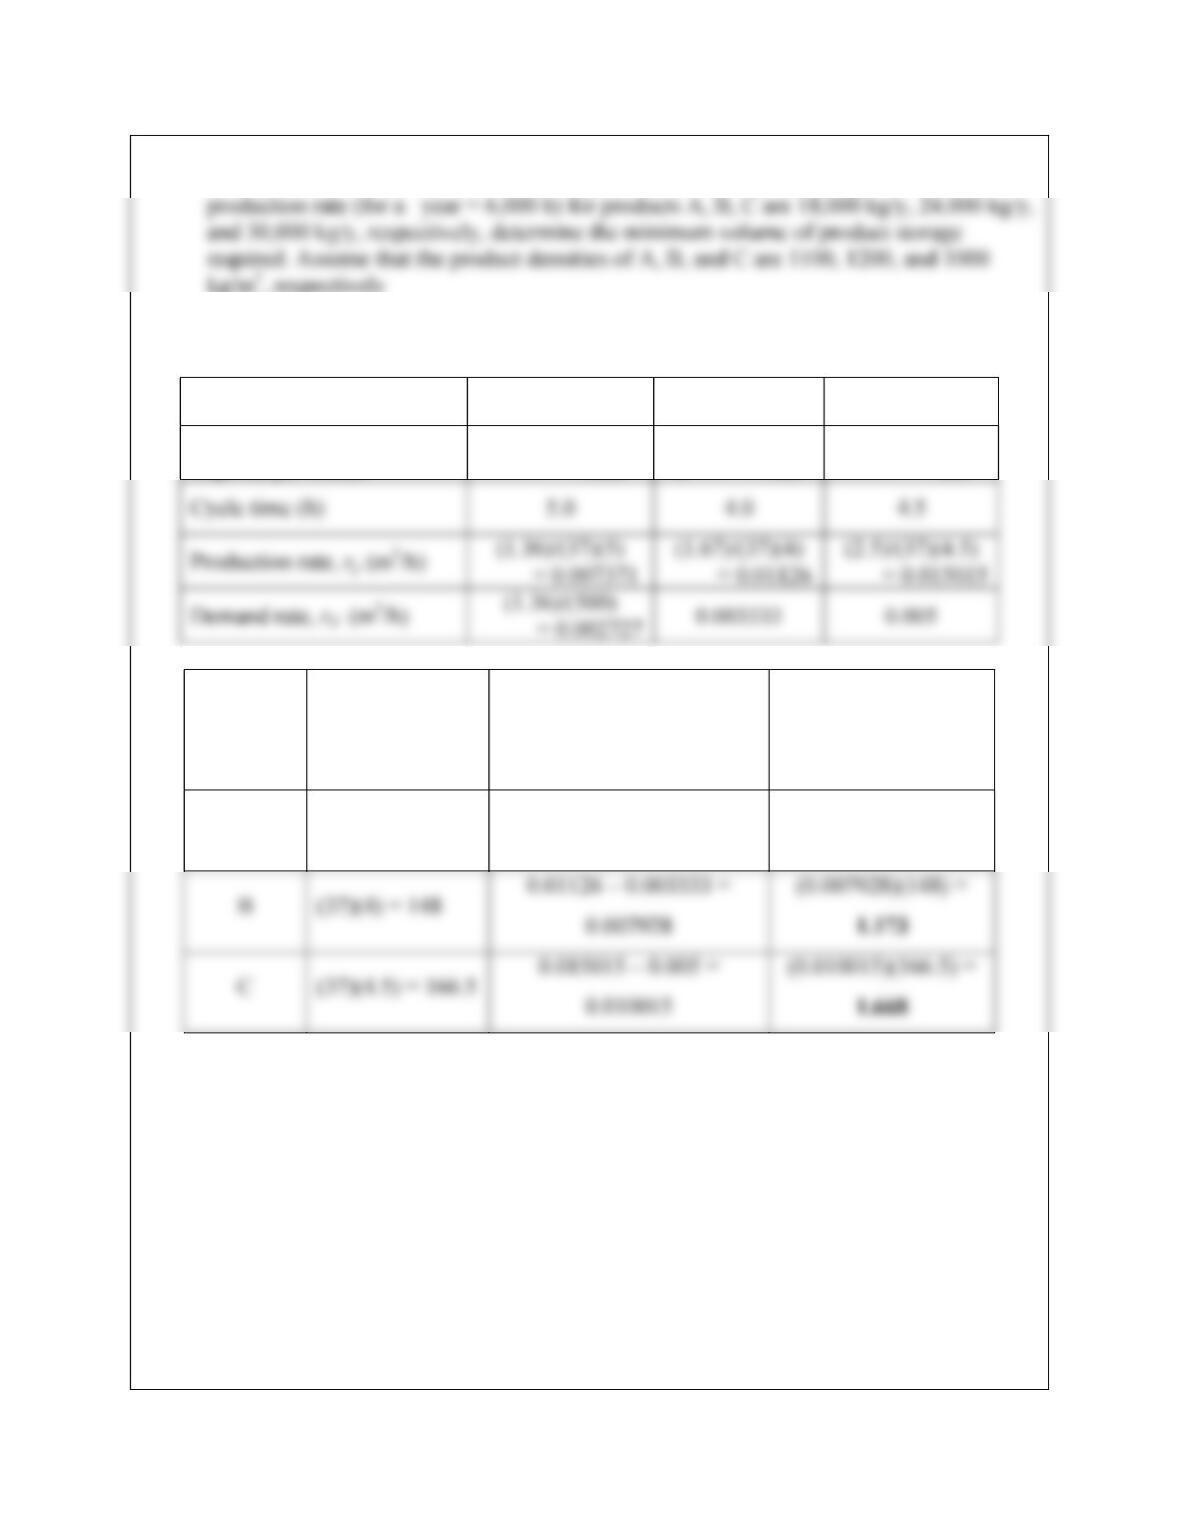
Table P3.8: Equipment Processing Times for Processes A, B, and C
Process Mixer Reactor Separator
A 2.0 h 5.0 h 4.0 h
It is required to produce the same number of batches of each product. Determine the
number of batches that can be produced in a 500 h operating period using the following
strategies:
(a) using single-product campaigns for each product
(b) using a multi-product campaign using the sequence ABCABCABC
3-4
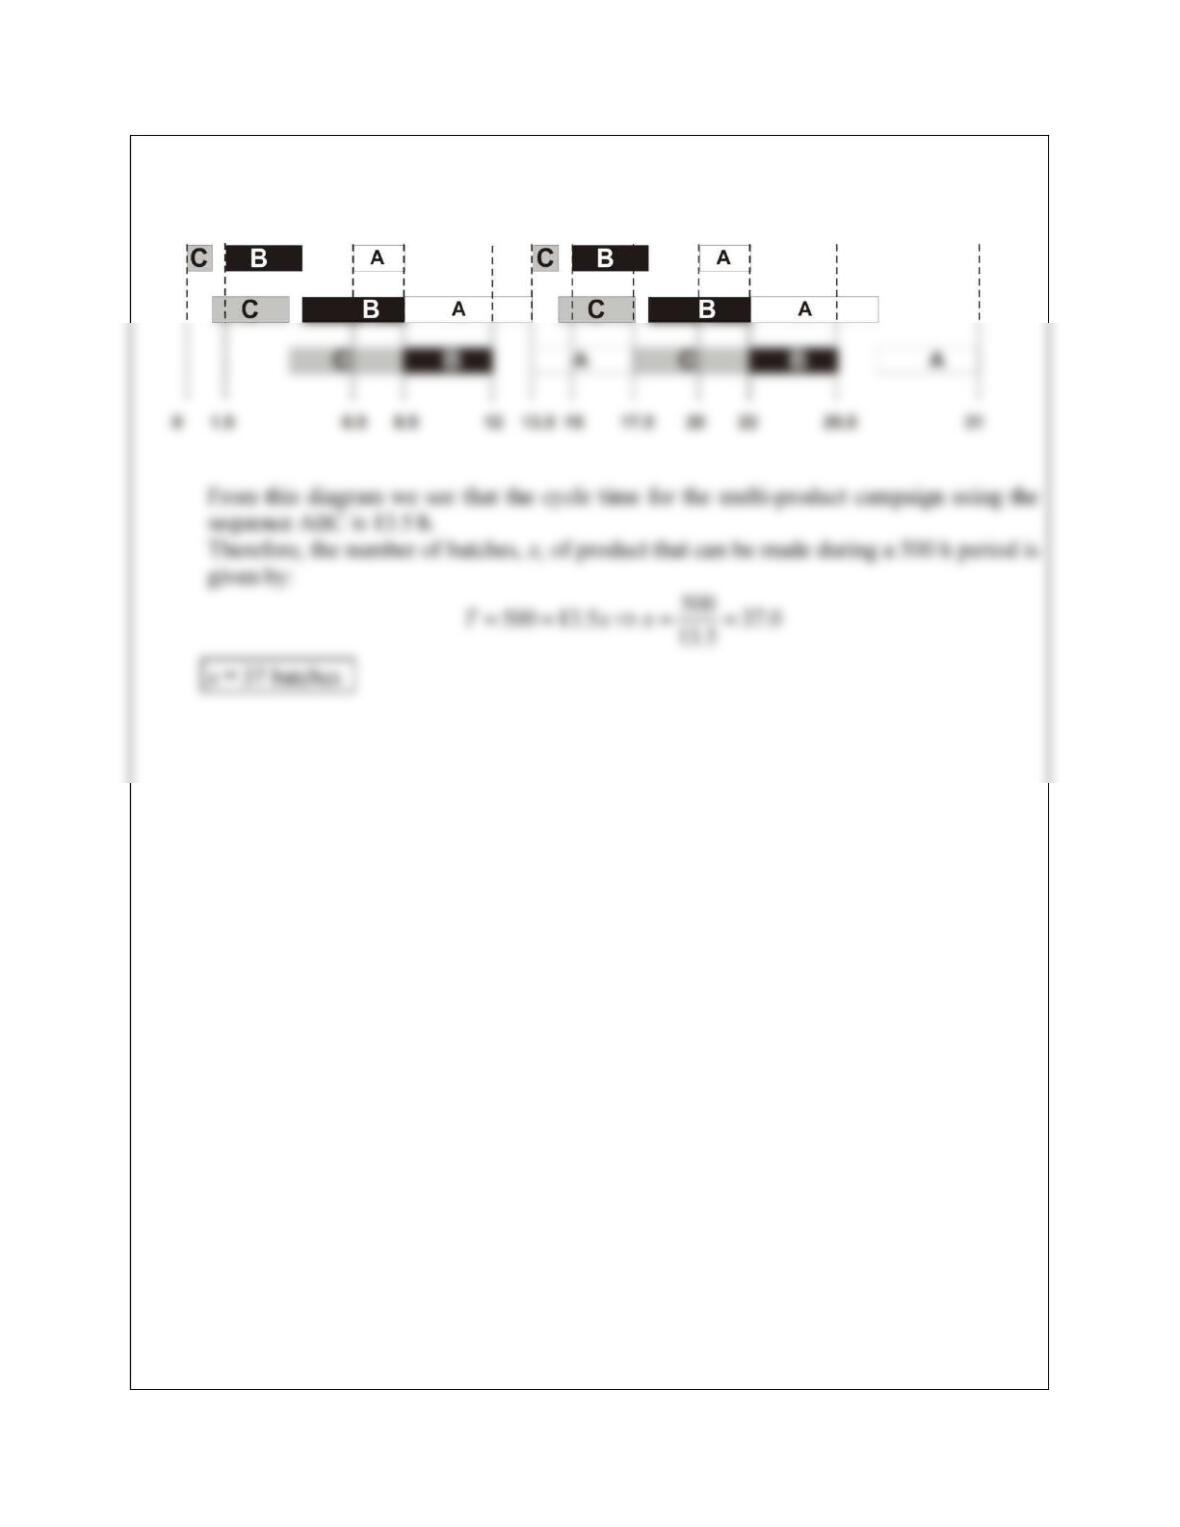
(c) using a multi-product campaign using the sequence CBACBACBA
3-5
3.9 Consider the process given in Problem 3.8. Assuming that a single-product campaign
strategy is repeated every 500 h operating period and further assuming that the
The tables below shows the results using data given from Problem 8
Rate Product A Product B Product C
Volume (m3) of product
required per month
18,000/12/1,100
= 1.36
24,000/12/1,20
0 = 1.67
30,000/12/1,000
= 2.5
Product Campaign time,
tcamp
(h)
rp-rd
(m3/h)
Minimum volume of
product storage, Vs
(m3)
A (37)(5) = 185 0.007371 0.00273 =
0.004644
(0.004644)(185) =
0.859
3-6
3.10
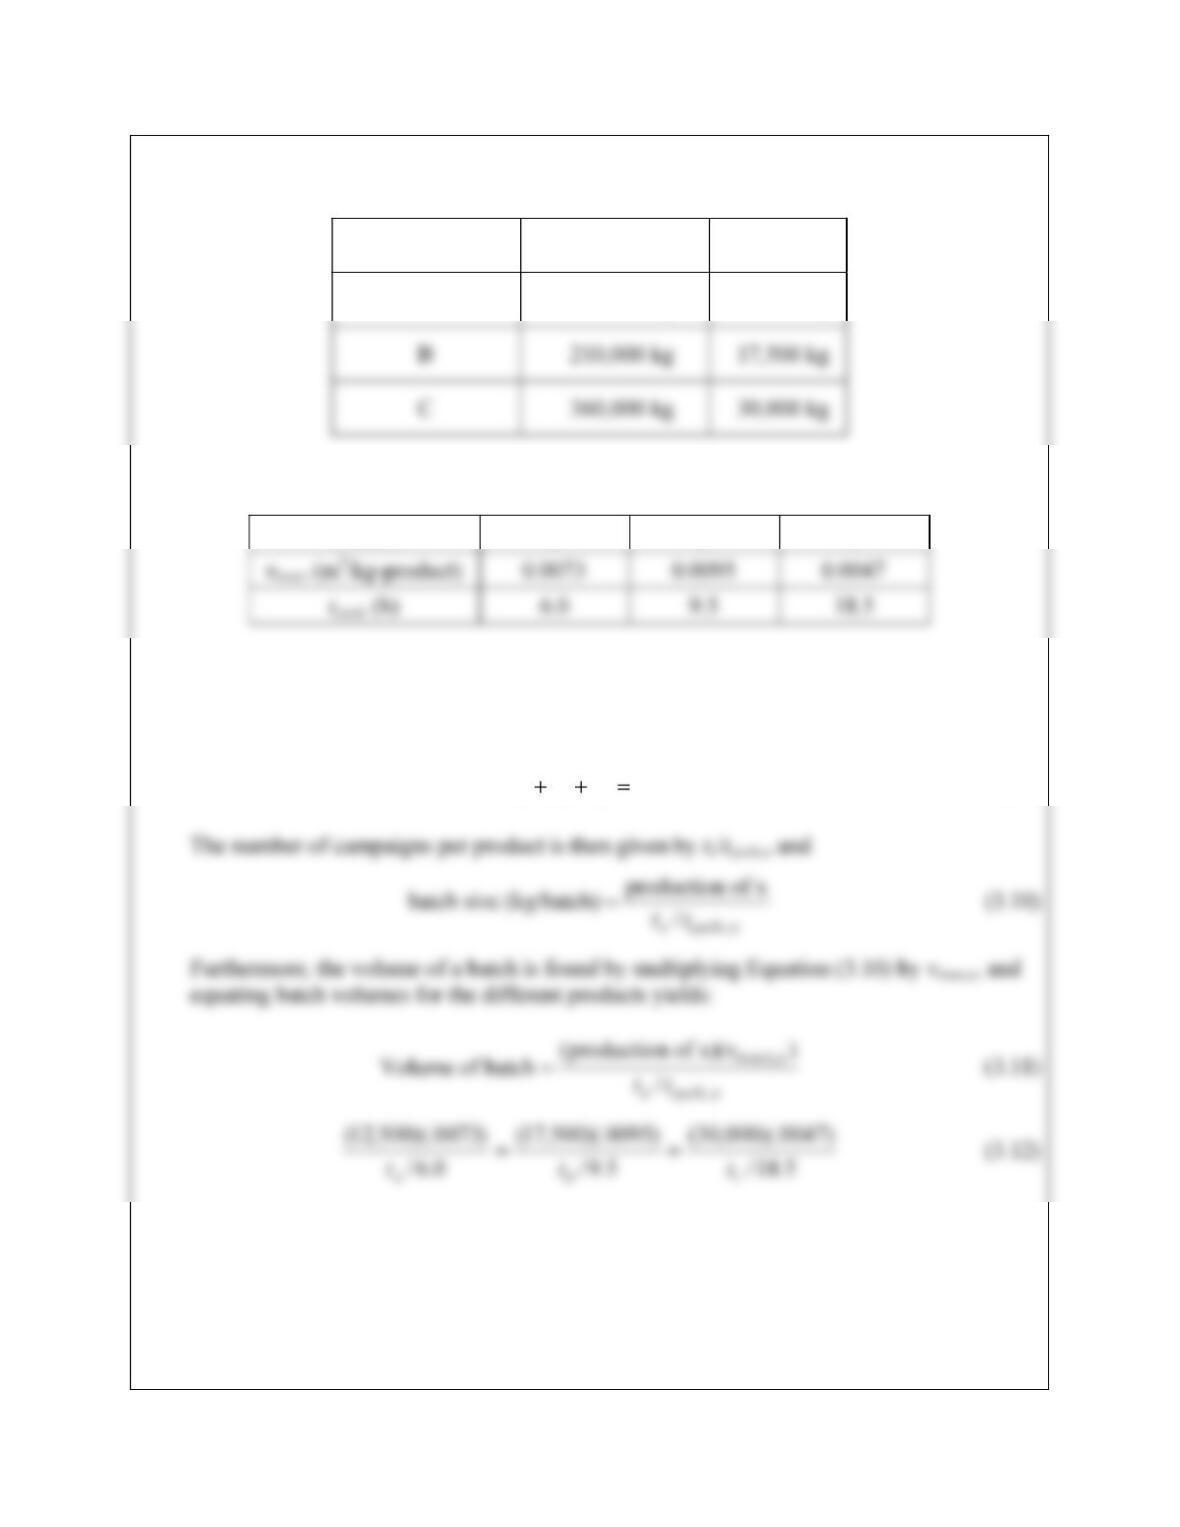
Table P3.10A: Production rates for A, B, and C
Product Yearly
production
Production
in 500 h
A 150,000 kg 12,500 kg
Table P3.10B: Specific Reactor/Mixer Volumes for Processes A, B, and C
Process A B C
Let the single-product campaign times for the three products be tA, tB, and tC, respectively.
Applying Equation (3.6), the following relationship is obtained:
500
A B C
t t t (3.9)
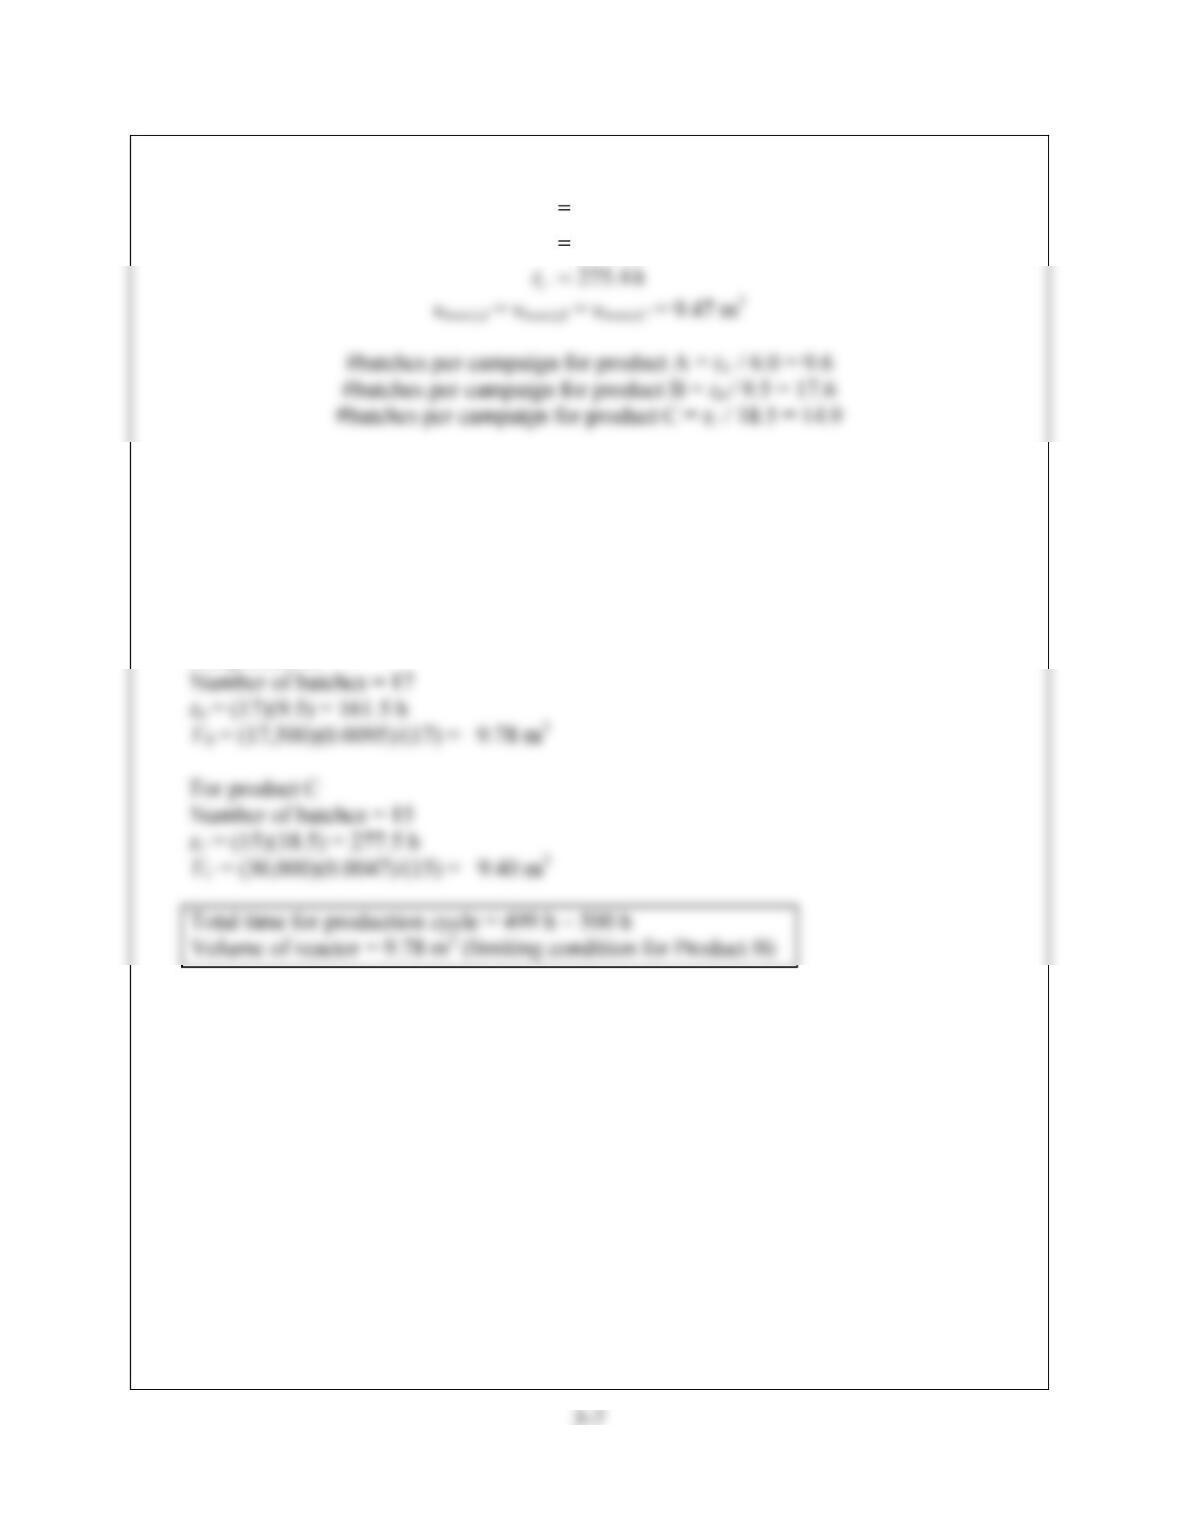
Solving Equations (3.9) and (3.12), yields:
ht
ht
B
A
8.166
8.57
Clearly the number of batches should be an integer value. Rounding these numbers yields
For product A
Number of batches = 10
tA = (10)(6.0) = 60 h
VA = (12,500)(0.0073)/(10) = 9.13 m3
For product B
3-8
3.11
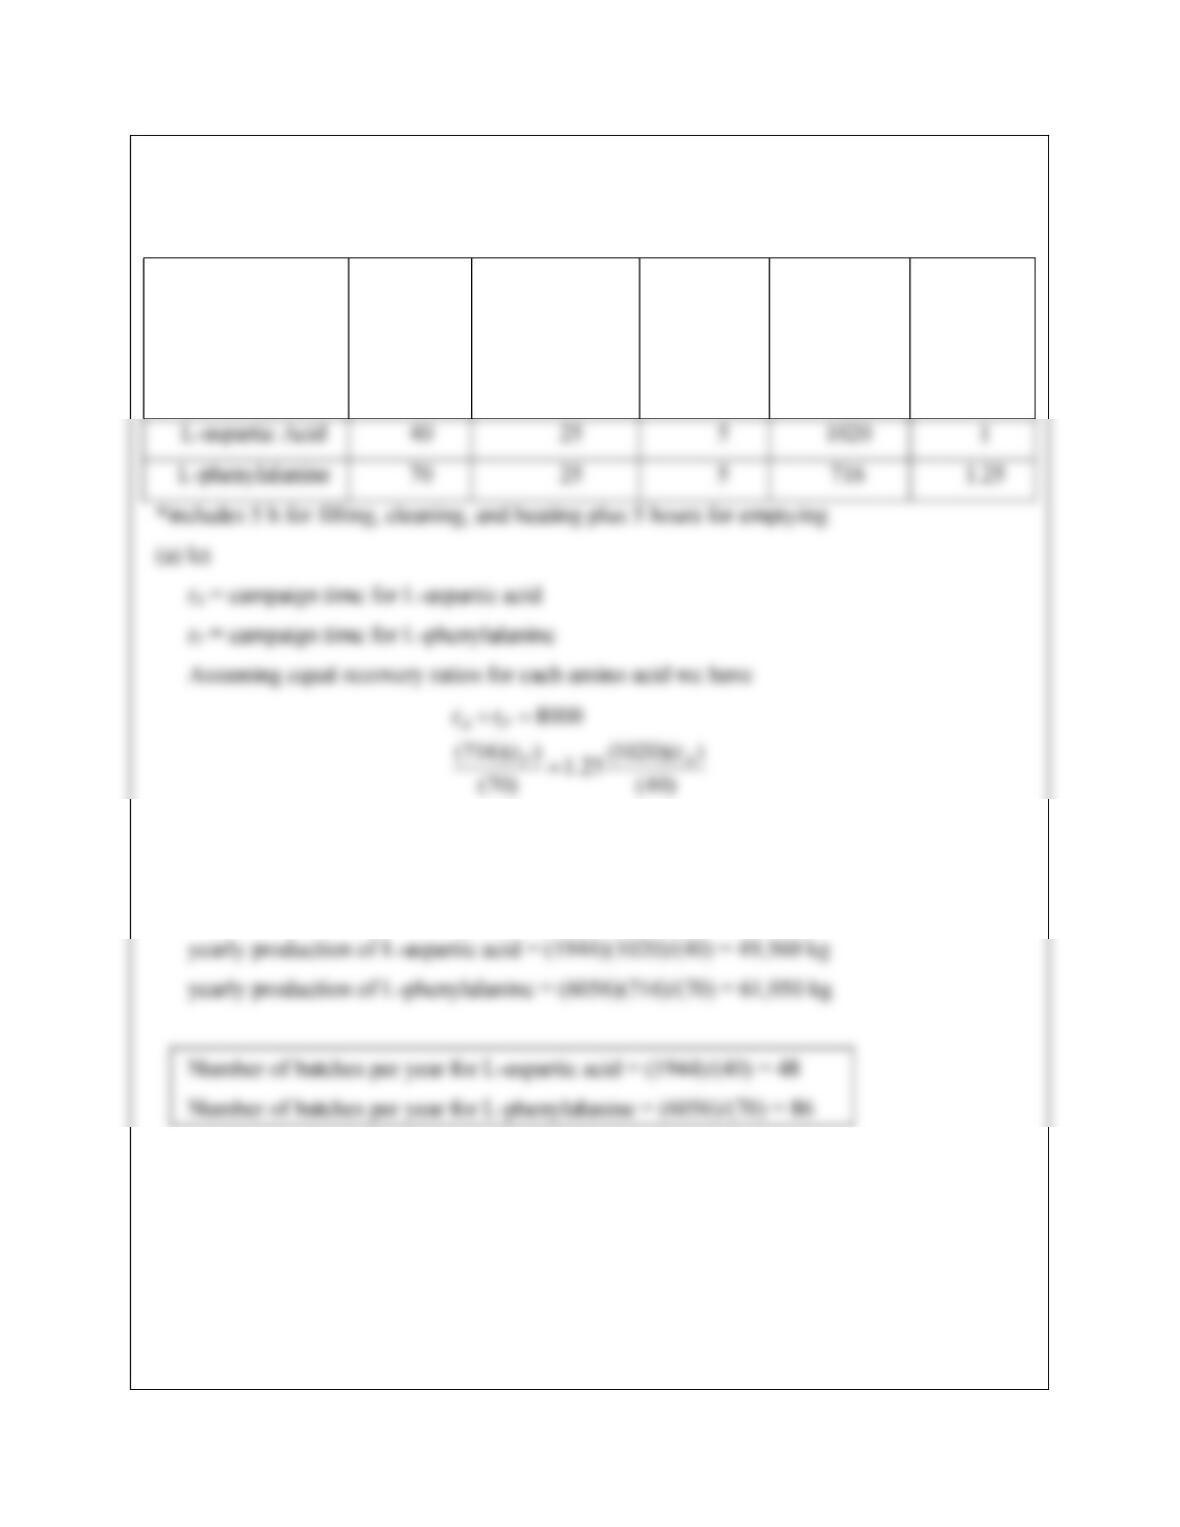
Table P3.11: Batch step times (in hours) for Reactor and Bacteria Filter for Project 8 in
Appendix B
Product Reactor*
Precoating of
Bacteria
Filter
Filtration
of
Bacteria
Mass
produced
per batch,
kg
Ratio of
product,s
Solving we get
tA = 1944 h
tP = 6056 h
(b) For each product calculate the average yearly demand and production rate in m3/h and then
find the storage needed for each product
3-9
Rate L-aspartic acid L-phenylalanine
Volume (m3) of product
required per year
(49,560)(0.9)/(1,200) =
37.17
(61,950)(0.9)/(1,200) =
46.46
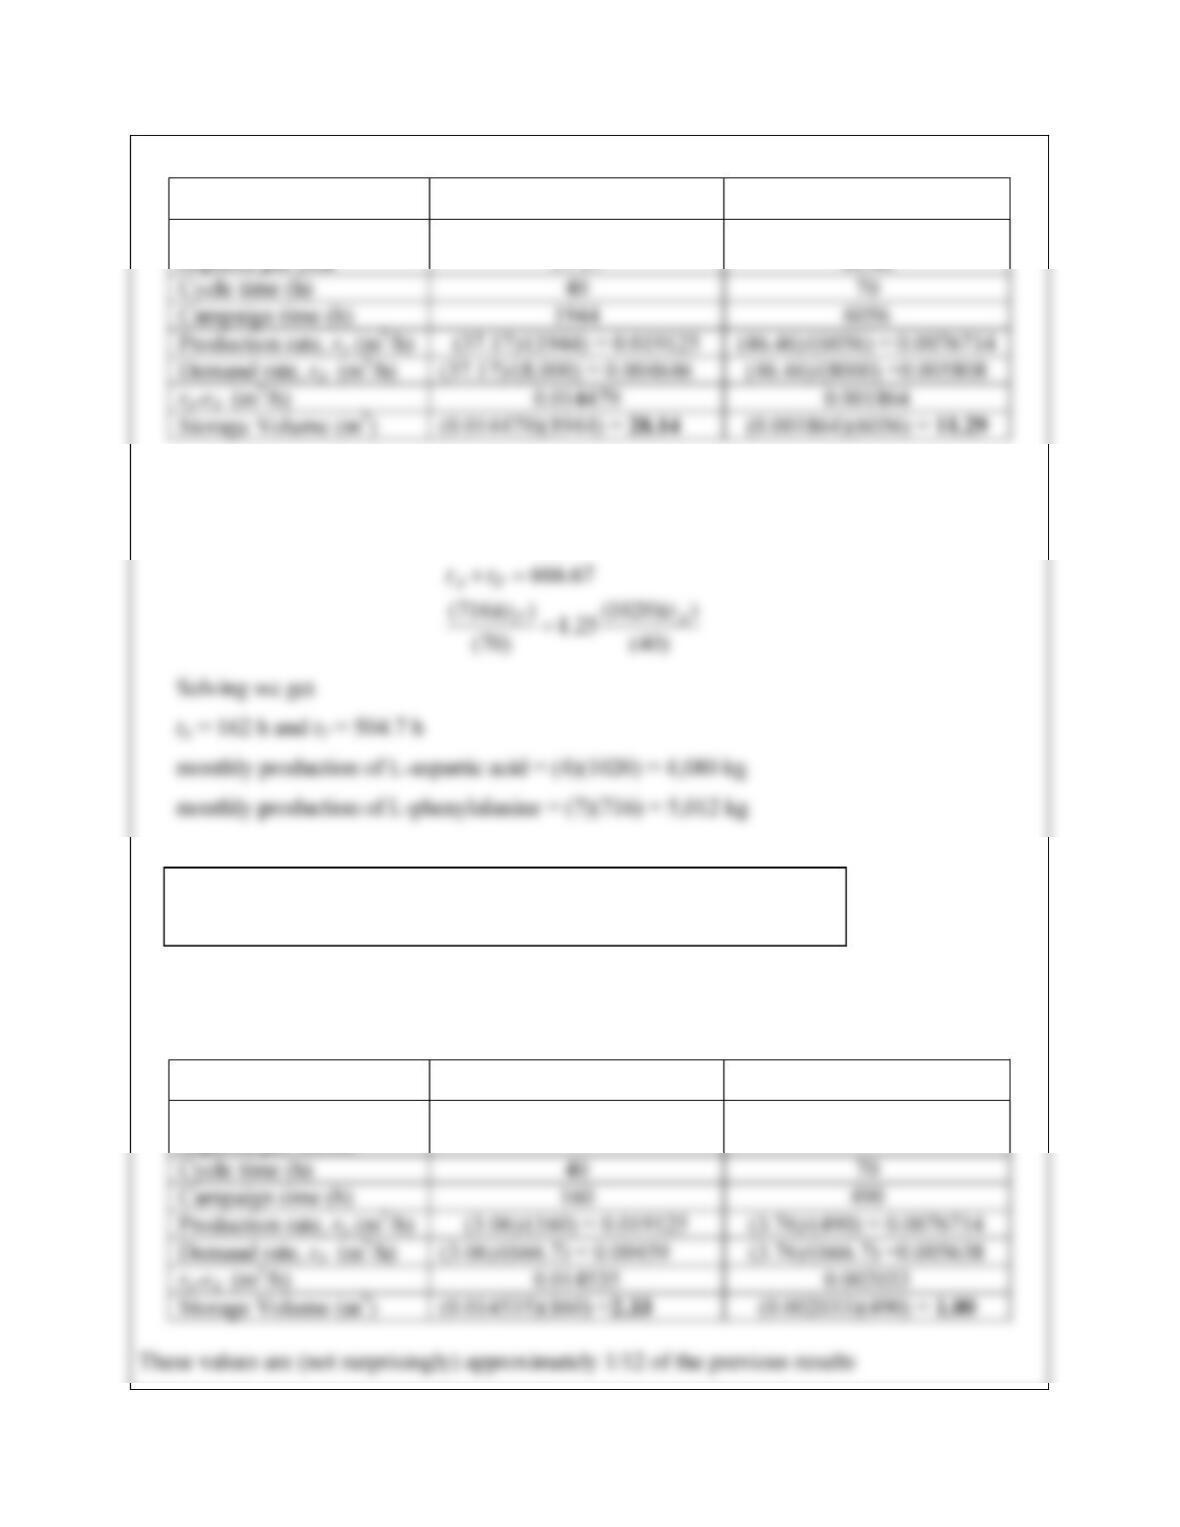
(c) Rework part (b) using a 1 month cycle time = 8,000/12 = 666.67 h
Assuming equal recovery ratios for each amino acid we have
Number of batches per month for L-aspartic acid = (162)/(40) = 4
Number of batches per month for L-phenylalanine = (504.7)/(70) = 7
Note that these are rounded down so that integer numbers are given per month this gives rise
to a slightly lower production rate per year than before.
Rate L-aspartic acid L-phenylalanine
Volume (m3) of product
required per month (4,080)(0.9)/(1,200) = 3.06 (5,012)(0.9)/(1,200) = 3.76
3-10
3.12
(a) Referring to Project B.8, Figures B.8.2 and B.8.3 and using batch reaction times for L-
aspartic acid and L-phenylalanine of 25 and 55 h, respectively. We get the following
information:
Product Reactor*
Precoating
of Bacteria
Filter
Filtration
of Bacteria
Mass produced
per batch, kg
Ratio of
products
let
tA = campaign time for L-aspartic acid
Solving we get
tA = 1776 h
tP = 6224 h
3-11
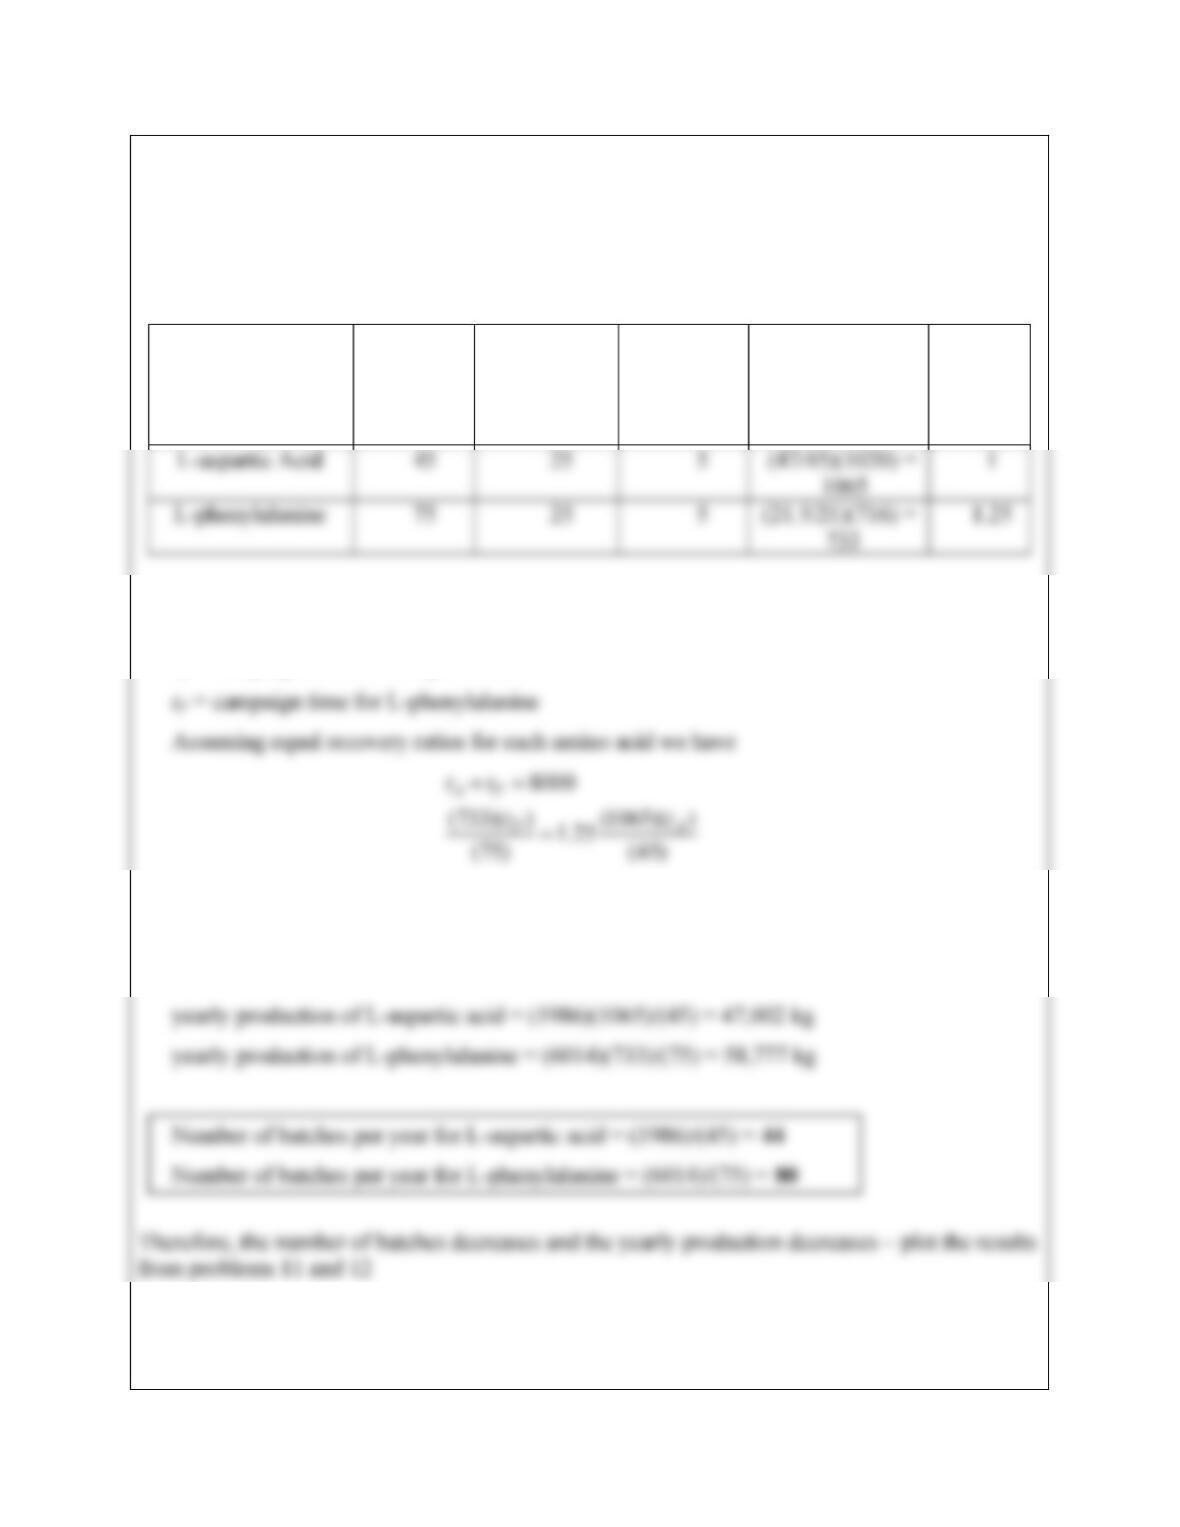
(b) Referring to Project B.8, Figures B.8.2 and B.8.3 and using batch reaction times for L-
aspartic acid and L-phenylalanine of 35 and 65 h, respectively. We get the following
information:
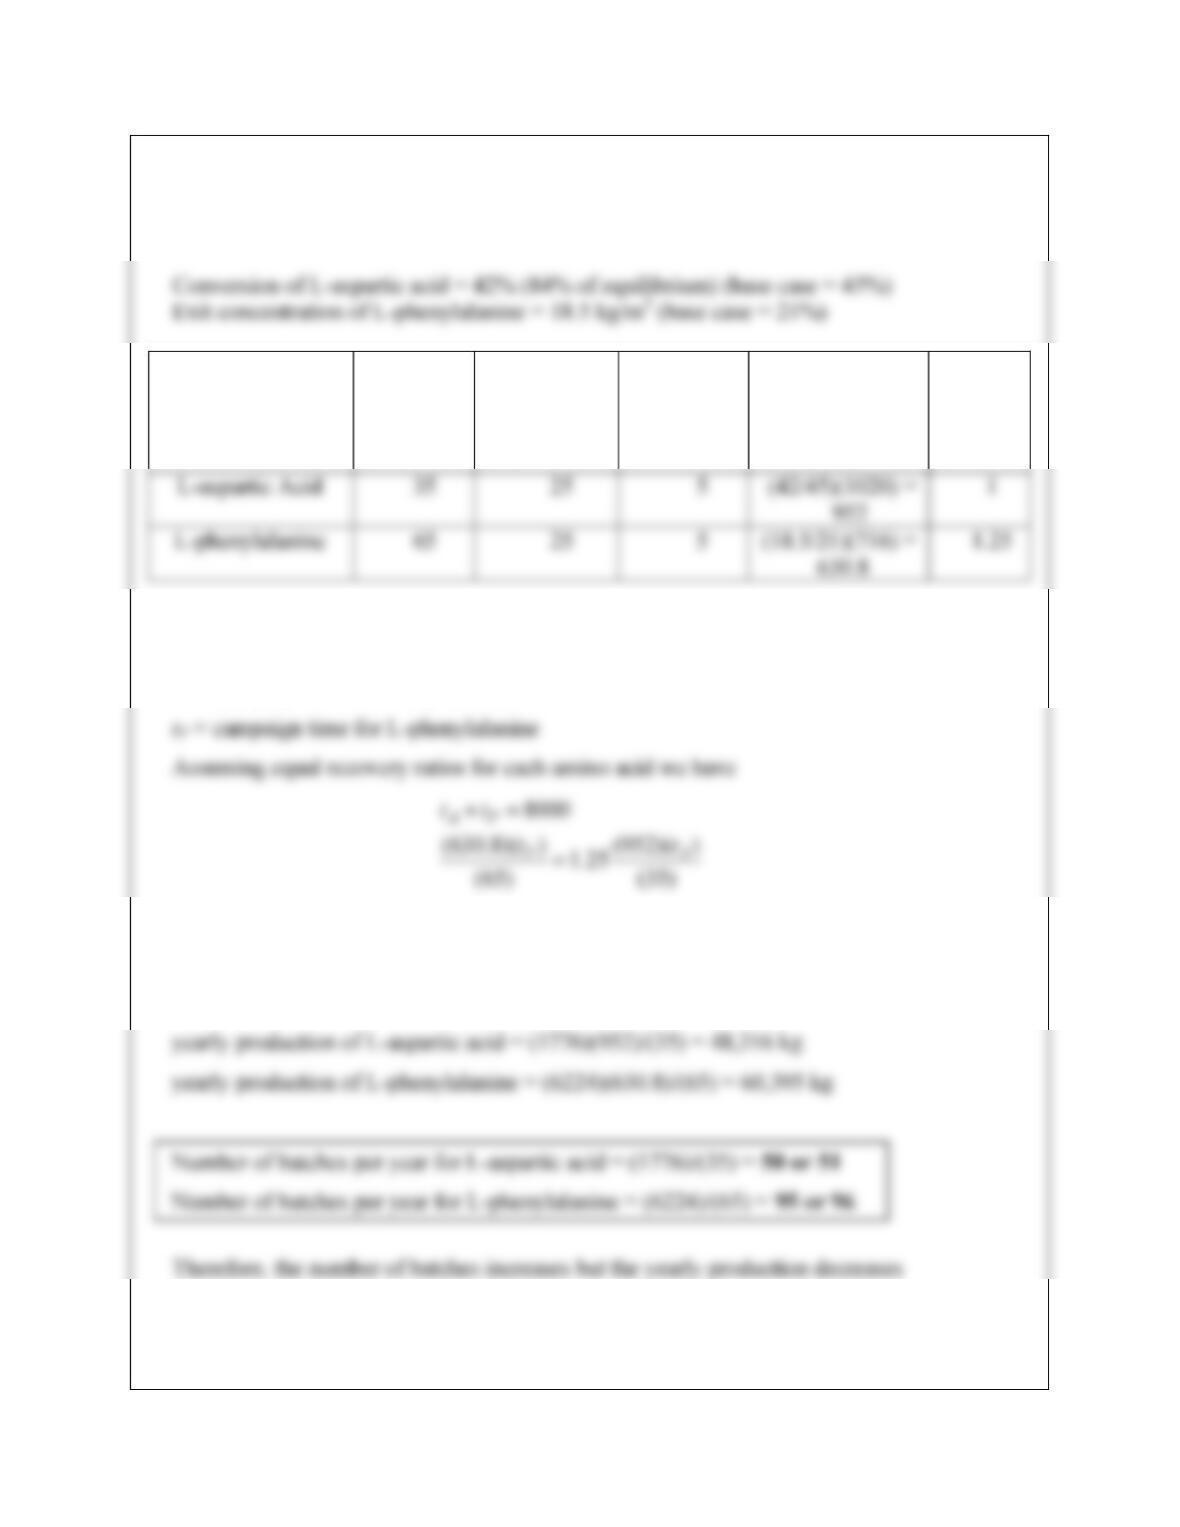
Conversion of L-aspartic acid = 47% (94% of equilibrium) (base case = 45%)
Exit concentration of L-phenylalanine = 21.5 kg/m3 (base case = 21%)
Product Reactor*
Precoating
of Bacteria
Filter
Filtration
of Bacteria
Mass produced
per batch, kg
Ratio of
products
let
tA = campaign time for L-aspartic acid
Solving we get
tA = 1986 h
tP = 6014 h
3-12
3-13
3.13
a. Let xbe the number of batches of A in a 600-h period.
tcycle,A = 5.0 h
b. Demand in one month of C is 180,000/12 = 15,000 kg/month
c. Crystallizer is limiting piece of equipment
3-14
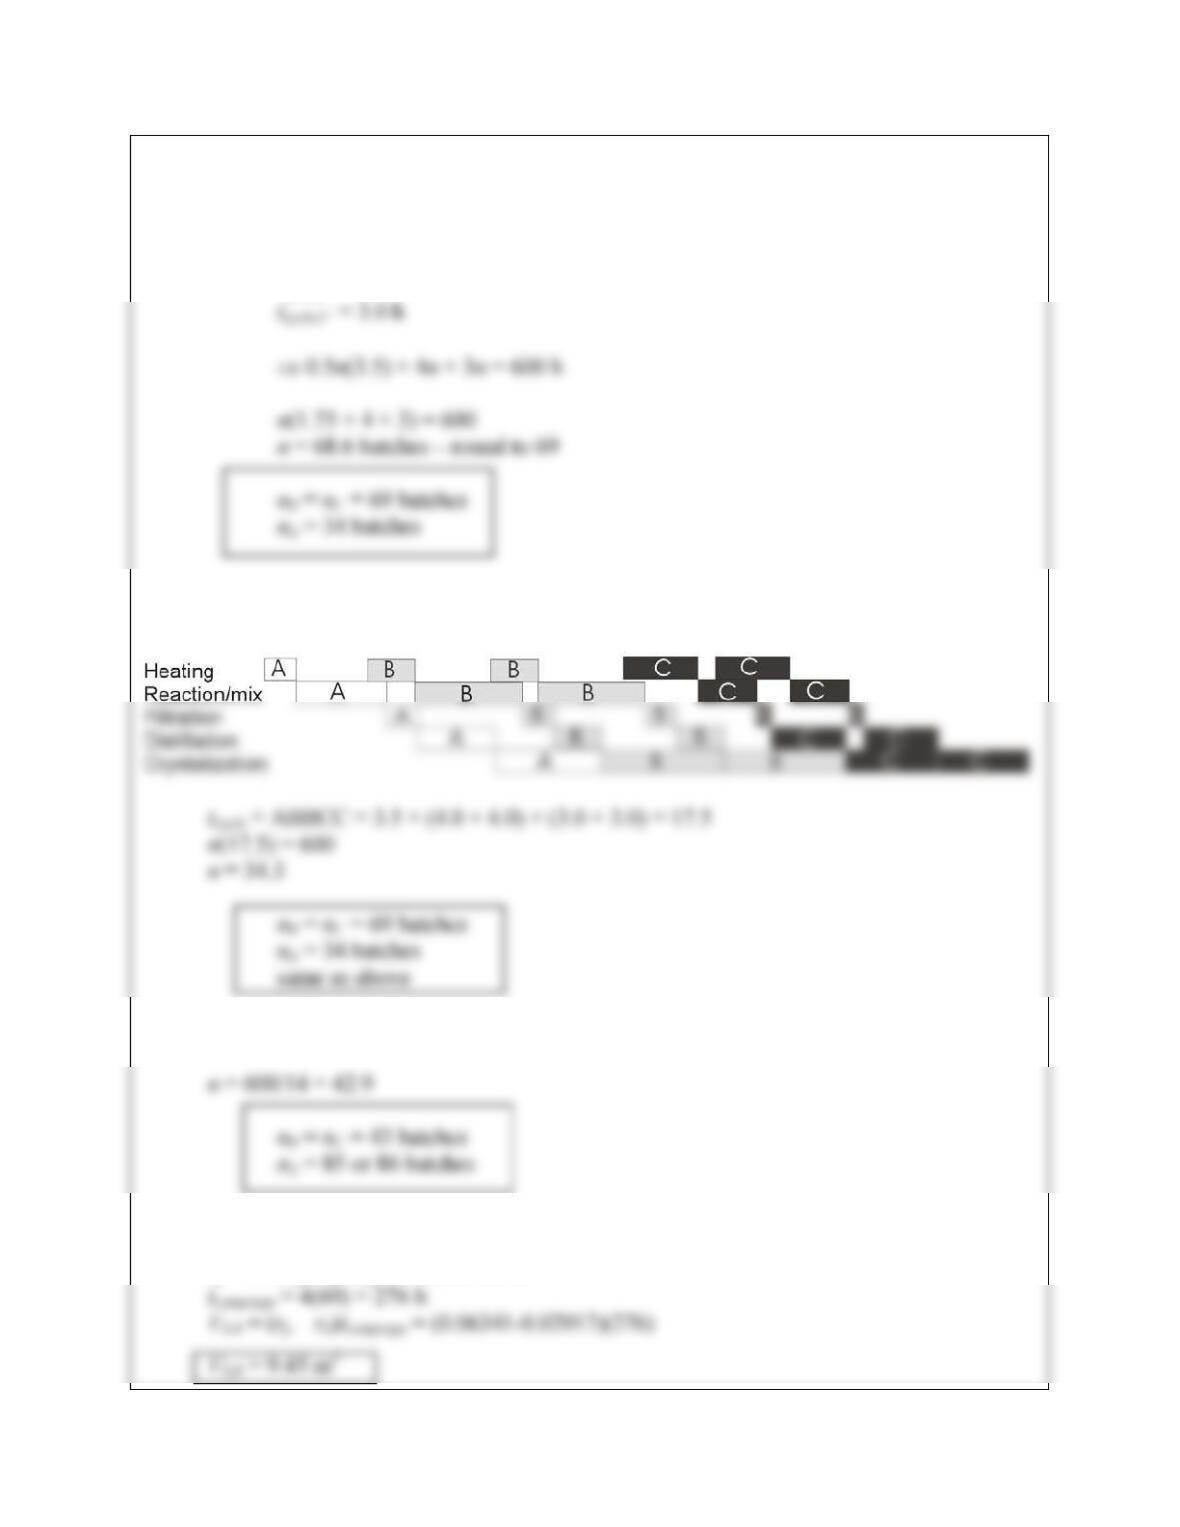
3.14
a. nB = nC =2nA = n
tcycle,A = 3.5 h
tcycle,B = 4.0 h
b. ABBCCABBCC as shown on figure – crystallizer is limiting
c. 2n(3.5) + 4n + 3n = 600
d. rd = 17.5/600 = 0.02917 m3/h
rp = 17.5/[(4)(69)] = 0.06341 m3/h