Chapter 10
Chapter 10 (short answers)
10.1 NPV = 0 at DCFROR. So, if use hurdle rate to calculate NPV, if NPV > 0, rate of return
exceeds hurdle rate.
10.3 If improvements are proposed for a process, an incremental economic analysis uses the
10.4 Yes. There would be a difference in the operating costs, which would affect the
profitability.
10.6 Risk cannot be eliminated. Monte Carlo simulation allows the risk to be quantified and
analyzed.
10.7 Advantages include quantifying risk and thereby obtaining a more comprehensive picture
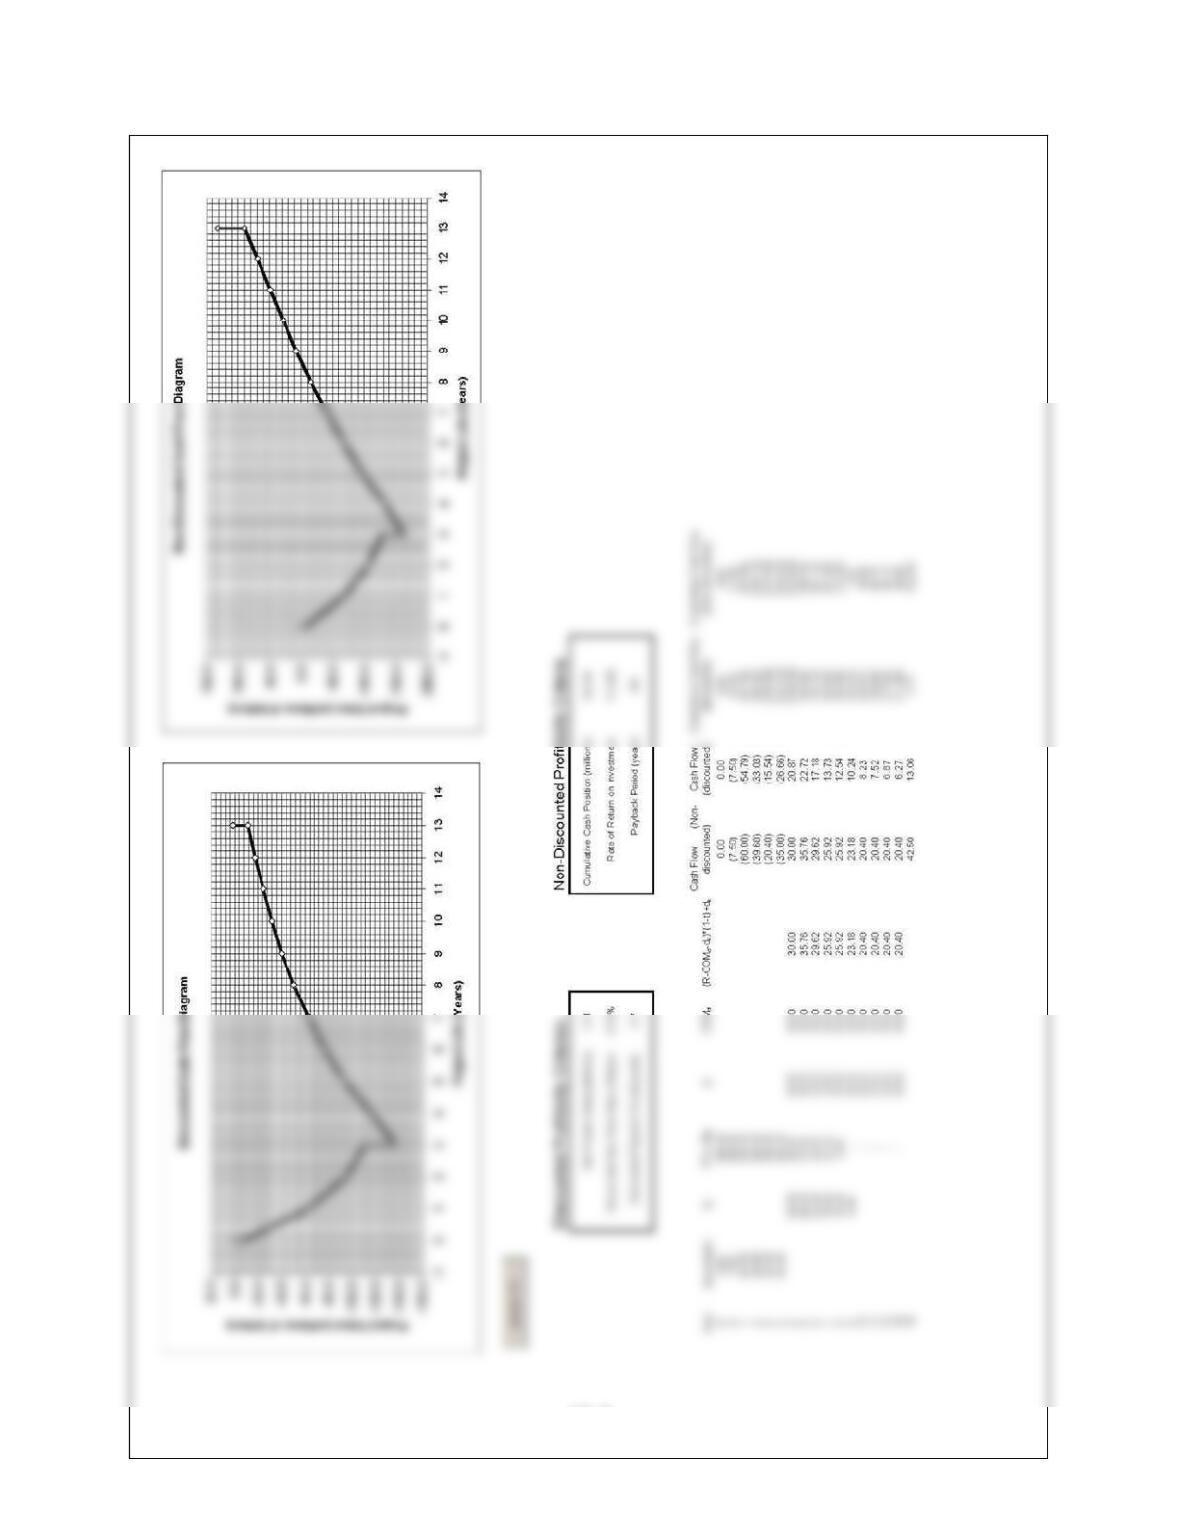
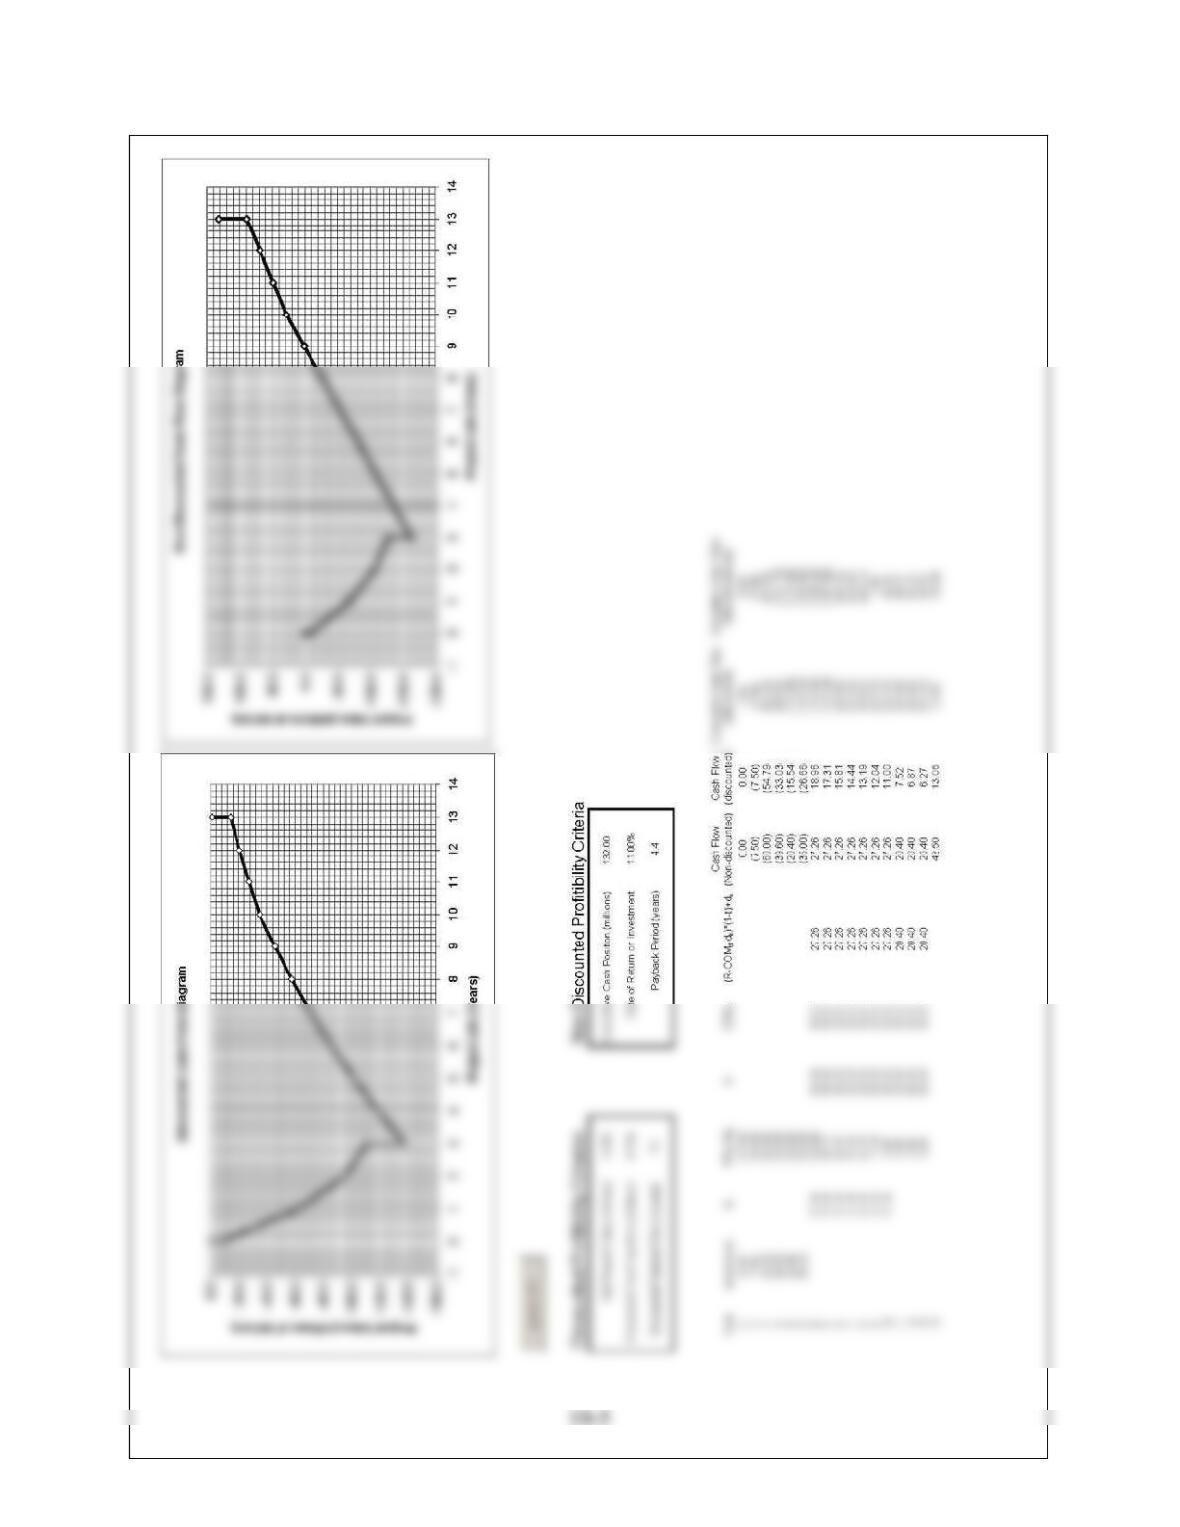
10.8 The spreadsheet on the next page shows the cash flow diagrams.
(a) Non-Discounted Cash Flow Diagram shown on next page.
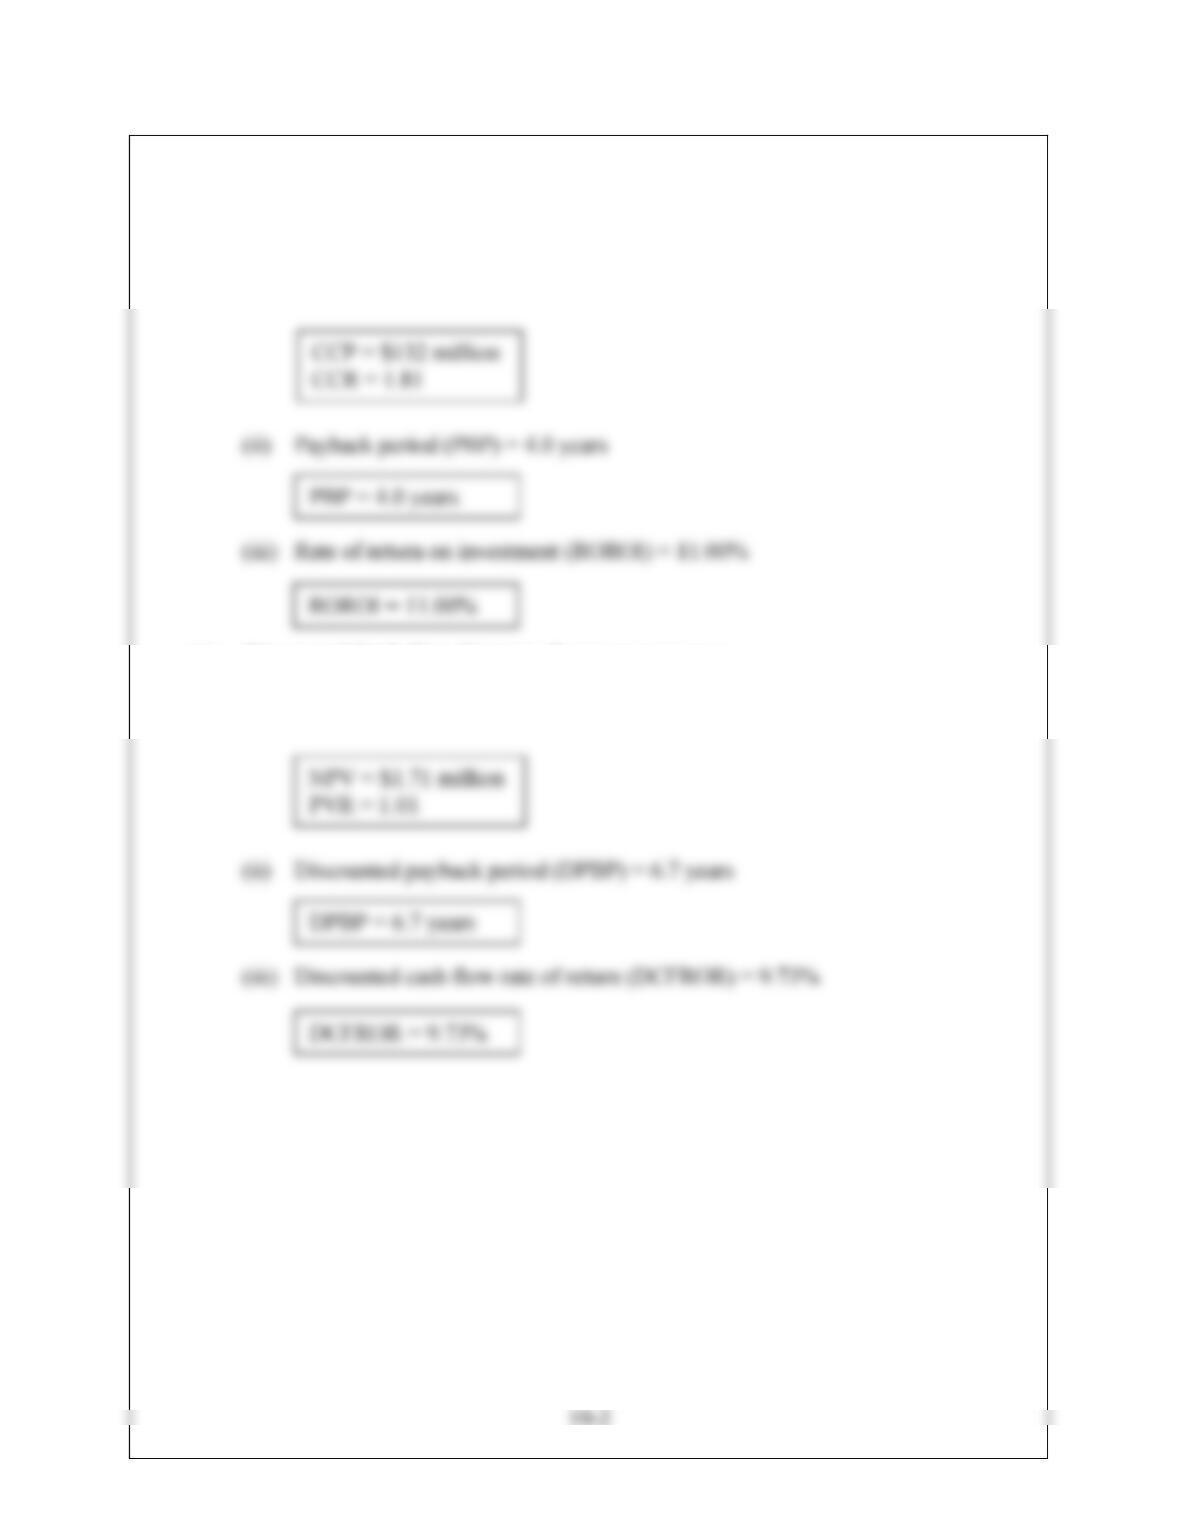
(b) (i) Cumulative cash position (CCP) = $132 million
Cumulative cash ratio (CCR) = 1.81
(c) Discounted Cash Flow Diagram shown on next page.
(d) (i) Net present value (NPV) = $1.71 million
Present value ratio (PVR) = 1.01
10-3
10-4
10.9 The spreadsheet on the next page shows the cash flow diagrams.
(a) Non-Discounted Cash Flow Diagram shown on next page.
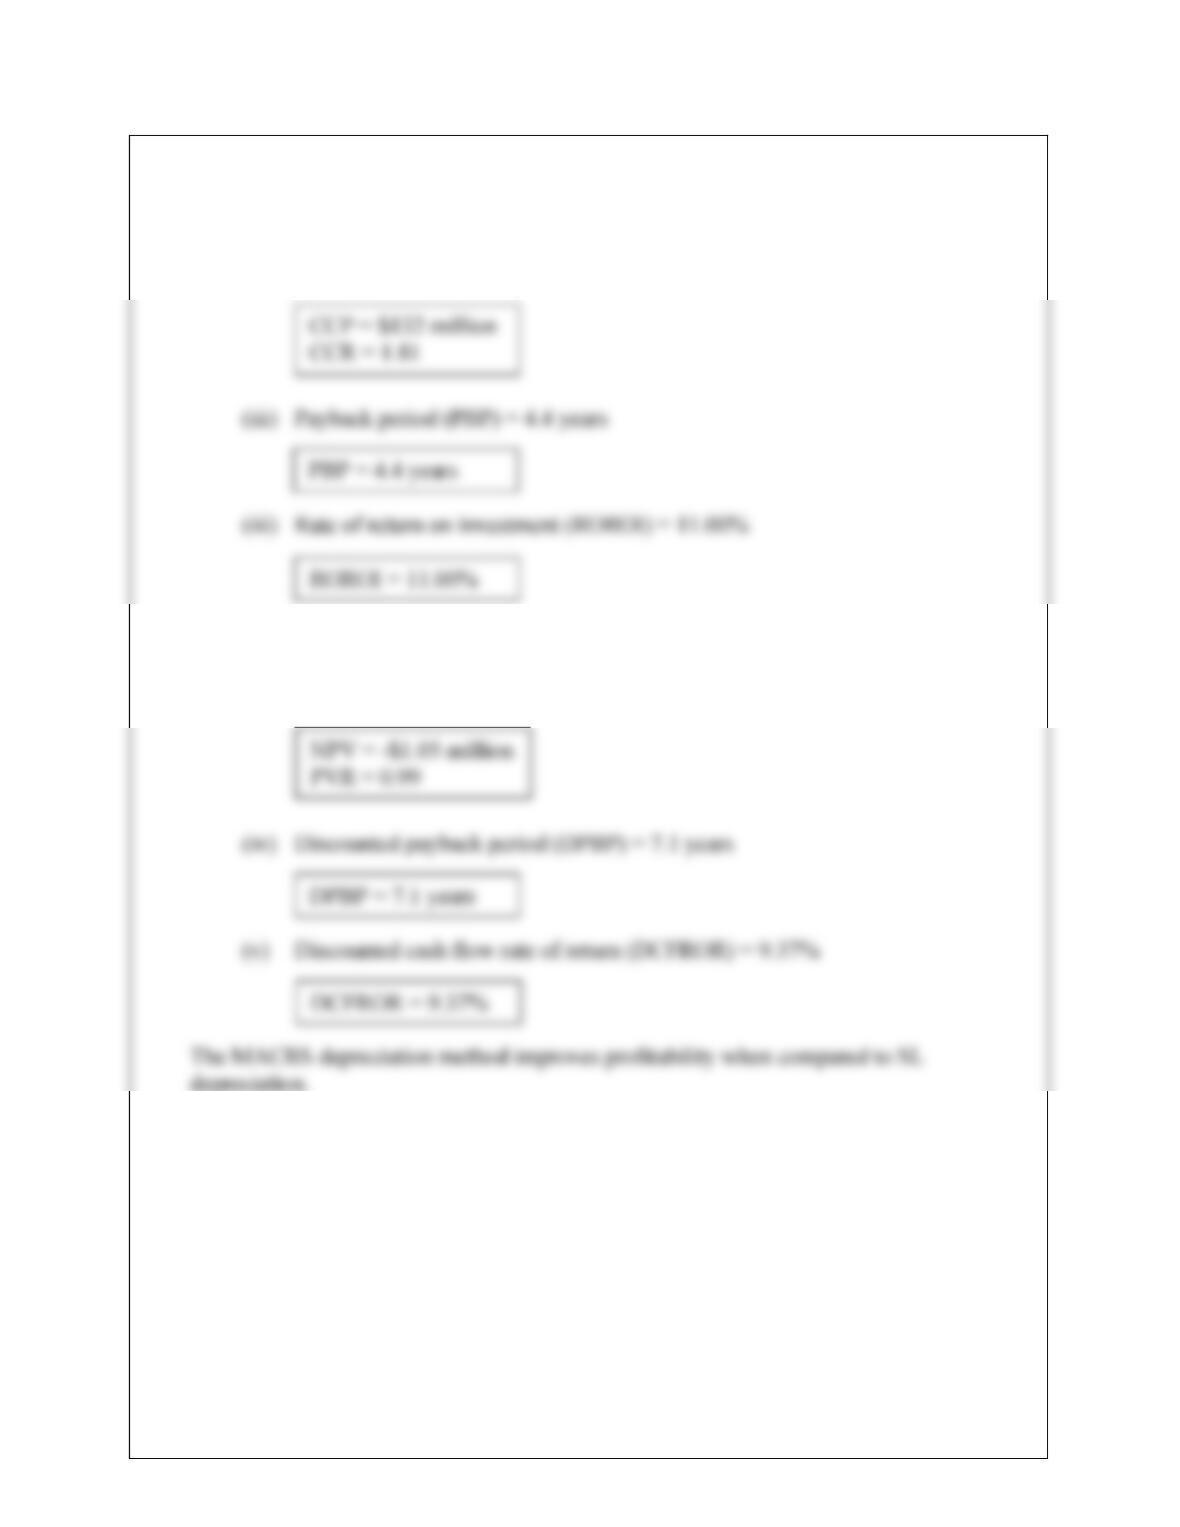
(b) (i) Cumulative cash position (CCP) = $132 million
Cumulative cash ratio (CCR) = 1.81
(c) Discounted Cash Flow Diagram shown on next page.
(d) (i) Net present value (NPV) = -$1.05 million
Present value ratio (PVR) = 0.99
10-6
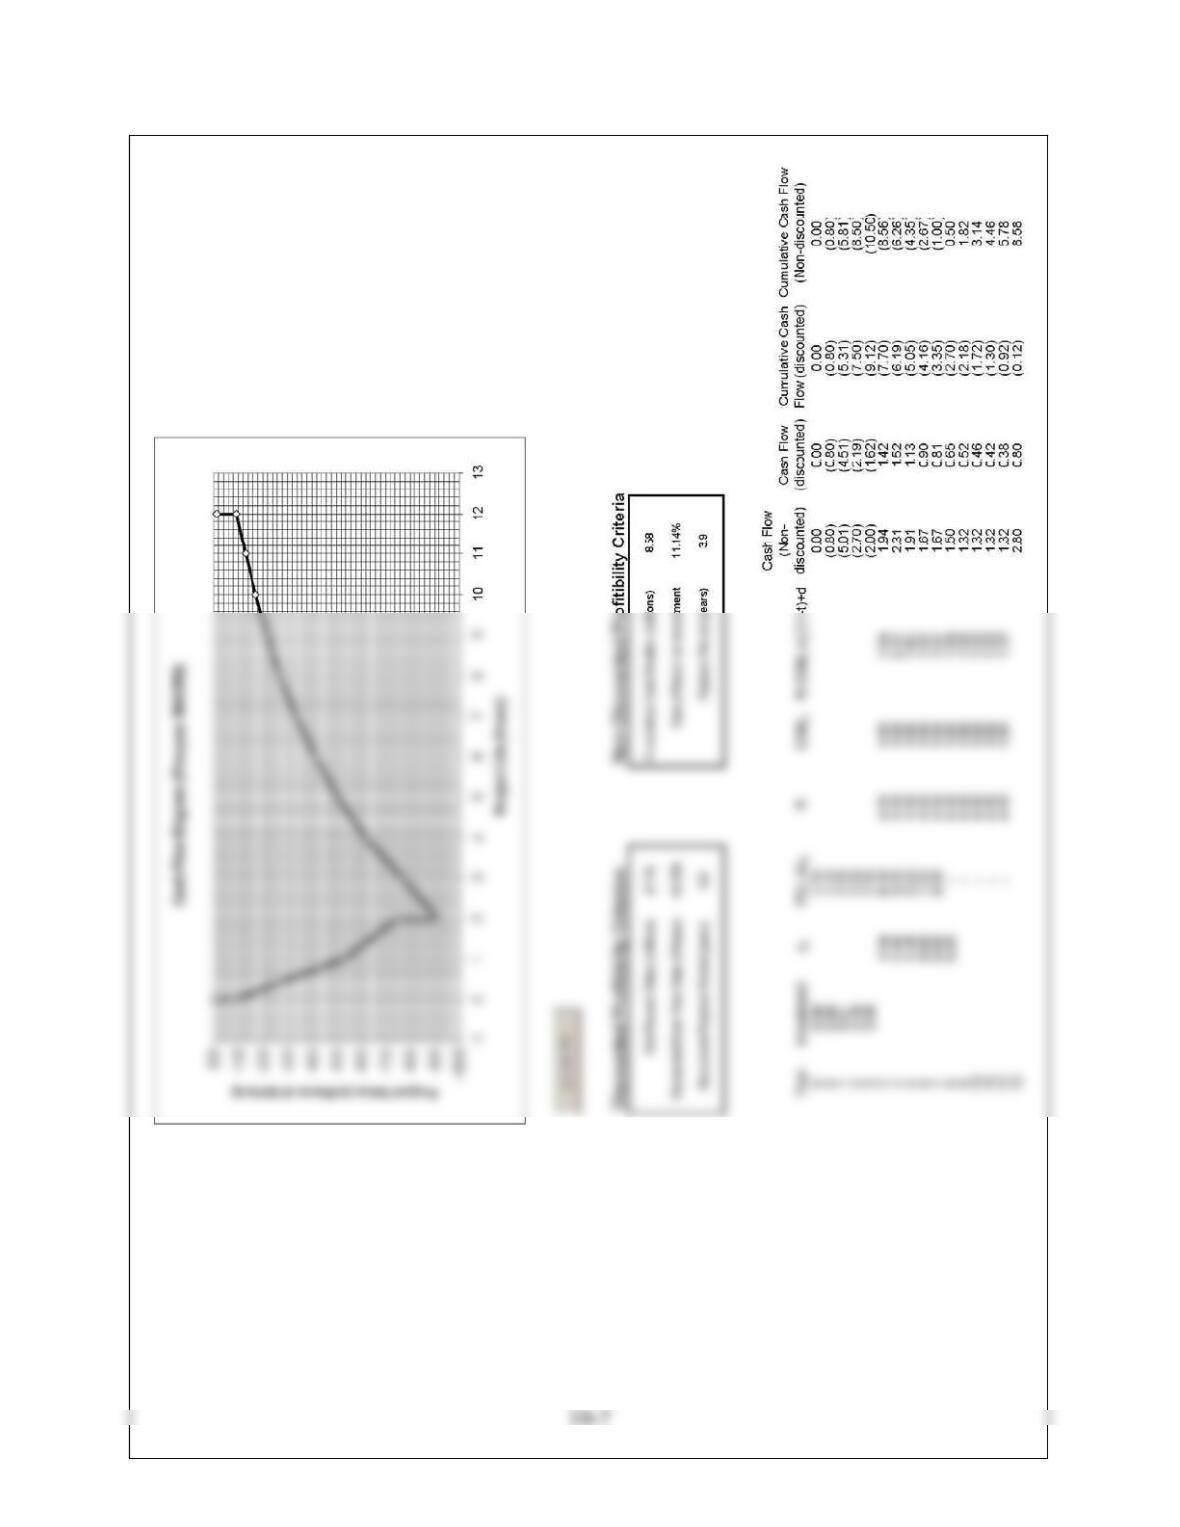
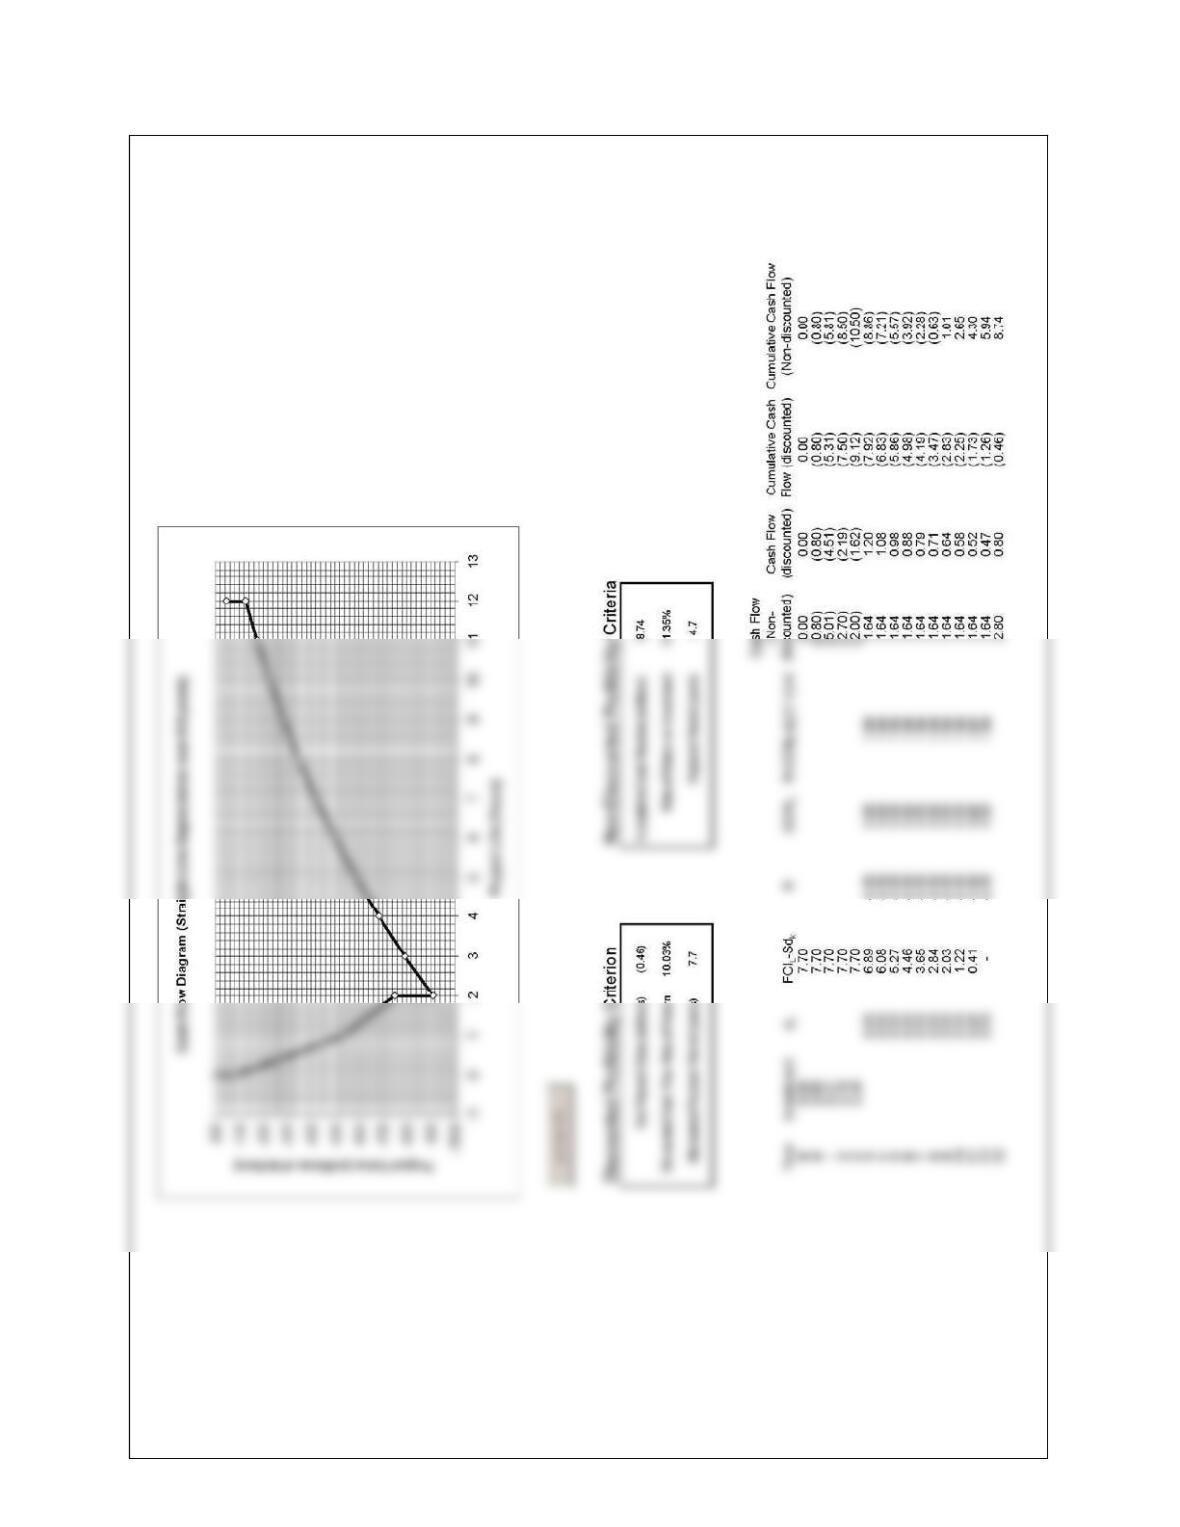
10.10 The spreadsheet and cash flow diagrams for each case are shown on the following pages.
(a) MACRS method for 5 years
10-8
10-9
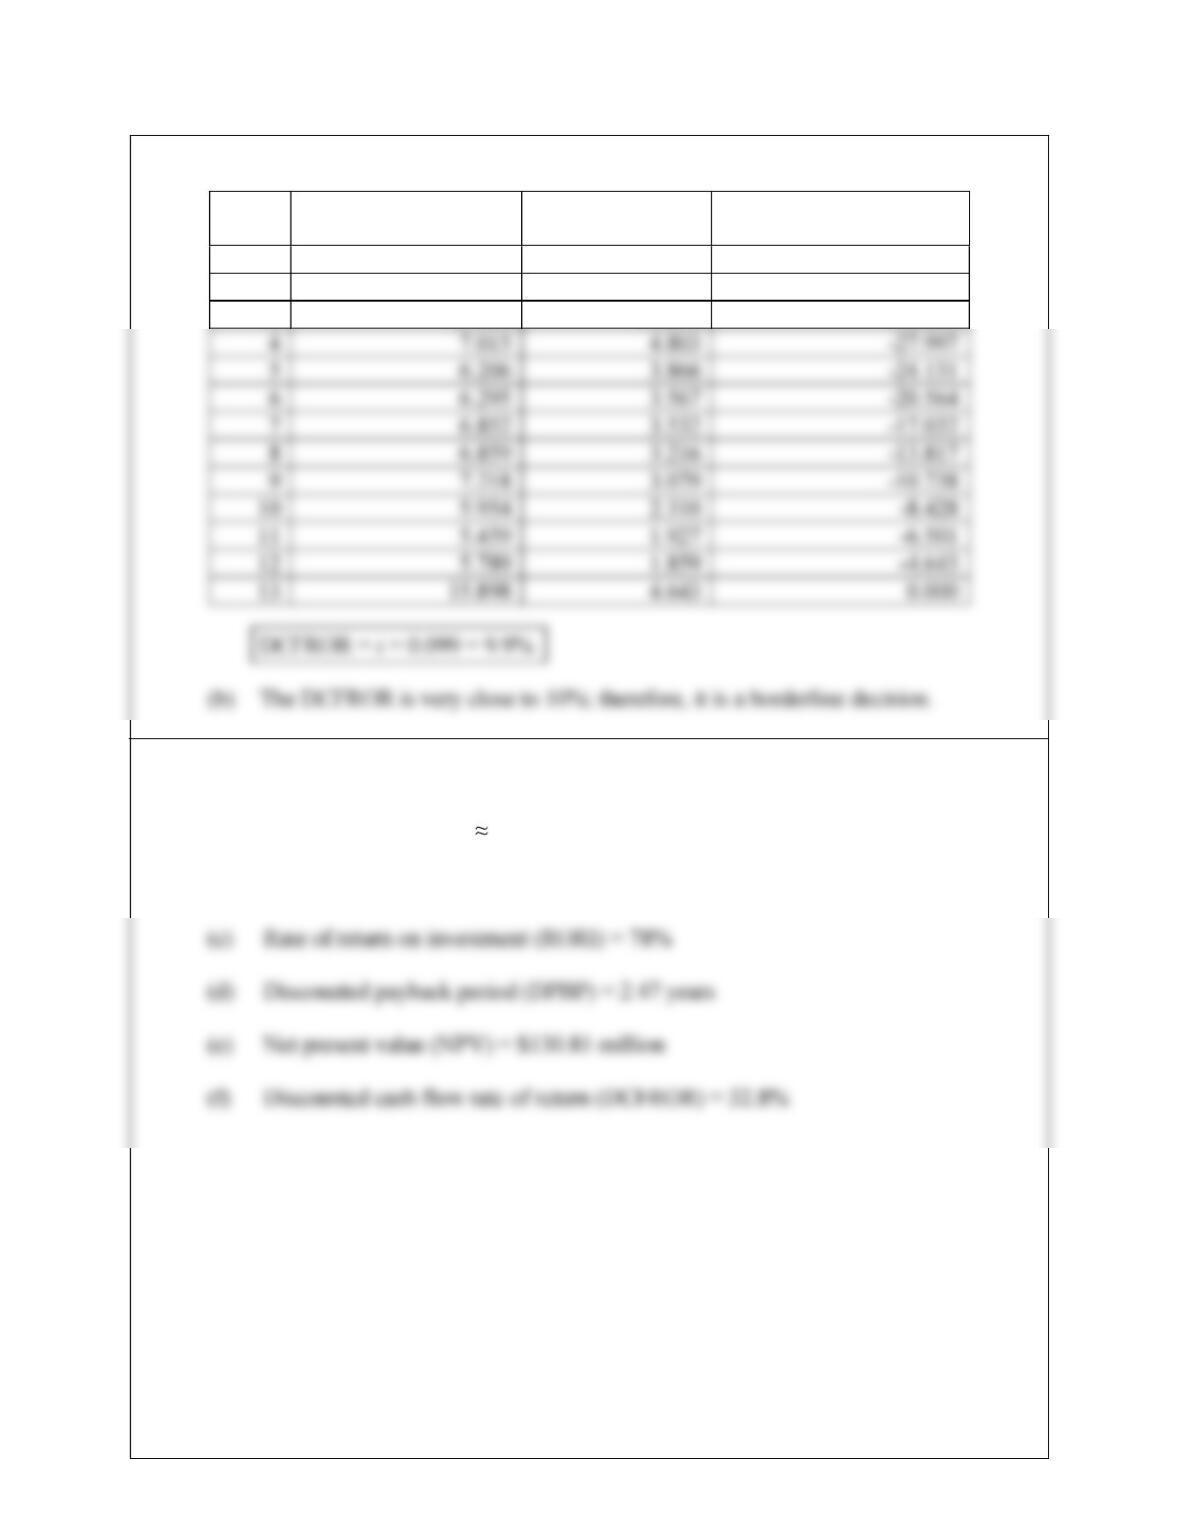
10.11 (a) DCFROR = i, where NPV = 0
Year Nondiscounted
Cash Flow ($106/yr)
Discounted Cash
Flow ($106/yr)
Cumulative Discounted
Cash Flow ($106/yr)
1 -10.000 -9.097 -9.097
2 -15.000 -12.412 -21.509
3 -15.000 -11.291 -32.800
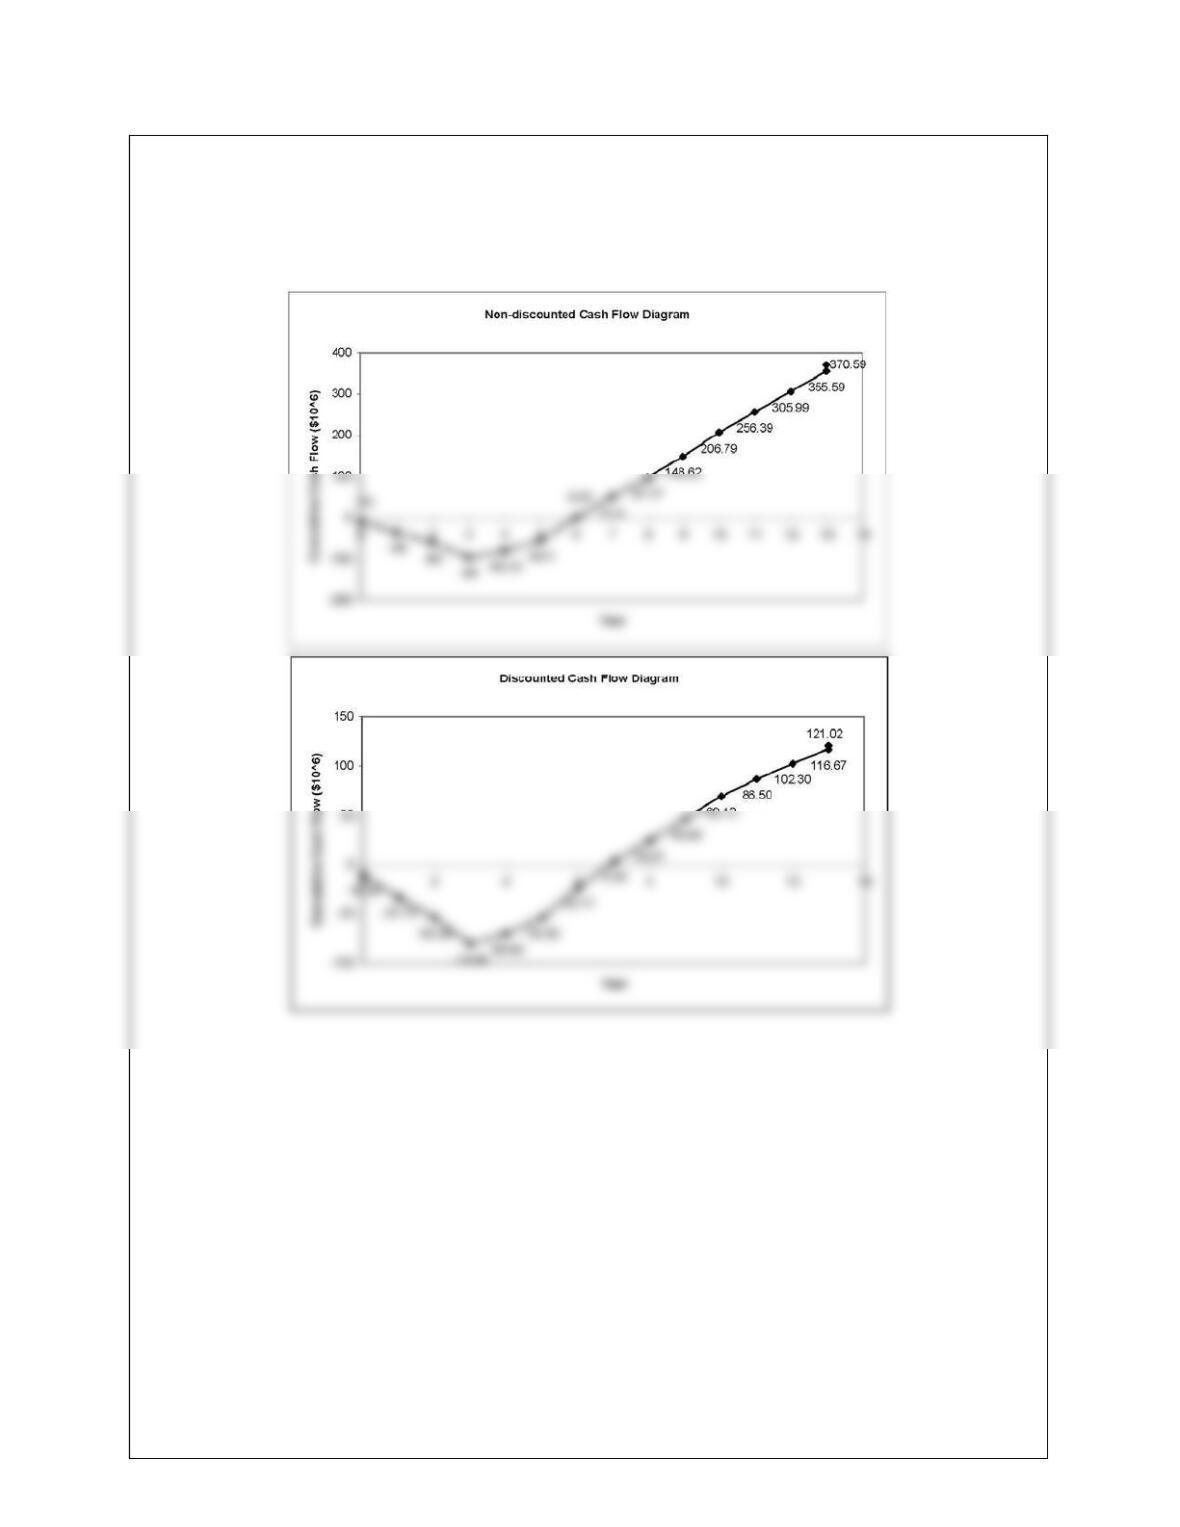
10.12 The spreadsheet and cash flow diagrams are shown on the following pages.
(a) Payback period (PBP) 2.54 years
(b) Cumulative cash position (CCP) = $360.60 million
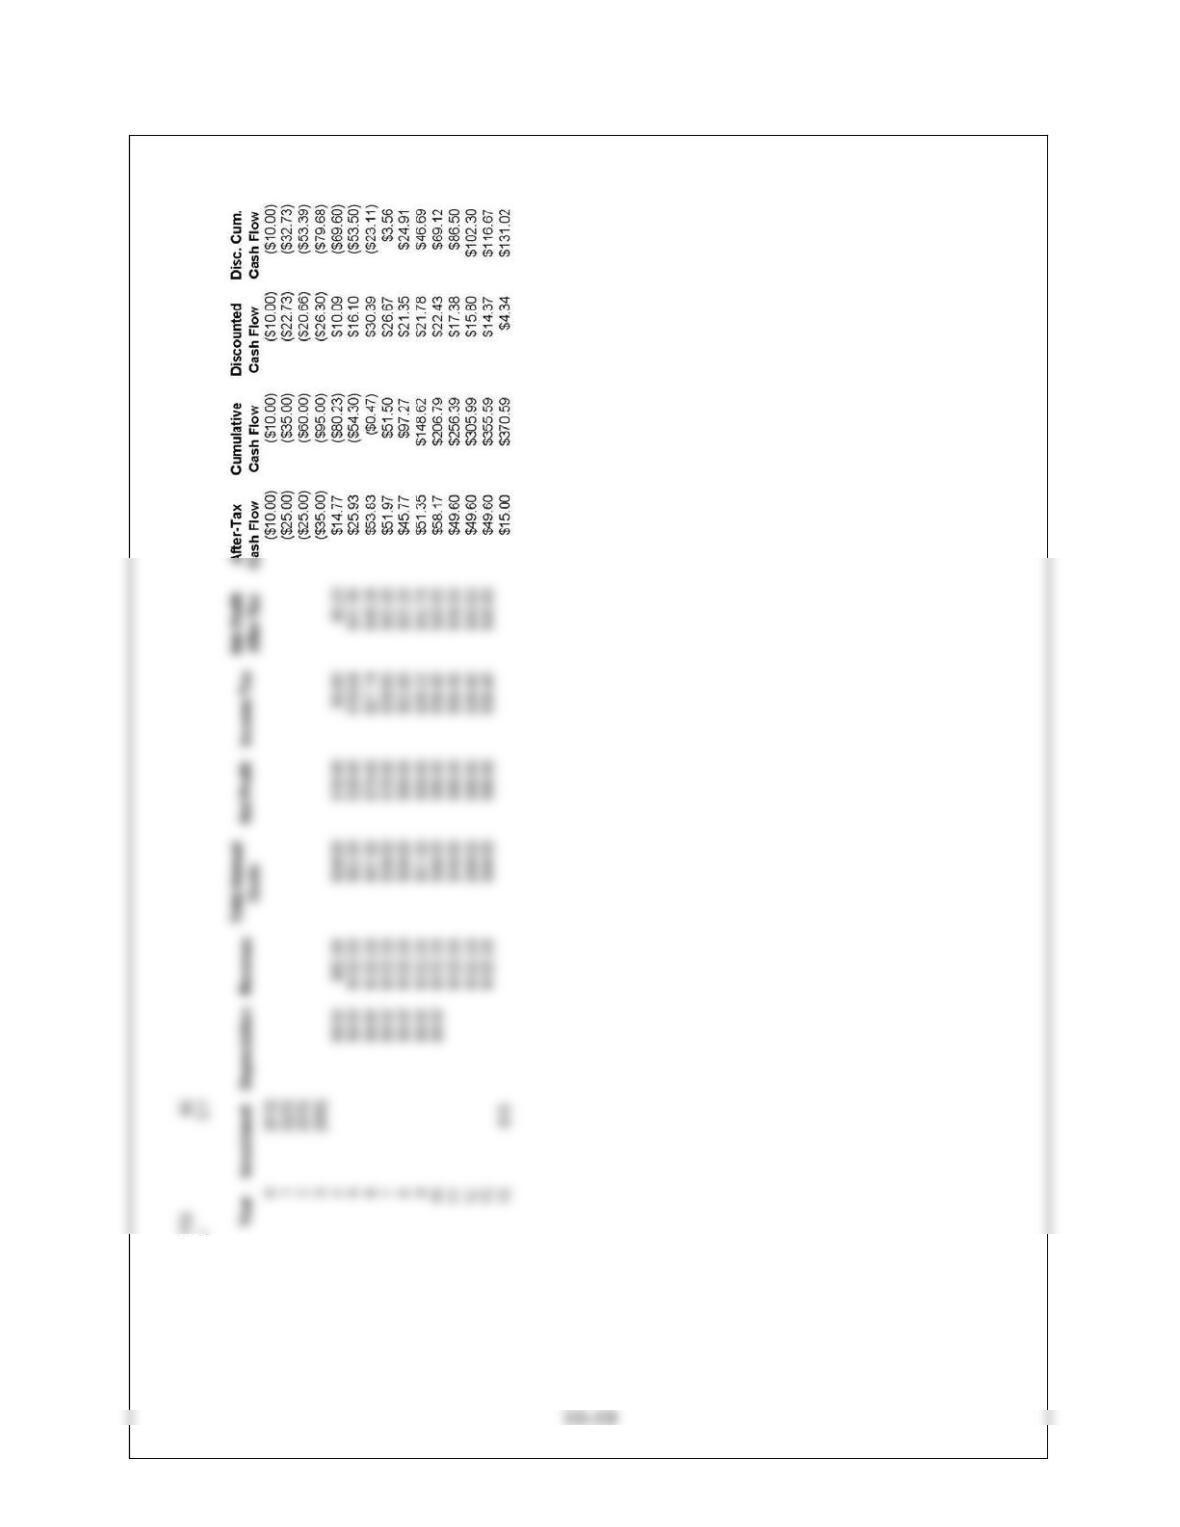
Note: Amounts shown in table are in millions of dollars.
10-11
10-12
10.13 (a) From year 4
Taxation rate, t = income tax / net profit = 3.8/10 = 38%
T = 38%
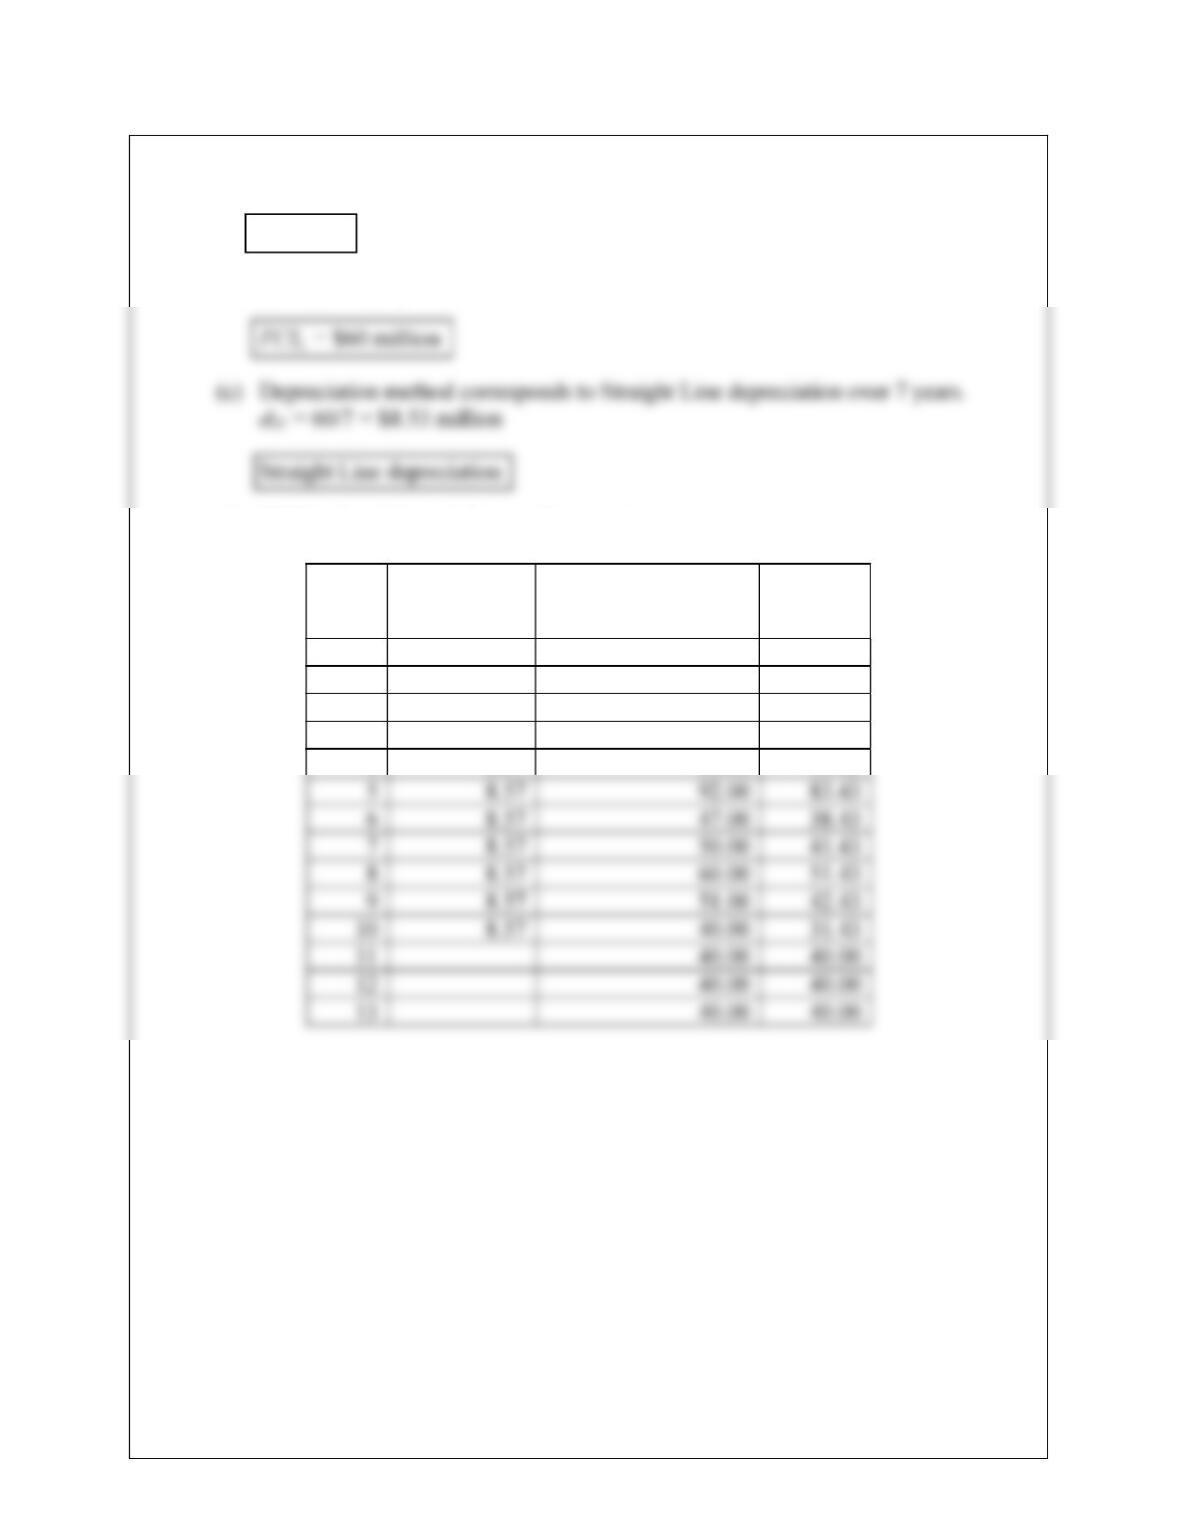
(b) Total Fixed Capital Cost (FCIL) = 80 20 = $60 million
(d) COM = Total Annual Costs – Depreciation
Year Depreciation
($106//yr)
Total Annual Costs
($106//yr)
COM
($106//yr)
0
1
2
3
4 8.57 50.00 41.43
10-13
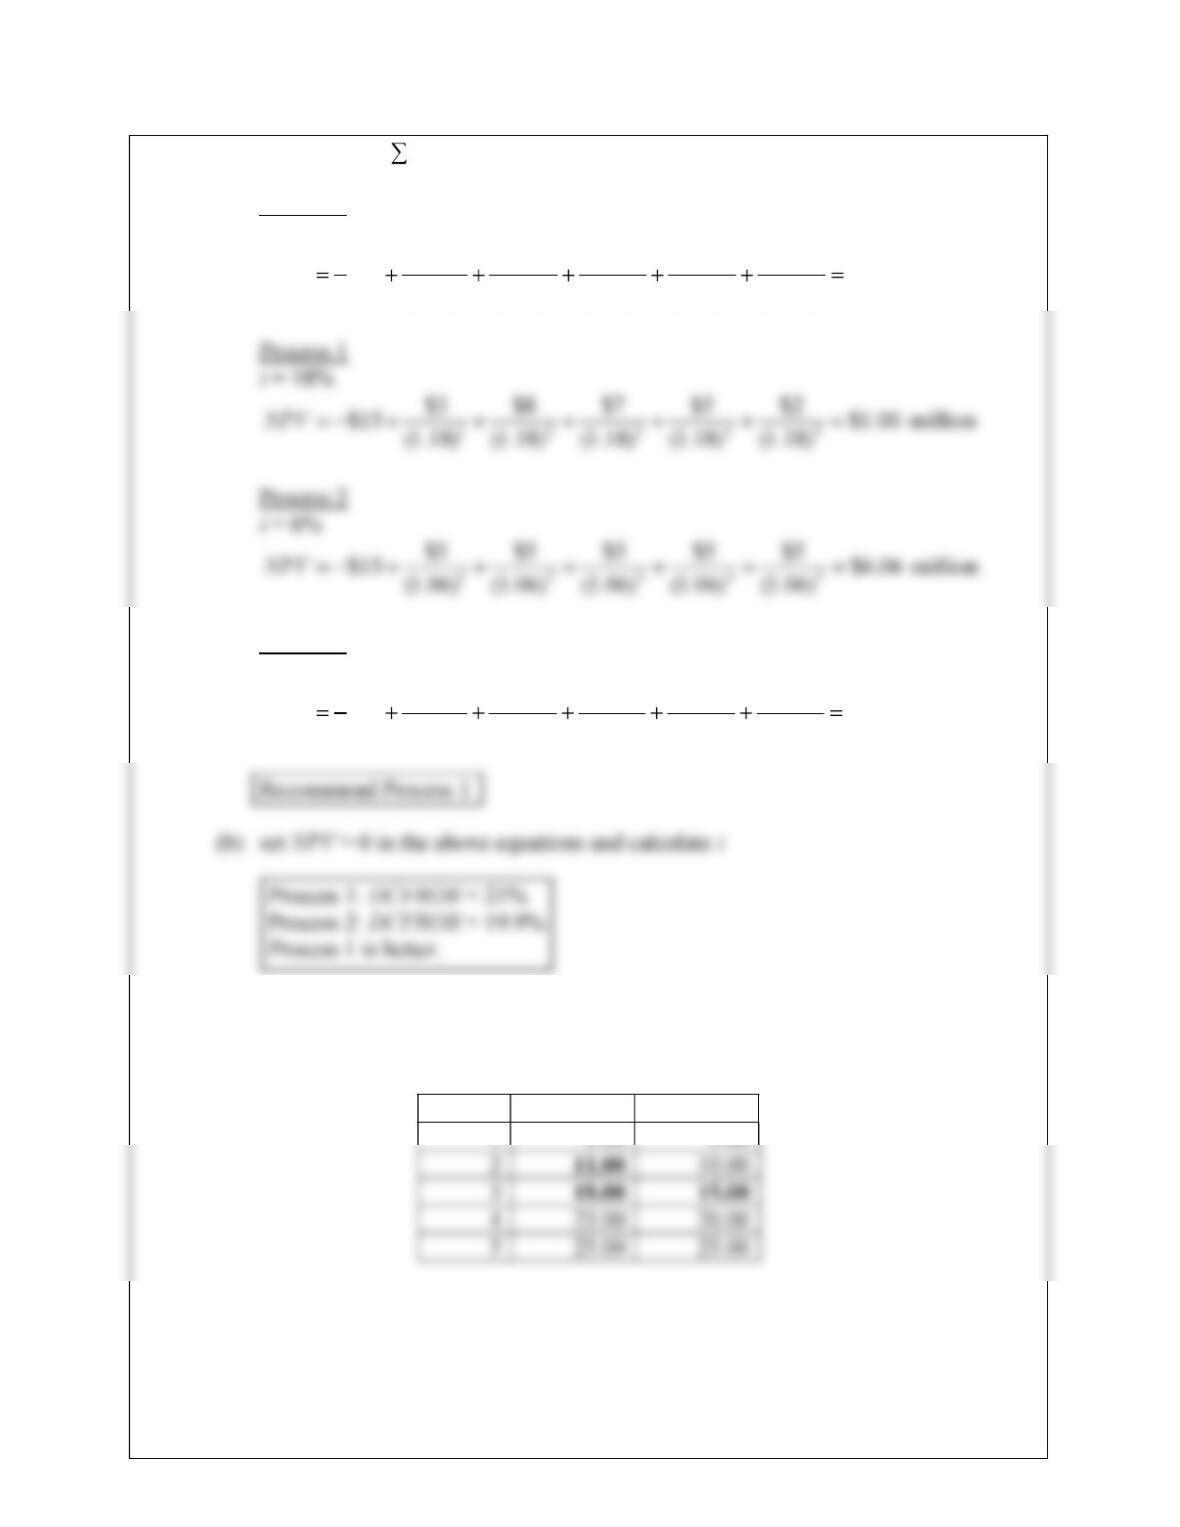
10.14 (a) NPV = –FCI + CFi(P / F,i,n)
Process 1
i = 6%
28.6$
)06.1(
2$
)06.1(
5$
)06.1(
7$
)06.1(
8$
)06.1(
3$
15$ 54321
NPV million
Process 2
i = 18%
64.0$
)18.1(
5$
)18.1(
5$
)18.1(
5$
)18.1(
5$
)18.1(
5$
15$ 54321
NPV million
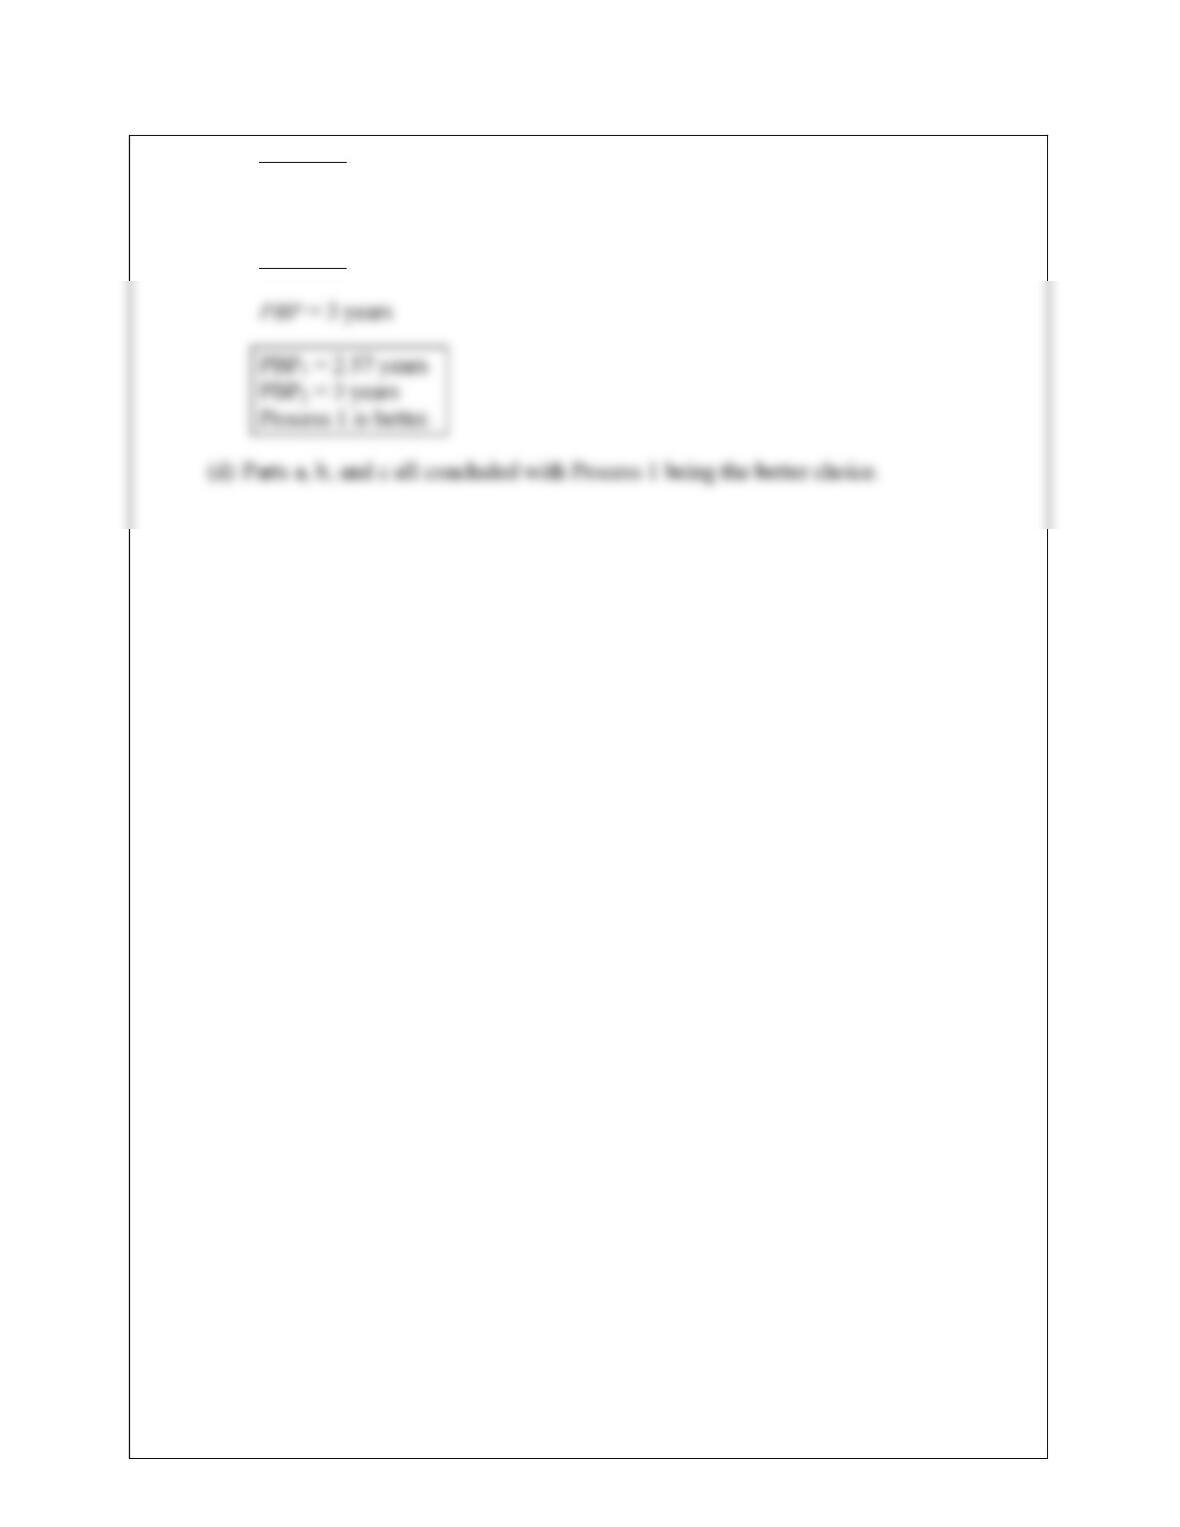
(c) Payback Period
Cumulative cash flows.
Year Process 1 Process 2
10-14
Process 1
PBP = 2+(15-11)/(18-11) = 2.57 years
Process 2
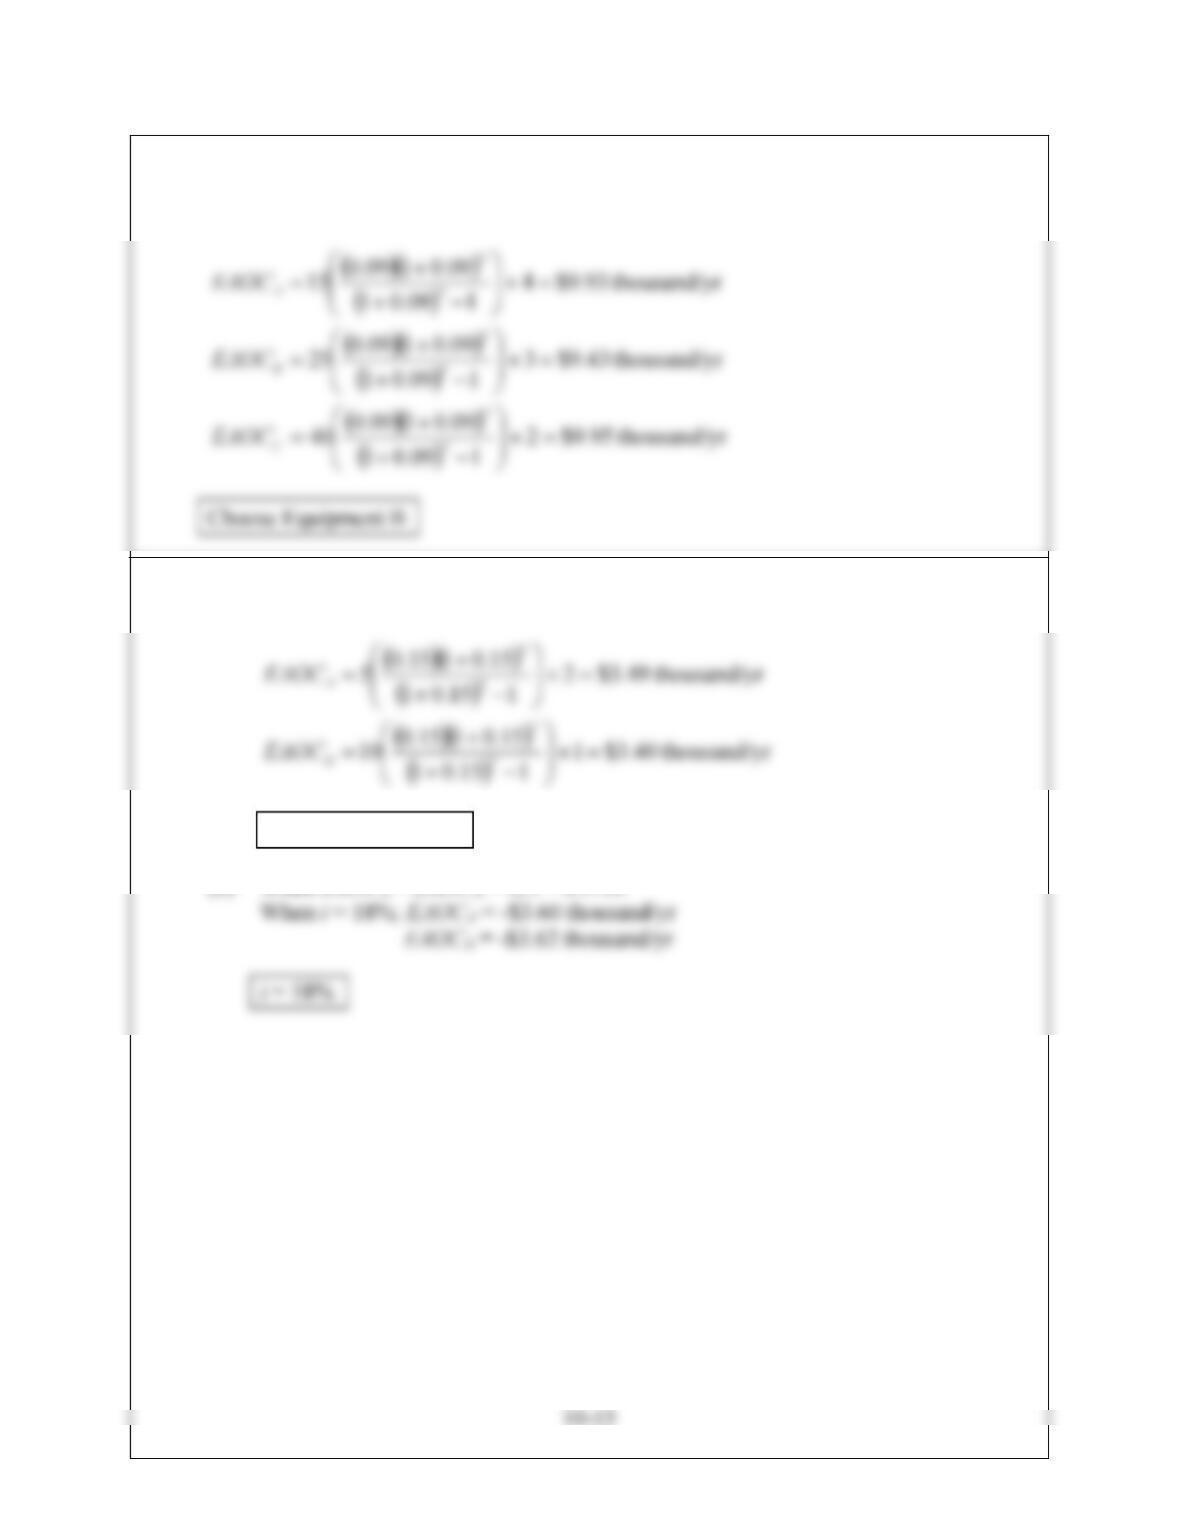
10.15 Compare using EAOC.
EAOC = FCI(A/P,i,n) + YOC
10.16 (a) EAOC = FCI(A/P,i,n) + YOC
Choose Equipment B
10-16
10.17 Compare using EAOC
EAOC = FCI(A/P,i,n) + YOC
The table below only includes equipment that differs in cost between the two options.
10.18 11
1
n
n
i
i
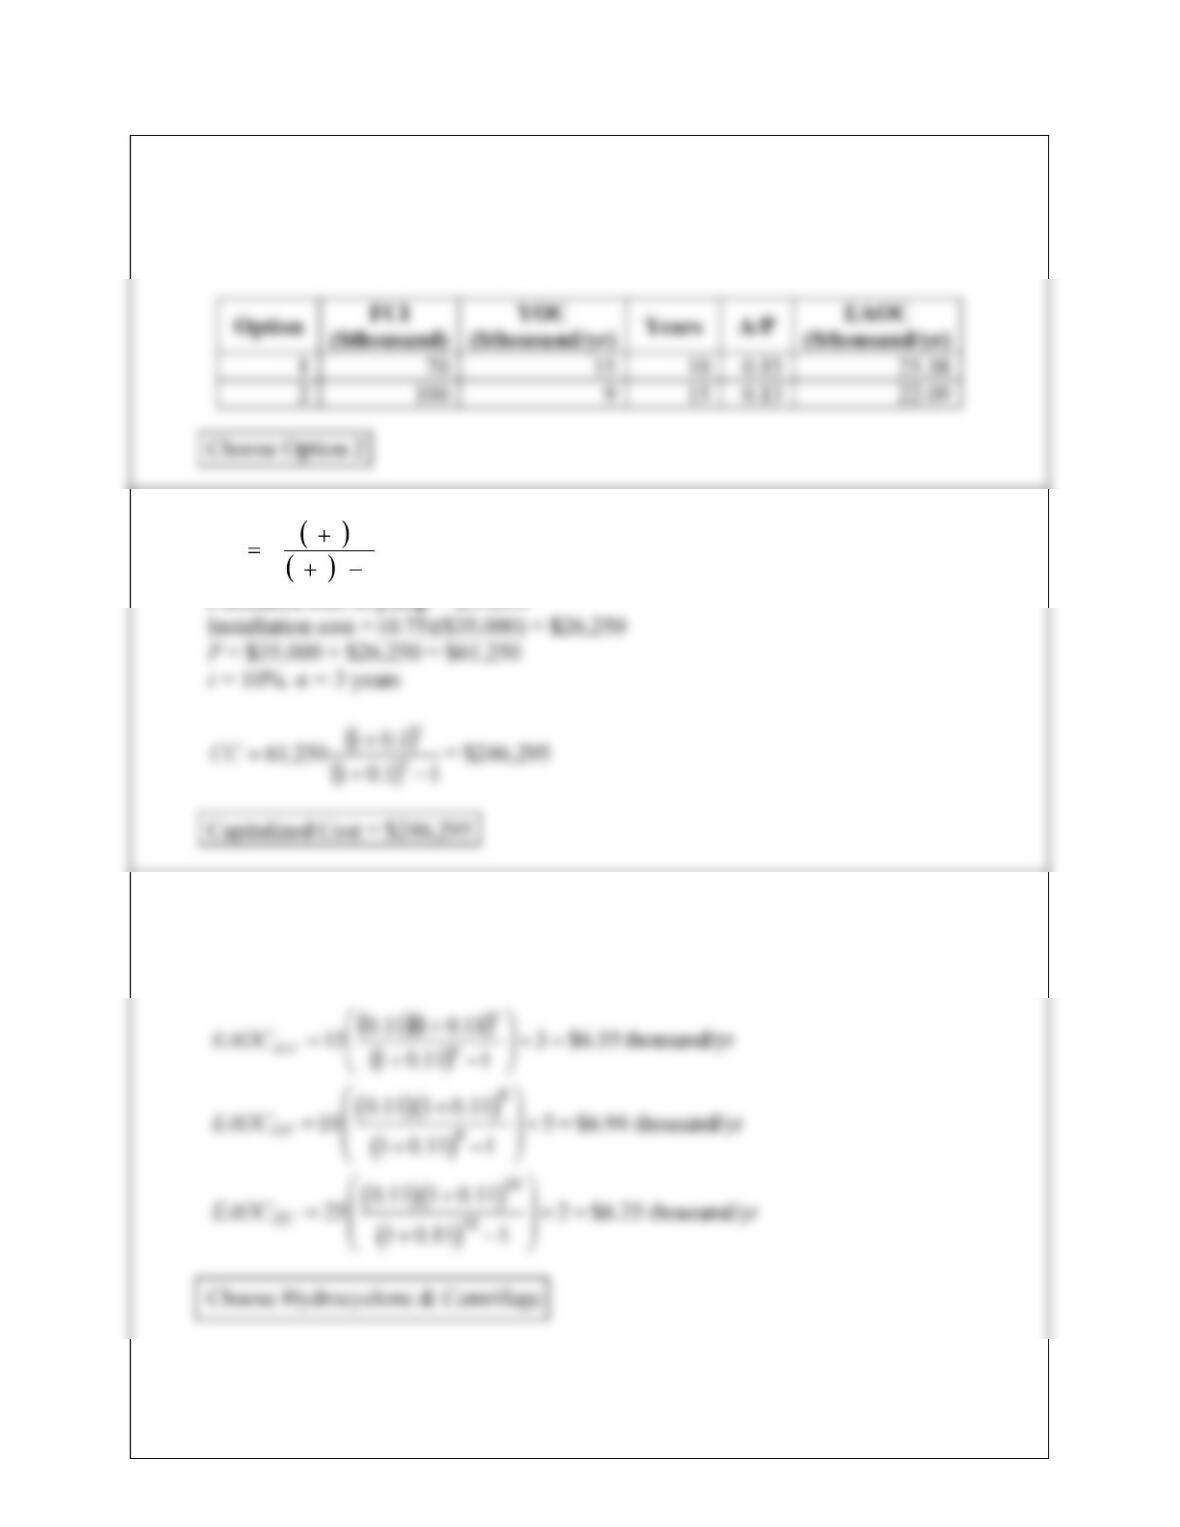
PCC
Purchased cost of pump = $35,000
10.19 Compare using EAOC
EAOC = FCI(A/P,i,n) + YOC
10-17
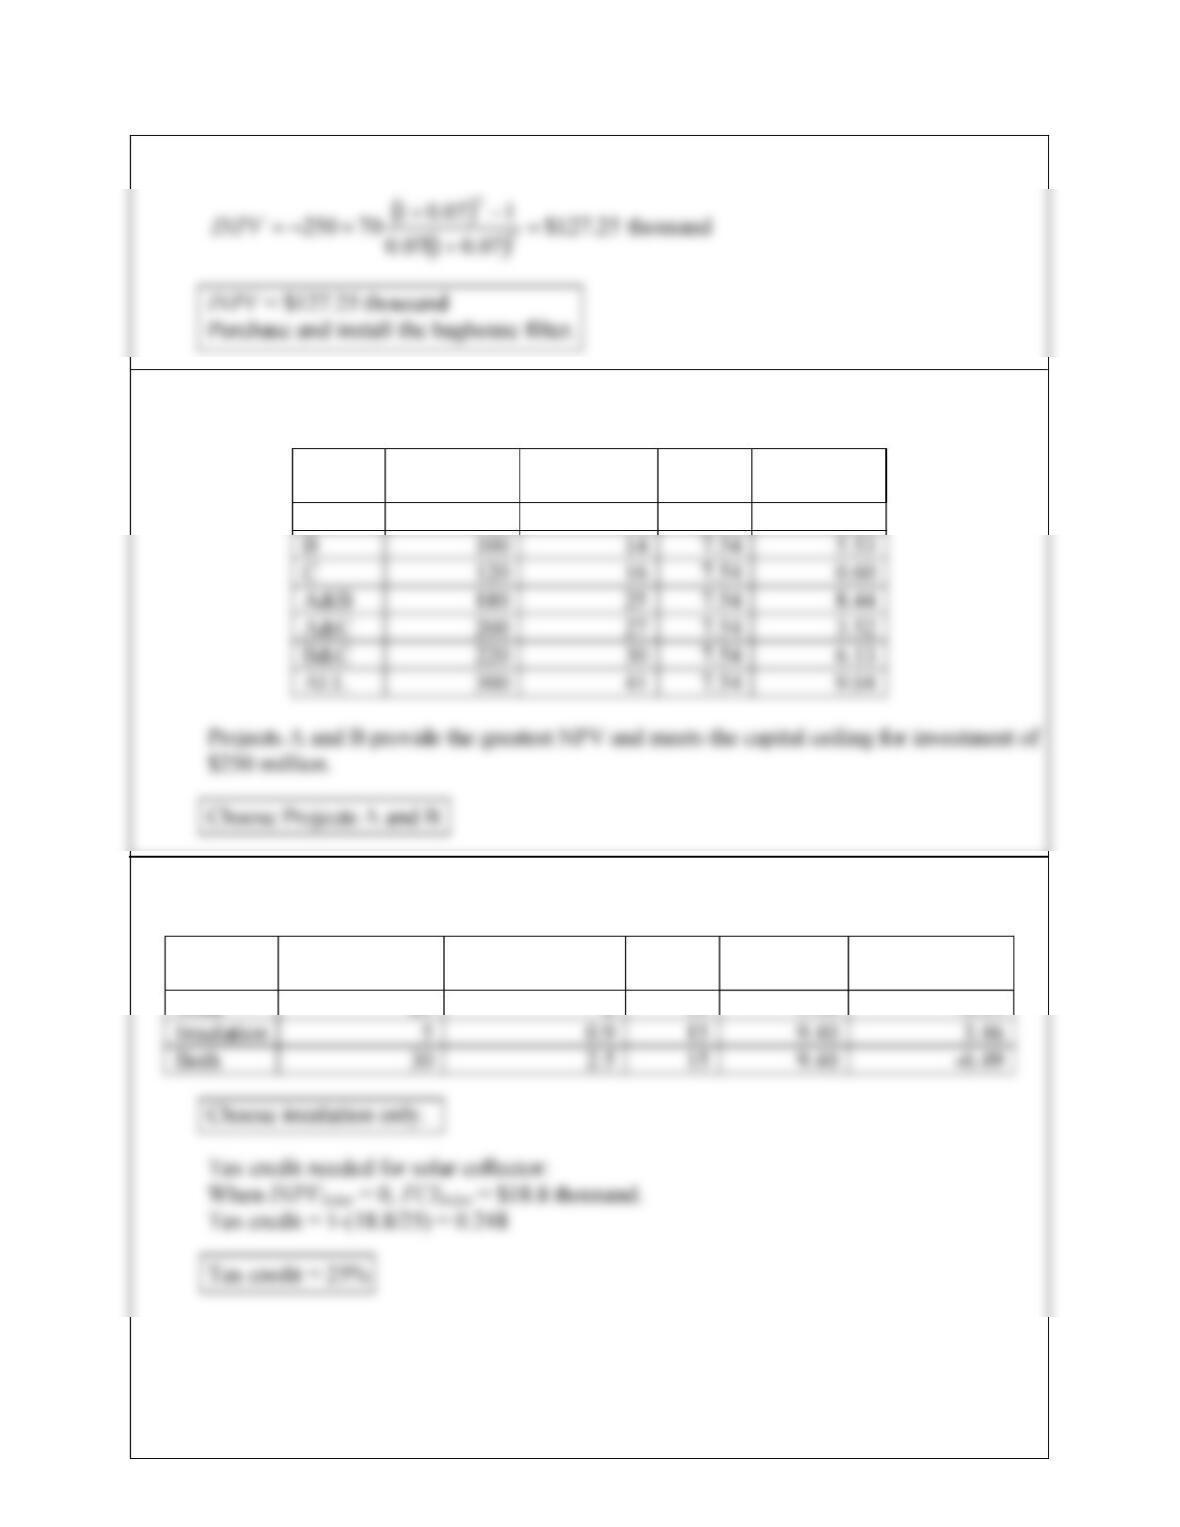
10.20 Incremental analysis: INPV = –FCI + (P/A,i,n)YS
10.21 INPV=–FCI + (P/A,i,n)YS
Project FCI
($ million)
Cash Flow
($ million) P/A INPV
($ million)
A 80 11 7.54 2.91
10.22 INPV = –FCI + (P/A,i,n)YS
Project FCI
($ thousands)
Yearly Savings
($ thousands) Years P/A INPV
($ thousands)
Solar 25 2 15 9.40 -6.19
10-18
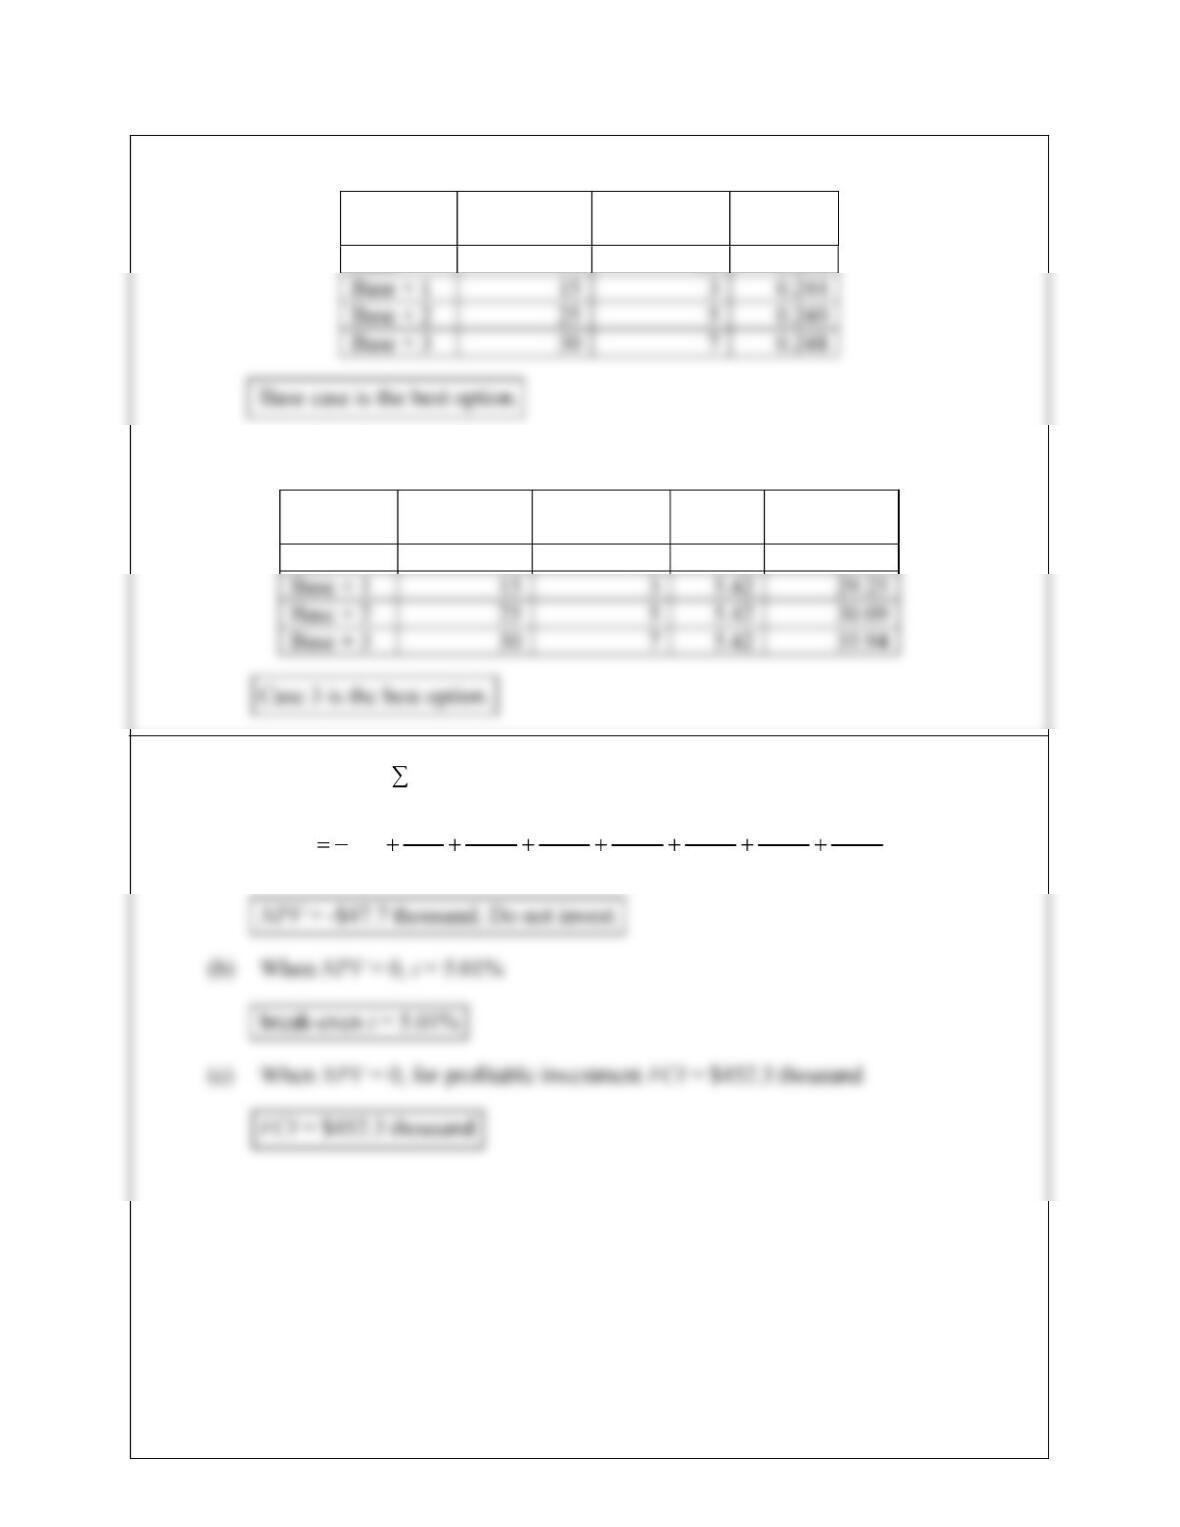
10.23 (a) ROROII = Incremental Yearly Savings / Incremental Investment
Case FCI
($ million)
Cash Flow
($ million) ROROII
Base 75 19 0.253
(b) INPV=–FCI + (P/A,i,n)YS
Case FCI
($ million)
Cash Flow
($ million) P/A INPV
($ million)
Base 75 19 5.42 27.99
10.24 (a) NPV = –FCI + CFi(P / F,i,n)
765432 08.1
75
08.1
80
08.1
80
08.1
85
08.1
90
08.1
90
08.1
100
500
NPV