Chapter 9
The Use of Budgets in Planning and Decision Making
Concept Questions
1. (LO 1—Concepts and purposes of budgets)
Budgets by their nature are future oriented and involve the use of estimates. In
2. (LO 1—The budgeting process)
A personal budget would begin with estimated cash inflows from a job or other
3. (LO 2—The sales budget)
The sales budget is the most important because it is at the beginning of the
4. (LO 2—The sales forecast)
Major factors considered in a sales forecast include anticipated consumer
demand, the impact of competitors, and the economic outlook for the anticipated
Solutions Manual
9-2
5. (LO 3—The production budget)
6. (LO 4—Preparation of material, labor, and overhead budgets)
This statement is false in that the expected level of production affects the
7. (LO 5—The cash receipts budget)
Cash receipts budgets are used in a variety of decisions including the timing of
8. (LO 5—Focusing on cash flow)
Budgets focus on cash flow because the timing of cash flows is critical to the
9. (LO 6—Pro forma financial statements)
Internally, budgeted income statements are used to help plan estimated tax
10. (LO 7—Financial budgets for merchandising and service companies)
Financial budgets for merchandising companies differ from manufacturing
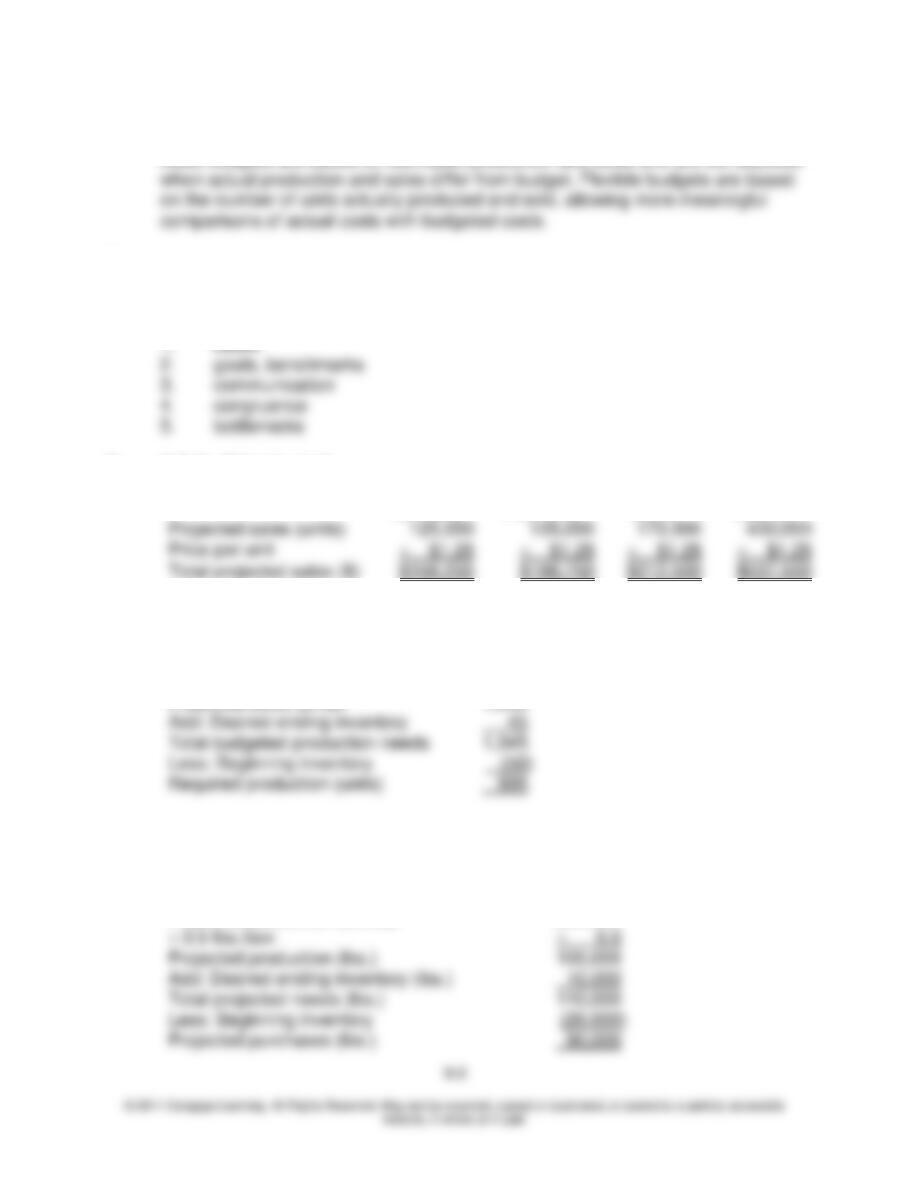
Projected production (lbs.)
100,000
Add: Desired ending inventory (lbs.)
Total projected needs (lbs.)
110,000
Less: Beginning inventory
Chapter 9: The Use of Budgets in Planning and Decision Making
11. (LO 8—Static vs. flexible budgets)
Static budgets are based on estimated production and sales and are not adjusted
Exercises
1. (LO 1—Advantages of budgeting)
1. future
2. (LO 2—Sales budget)
January
February
March
Quarter
Projected sales (units)
3. (LO 3—Production budget)
Production Budget
August
Projected sales (units)
Add: Desired ending inventory
Total budgeted production needs
Less: Beginning inventory
4. (LO 4—Purchases budget)
90,000 pounds of flour should be purchased during the year.
Projected production (boxes)
200,000
Solutions Manual
9-4
5. (LO 4—Purchases budget for a merchandising company)
6. (LO 4—Direct labor budget)
April
May
June
2nd Quarter
Required Production (# of hammocks)
15,000
12,500
12,500
40,000
Direct labor hours per hammock
Total direct labor hours needed (A)
Direct labor cost per hour (B)
7. (LO 4—Selling and administrative budget)
8. (LO 5—Cash receipts budget)
Sales
April
May
June
February
May
Projected sales (units)
100
Total budgeted purchases
106
Units to be purchased in May
101
Variable selling and administrative expenses
Insurance
Chapter 9: The Use of Budgets in Planning and Decision Making
9. (LO 5—Cash receipts budget)
Cash Receipts Budget
March 31
10. (LO 5—Cash disbursements budget)
Robyn’s Rocket Shop
Cash Disbursements Budget
For the Month of June
Labor expenses
Rent on store
Selling expenses
11. (LO 6—Budgeted income statement)
12. (LO 7—Budgeting in a JIT environment)
In JIT companies, production is typically equal to sales, so the production budget and
Robyn’s Rocket Shop
Budgeted Income Statement
For the Quarter Ended Sept. 30
Sales
$185,000
Cost of goods sold
Gross margin
$128,200
Selling and administrative expenses
Subtotal
$ 53,750
Interest expense
Income before taxes
$ 51,350
Income tax expense
Solutions Manual
9-6
13. (LO 8—Flexible budget)
Flexible
Budget
Actual
Difference
Estimated production (boxes)
26,400
26,400
—
Direct labor per box
Direct labor hours needed
Projected direct labor cost
Problems
14. (LO 1 and 2—The sales budget and CVP analysis)
A. Calculation of average revenue per mechanic hour:
B. Monthly sales budget—10 percent increase in budgeted hours
Month
Budgeted
Hours
Rate Per
Mechanic Hour
Budgeted
Revenues
January
1,291.4
$9.92
$ 12,811
February
1,162.7
March
1,237.5
April
1,667.6
May
1,896.4
June
2,766.5
July
3,020.6
August
3,417.7
September
2,663.1
October
2,432.1
November
1,879.9
December
1,676.4
Total
March
1,125
10.42
11,723
April
1,516
10.42
15,797
May
1,724
10.42
17,964
June
2,515
10.42
26,206
July
2,746
10.42
28,613
August
3,107
10.42
32,375
September
2,421
10.42
25,227
October
2,211
10.42
23,039
November
1,709
10.42
17,808
December
1,524
10.42
Total
Chapter 9: The Use of Budgets in Planning and Decision Making
9-7
C. Monthly sales budget—5 percent increase in hourly rate
D. A 10 percent increase in sales volume will result in revenue of $249,111 for
the year while a 5 percent increase in sales price will result in revenue of
15. (LO 2, 3, and 4—Sales, production, and material purchases budgets)
A.
October
November
December
Projected sales (units)
6,500
7,200
9,600
Sales price per unit
$8
$8
$8
Estimated sales ($)
B.
October
November
December
Projected sales (units)
6,500
7,200
9,600
Add: projected ending inventory
+ 720
+ 960
Total projected needs
8,160
10,080
Less: Beginning inventory
(720)
Projected production (units)
7,220
7,440
Month
Budgeted
Hours
Rate Per
Mechanic
Hour
Budgeted
Revenues
January
1,174
$10.42
$ 12,233
February
1,057
10.42
11,014
Solutions Manual
9-8
C.
October
November
December
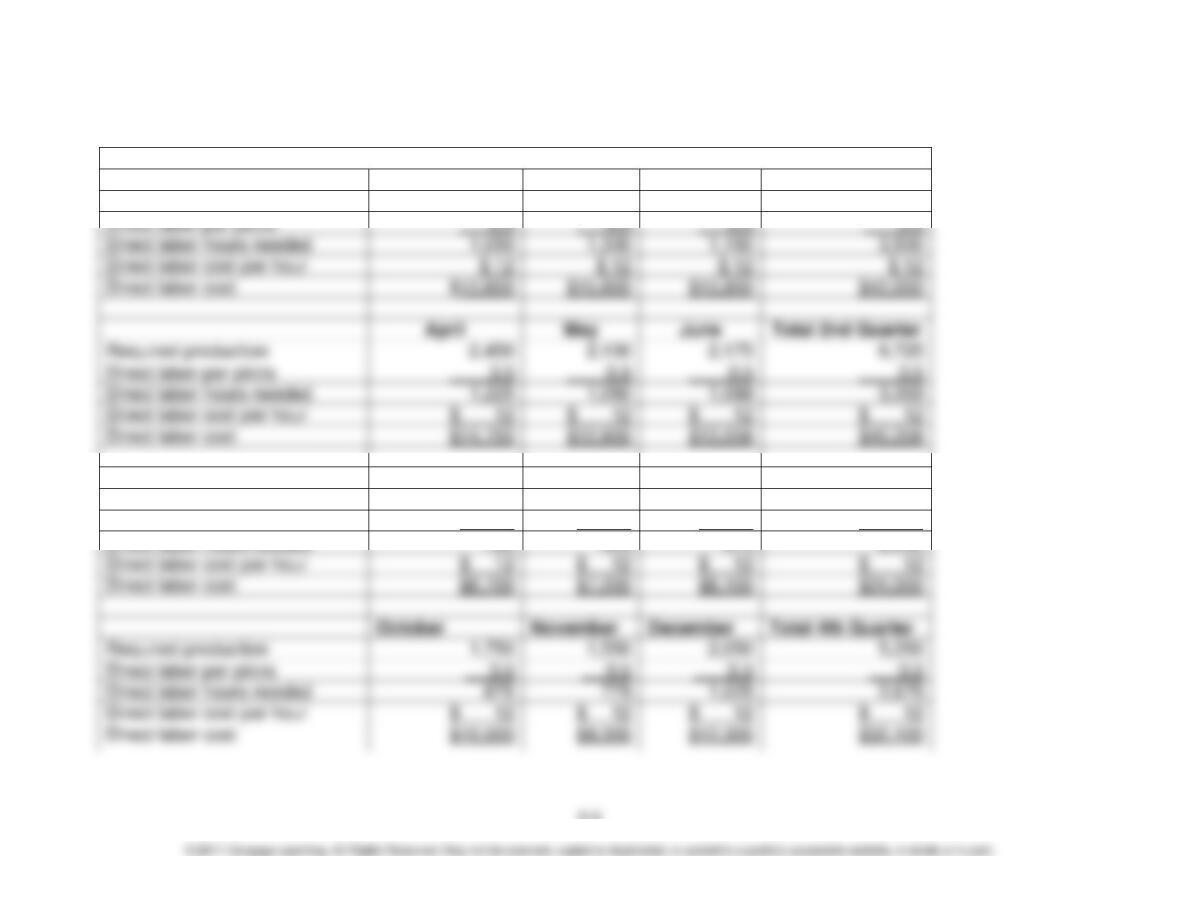
Direct labor cost per hour
$ 12
Direct labor cost
Required production
1,750
1,550
2,050
5,350
Direct labor per pizza
0.5
Direct labor hours needed
775
1,025
2,675
Direct labor cost per hour
$ 12
Chapter 9: The Use of Budgets in Planning and Decision Making
9-9
16. (LO 4—Direct labor and manufacturing overhead budgets)
A. KenCor Pizza—Direct Labor Budget
January
February
March
Total 1st Quarter
Required production
2,100
2,600
2,300
7,000
Direct labor per pizza
0.5
0.5
0.5
Direct labor hours needed
1,050
1,300
1,150
3,500
Direct labor cost per hour
Direct labor cost
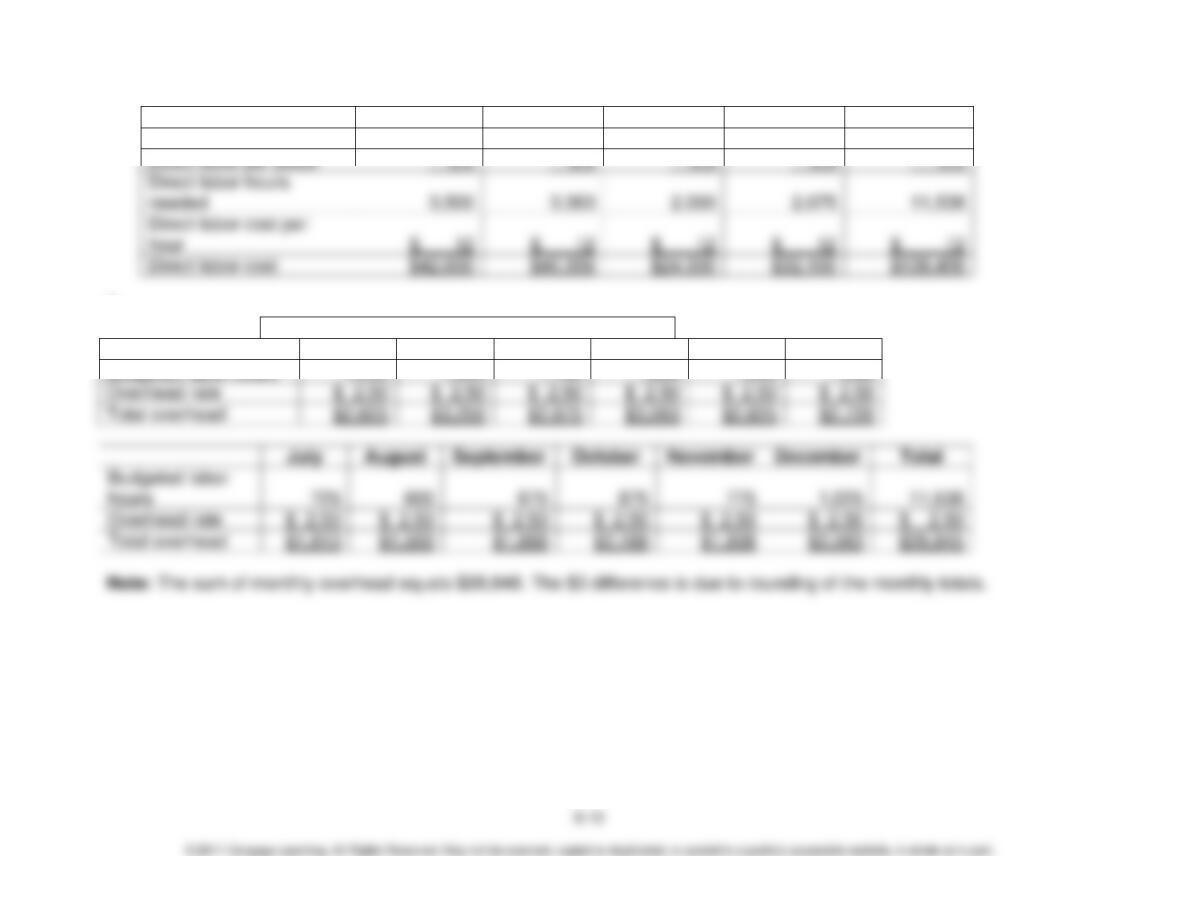
May
Required production
2,450
2,100
2,175
Direct labor per pizza
0.5
Direct labor hours needed
1,225
1,050
1,088
3,363
Direct labor cost per hour
$ 12
Direct labor cost
July
August
September
Total 3rd Quarter
Required production
1,450
1,200
1,350
4,000
Direct labor per pizza
0.5
0.5
0.5
0.5
Direct labor hours needed
725
600
675
2,000
Solutions Manual
1st Quarter
2nd Quarter
3rd Quarter
4th Quarter
Total
Required production
7,000
6,725
4,000
5,350
23,075
Direct labor per pizza
3,500
3,363
2,000
2,675
11,538
Direct labor cost
B.
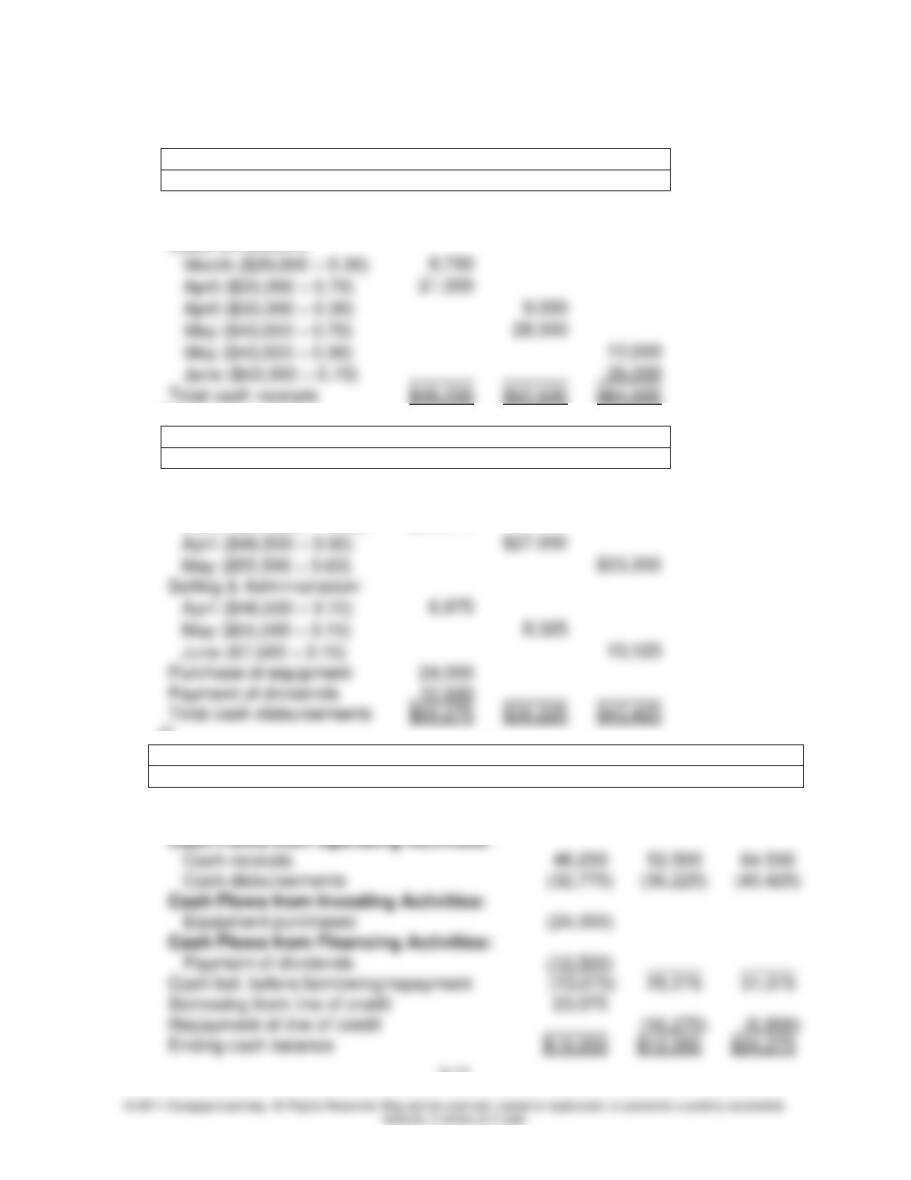
KenCor Pizza—Manufacturing Overhead Budget
January
February
March
April
May
June
Budgeted labor hours
1,050
1,300
1,150
1,225
1,050
1,088
Overhead rate
Total overhead
August
September
October
November
December
hours
Overhead rate
Total overhead
$1,938
$2,563
Chapter 9: The Use of Budgets in Planning and Decision Making
9-11
17. (LO 5—Cash receipts, disbursements, and summary budget)
A.
Hailey’s Hats—Cash Receipts Budget
For the Quarter Ending June 30
April
May
June
Cash Sales
$16,500
$15,500
$17,500
Sales on account:
B.
Hailey’s Hats—Cash Disbursements Budget
For the Period Ending June 30
April
May
June
Inventory:
March ($43,000 0.60)
$25,800
April ($46,500 0.60)
May ($55,500 0.60)
$33,300
Selling & Administration:
April ($46,500 0.15)
May ($55,500 0.15)
June (67,500 0.15)
Purchase of equipment
Payment of dividends
Total cash disbursements
C.
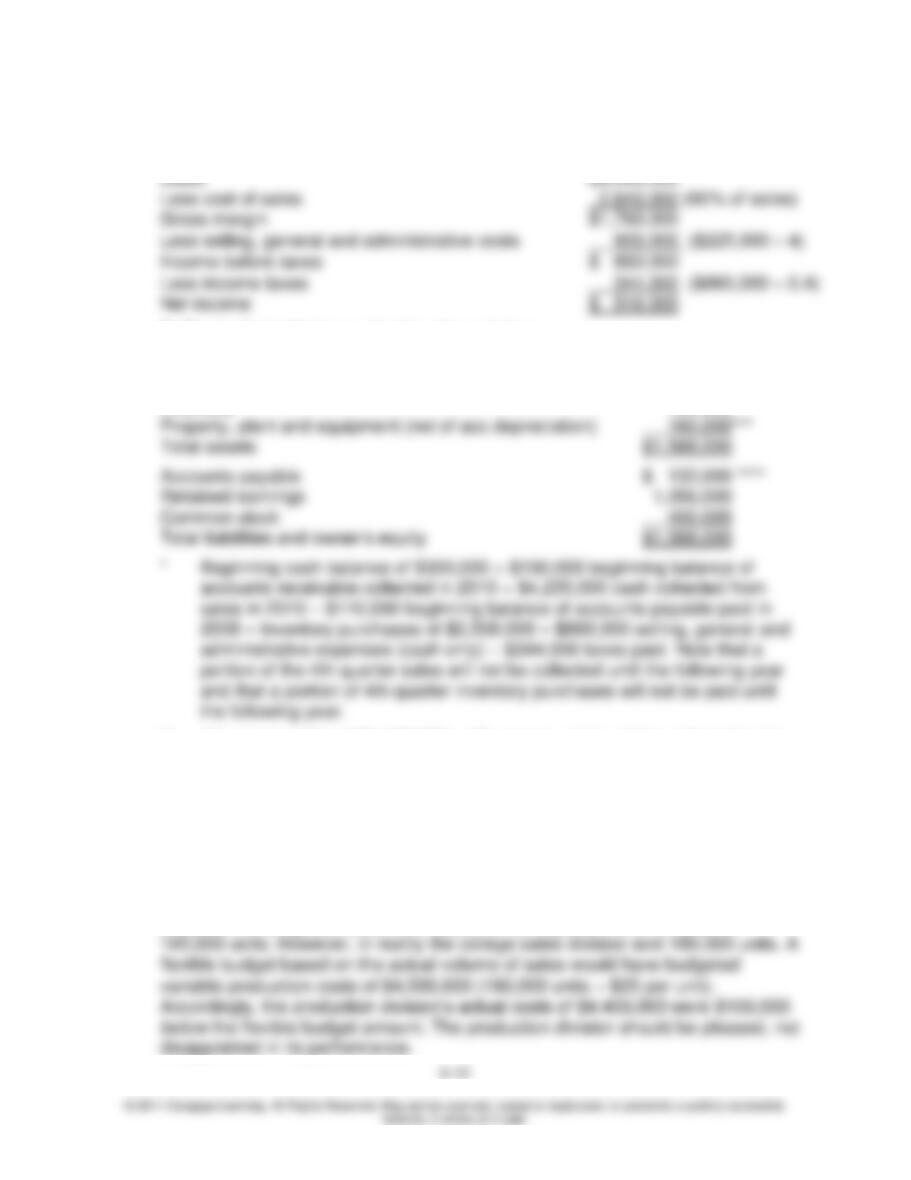
Hailey’s Hats—Summary Cash Budget
For the Quarter Ended June 30
April
May
June
Beginning Cash Balance
$10,000
$10,000
$10,000
46,200
52,500
Cash bal. before borrowing/repayment
Borrowing from line of credit
Repayment of line of credit
Solutions Manual
18. (LO 6—Budgeted income statement and balance sheet)
A. The budgeted income statement is shown below.
B. The budgeted balance sheet is shown below.
Cash $ 863,000 *
Accounts receivable 165,000**
Inventory 400,000
first quarter of 2010 = $165,000
*** $200,000 beginning balance less $40,000 depreciation expense = $160,000
**** 4th quarter inventory purchases of $660,000 ($1,100,000 60 percent) 20
percent, which will be paid in the first quarter of 2010.
19. (LO 8—Static vs. flexible budgets)
The production manager’s actual costs were higher than the budgeted costs
because the budgeted costs were based on an expected level of sales of