9-1
Boston Creamery, Inc.
Teaching Commentary
OVERVIEW
This is one of the “classic” cases in conventional managerial accounting. It has been used over the years in many of the
leading business schools in the world (Harvard, Stanford, Chicago, Wharton, HEC, INSEAD, IMD, IESE, etc.). It was
published in 1974, along with a commentary, in the leading academic journal in accounting (The Accounting Review).
At one time in the 1970s, it was voted the best accounting case of the year by Stanford’s first-year MBA class. It has
been reprinted and translated many times in many places. The current version has been updated to reflect many of the
TEACHING STRATEGY
To teach this case in one class period, it is necessary to keep moving through the numbers and not spend too much time
on any one calculation. We do not recommend going through the assignment questions in order. For this case, it is
9-2
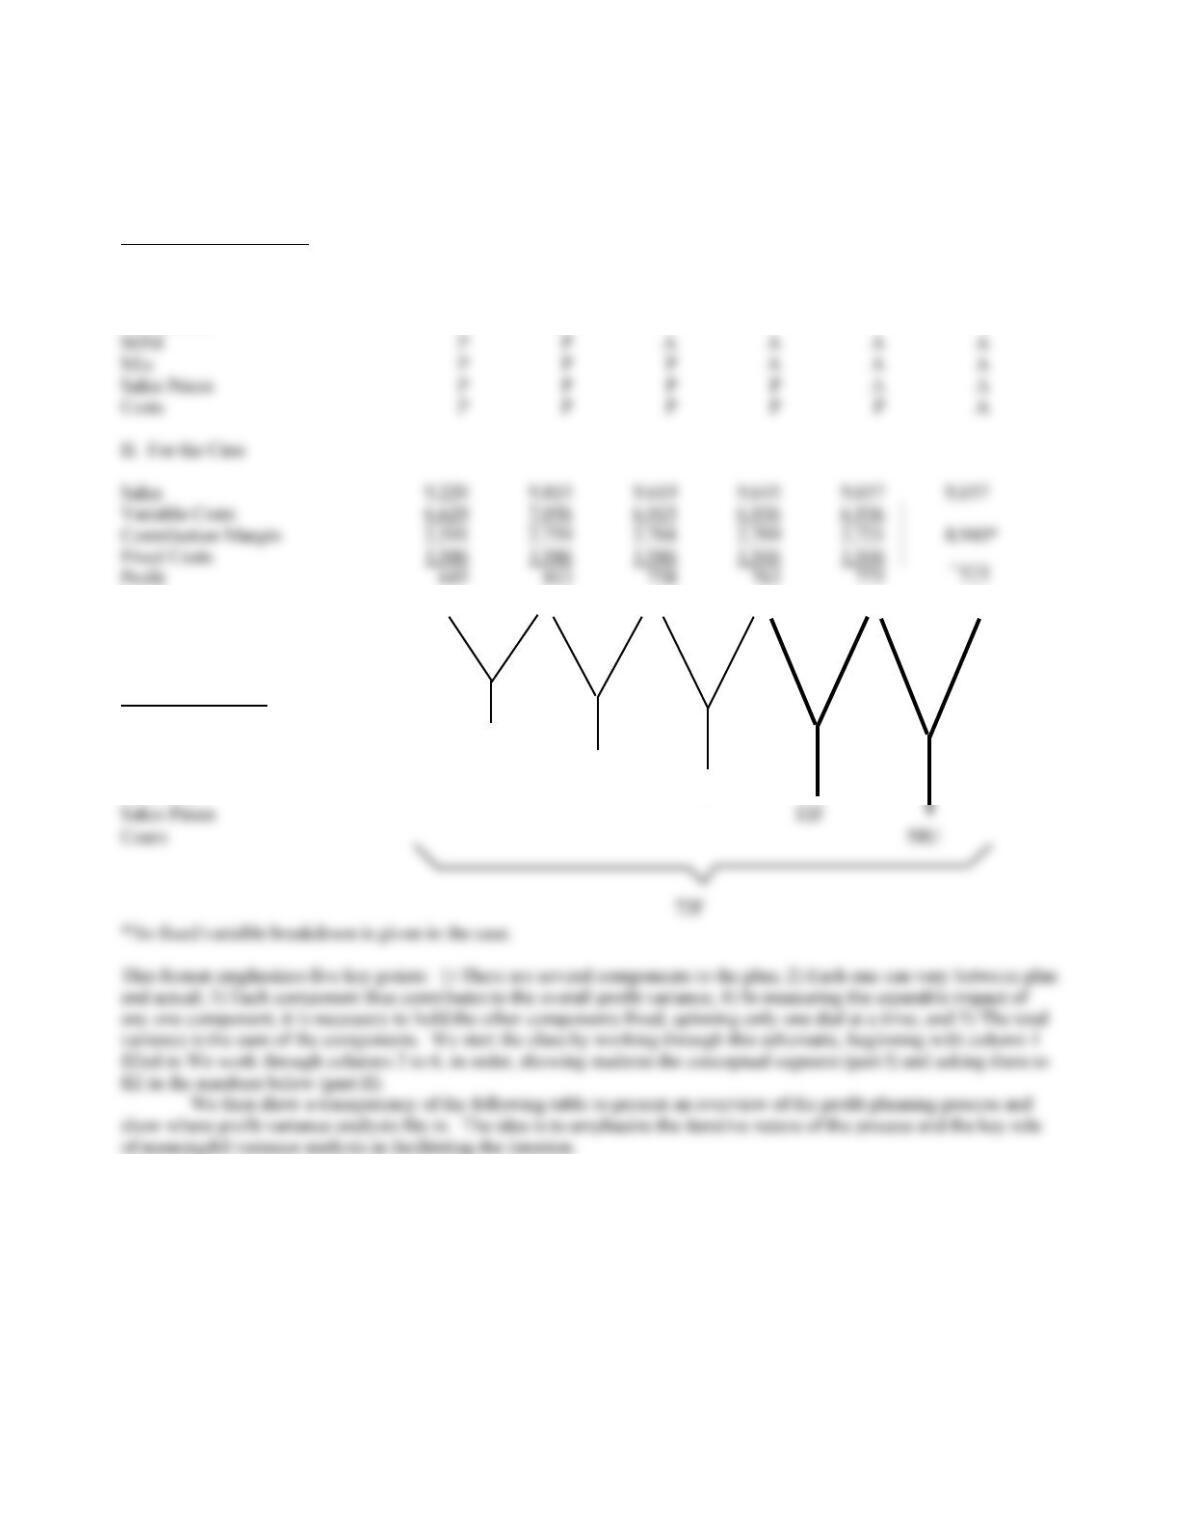
One approach here that many students find helpful is the “spin one dial at a time” framework shown below:
Spin One Dial at a Time
I. Conceptually (1) (2) (3) (4) (5) (6)
Market Size P A A A A A
168F
55U
5F
Vari ance Due To:
Market Size
SOM
Sales Mix
9-3
Formal One-Year Profit Planning and Control
The Planning Cycle
The Control Cycle
1. Set standard costs and prices (variable costs
1. Adjust the budget to actual volume (the “flexed”
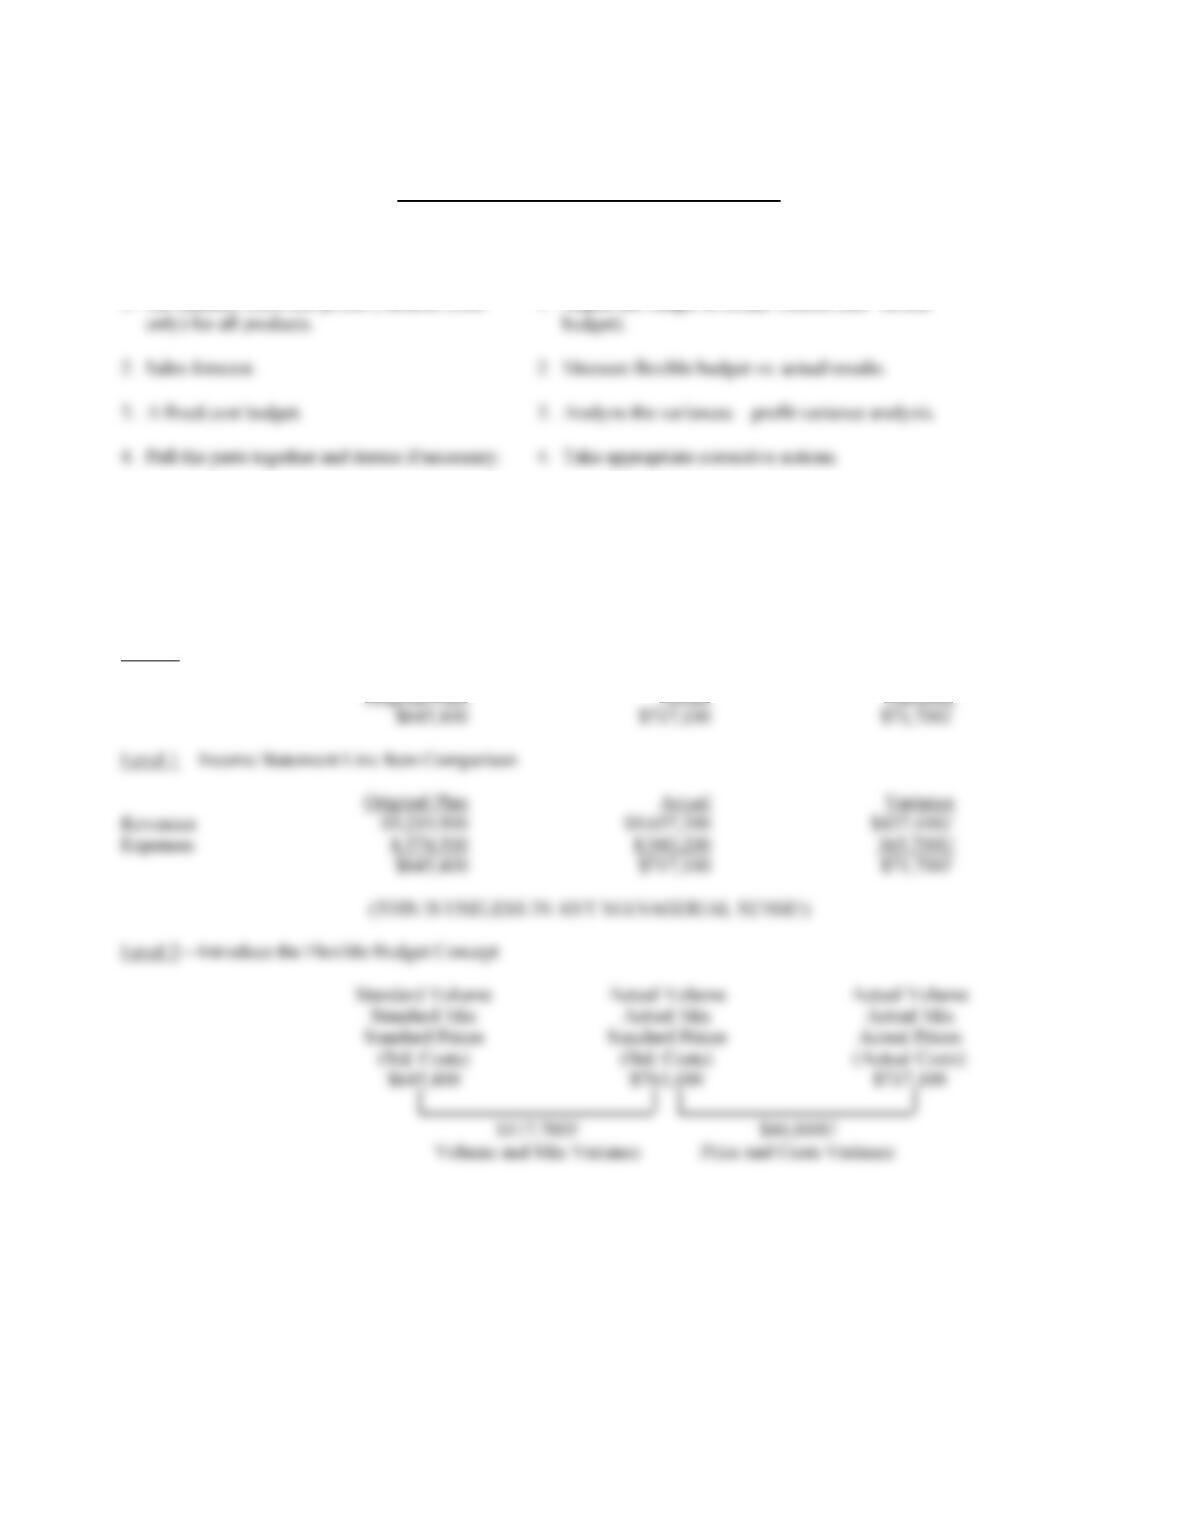
After discussing this schematic, we note that there are many different ways to organize a profit variance
analysis. We tell the students we are going to illustrate a second format that “peels the onion,” one level at a time, and
shows a specific calculational formula for each of the components. We emphasize that the components are the same as
in the “spin the dial” format—they are just arrived at differently. We then go through the following analysis for levels 0
through 4:
Level 0
Original Plan Actual Variance
9-4
Level 3
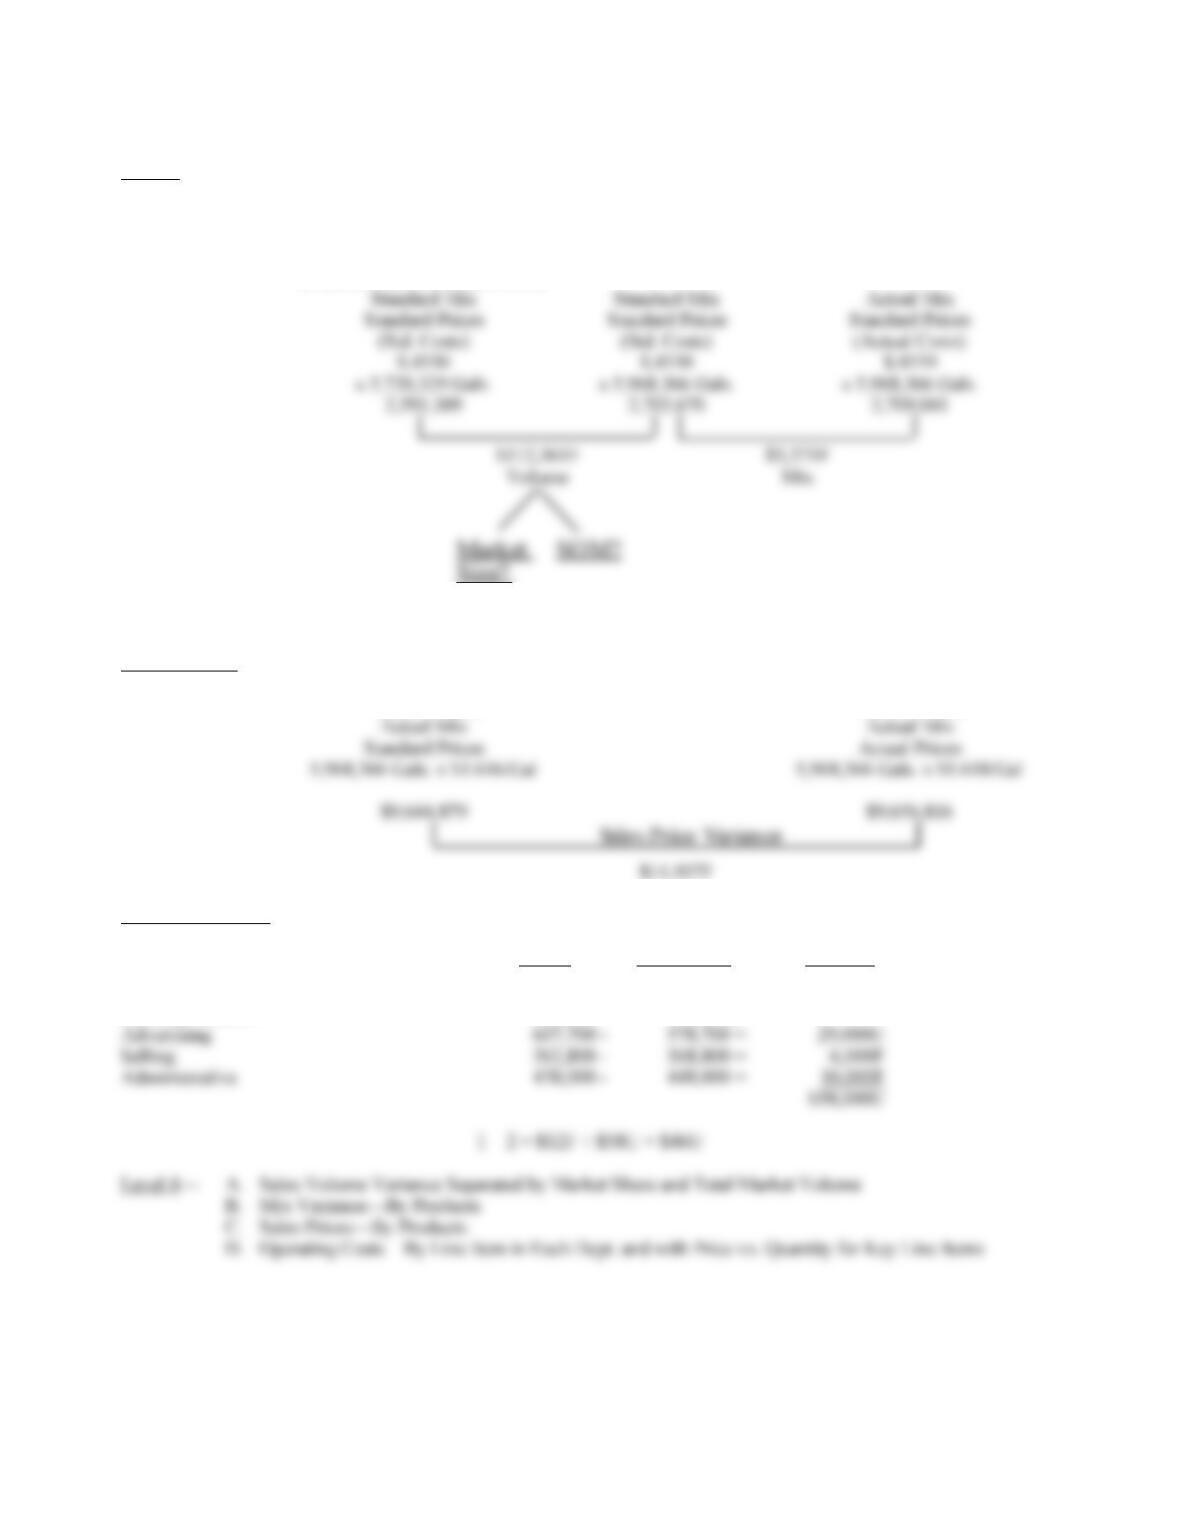
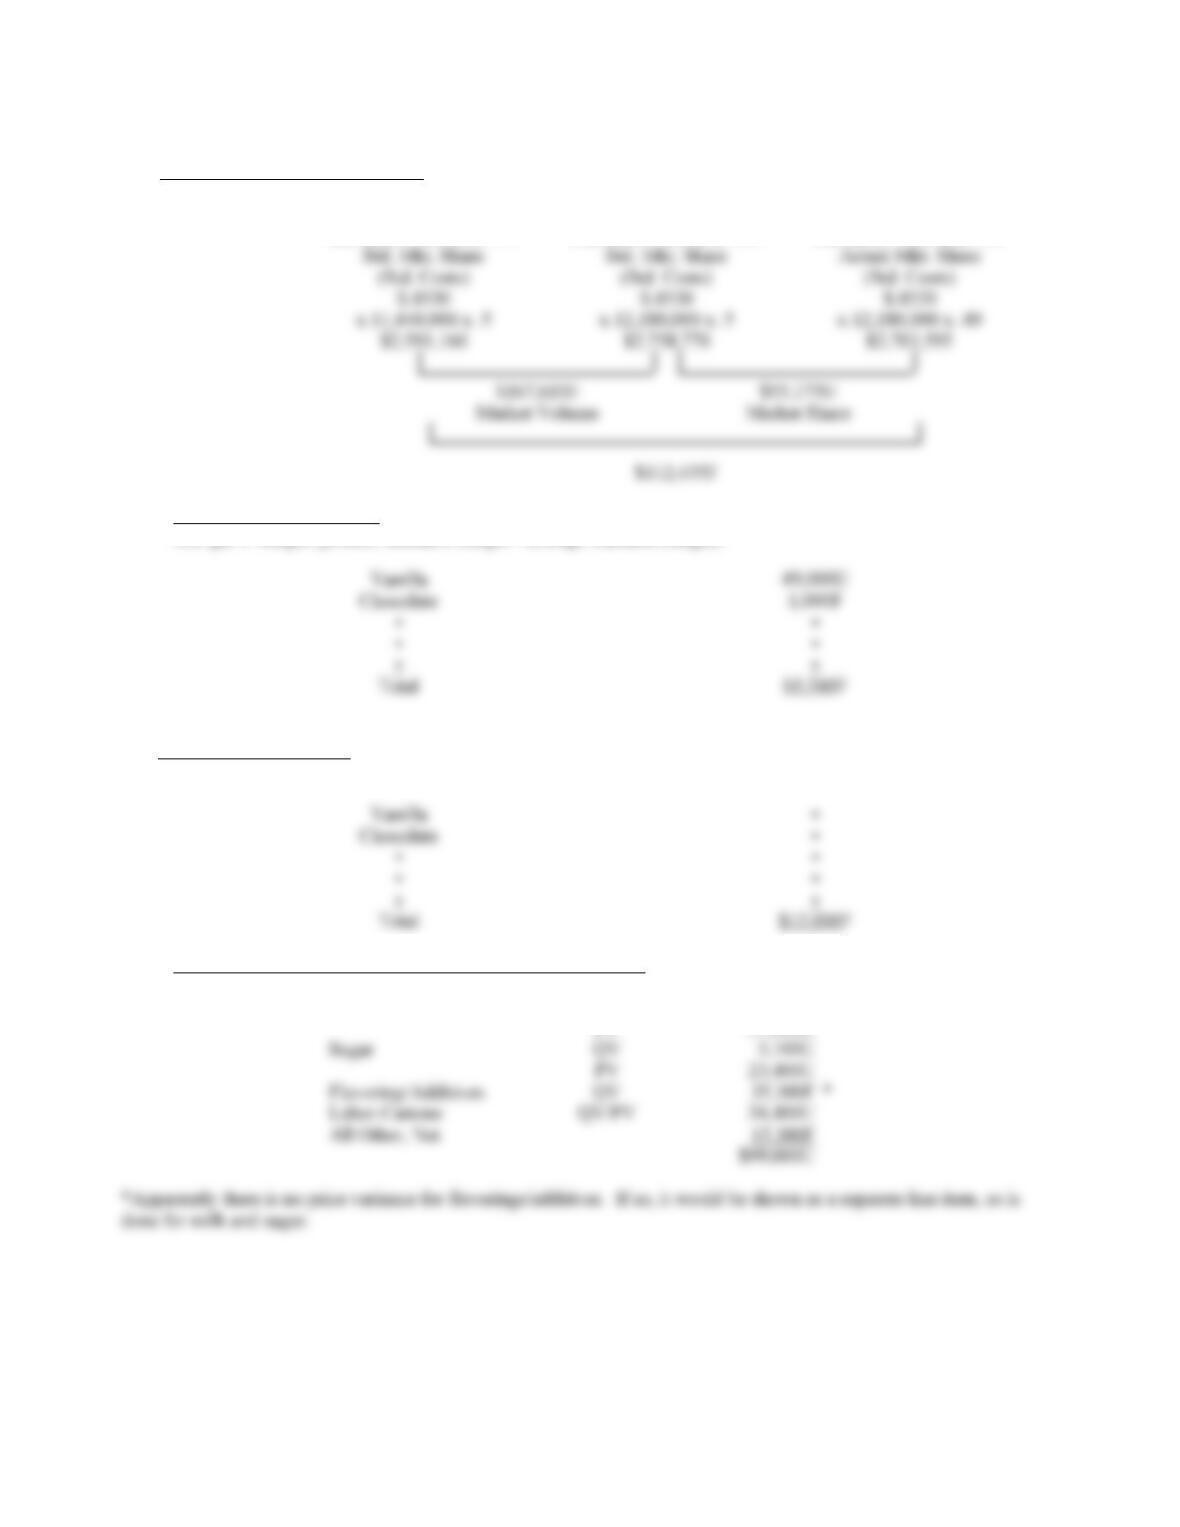
3A.—Separate Sales Volume and Sales Mix Variances
Standard Volume Actual Volume Actual Volume
(Planned Mkt. x Planned SOM)
3B—Separate Sales Price Variances From Operating Cost Variances
1. Sales Prices
Actual Volume Actual Volume
2. Operating Costs
Spending
Actual Flex Budget Variance
Cost of Goods Manufactured $6,824,900 – $6,725,900 = $99,000U
Delivery 706,800 – 760,800 = 54,000F
9-5
4A. Market Volume and Market Share
Forecast Market Actual Market Actual Market
Standard Prices and Mix Standard Prices and Mix Standard Prices and Mix
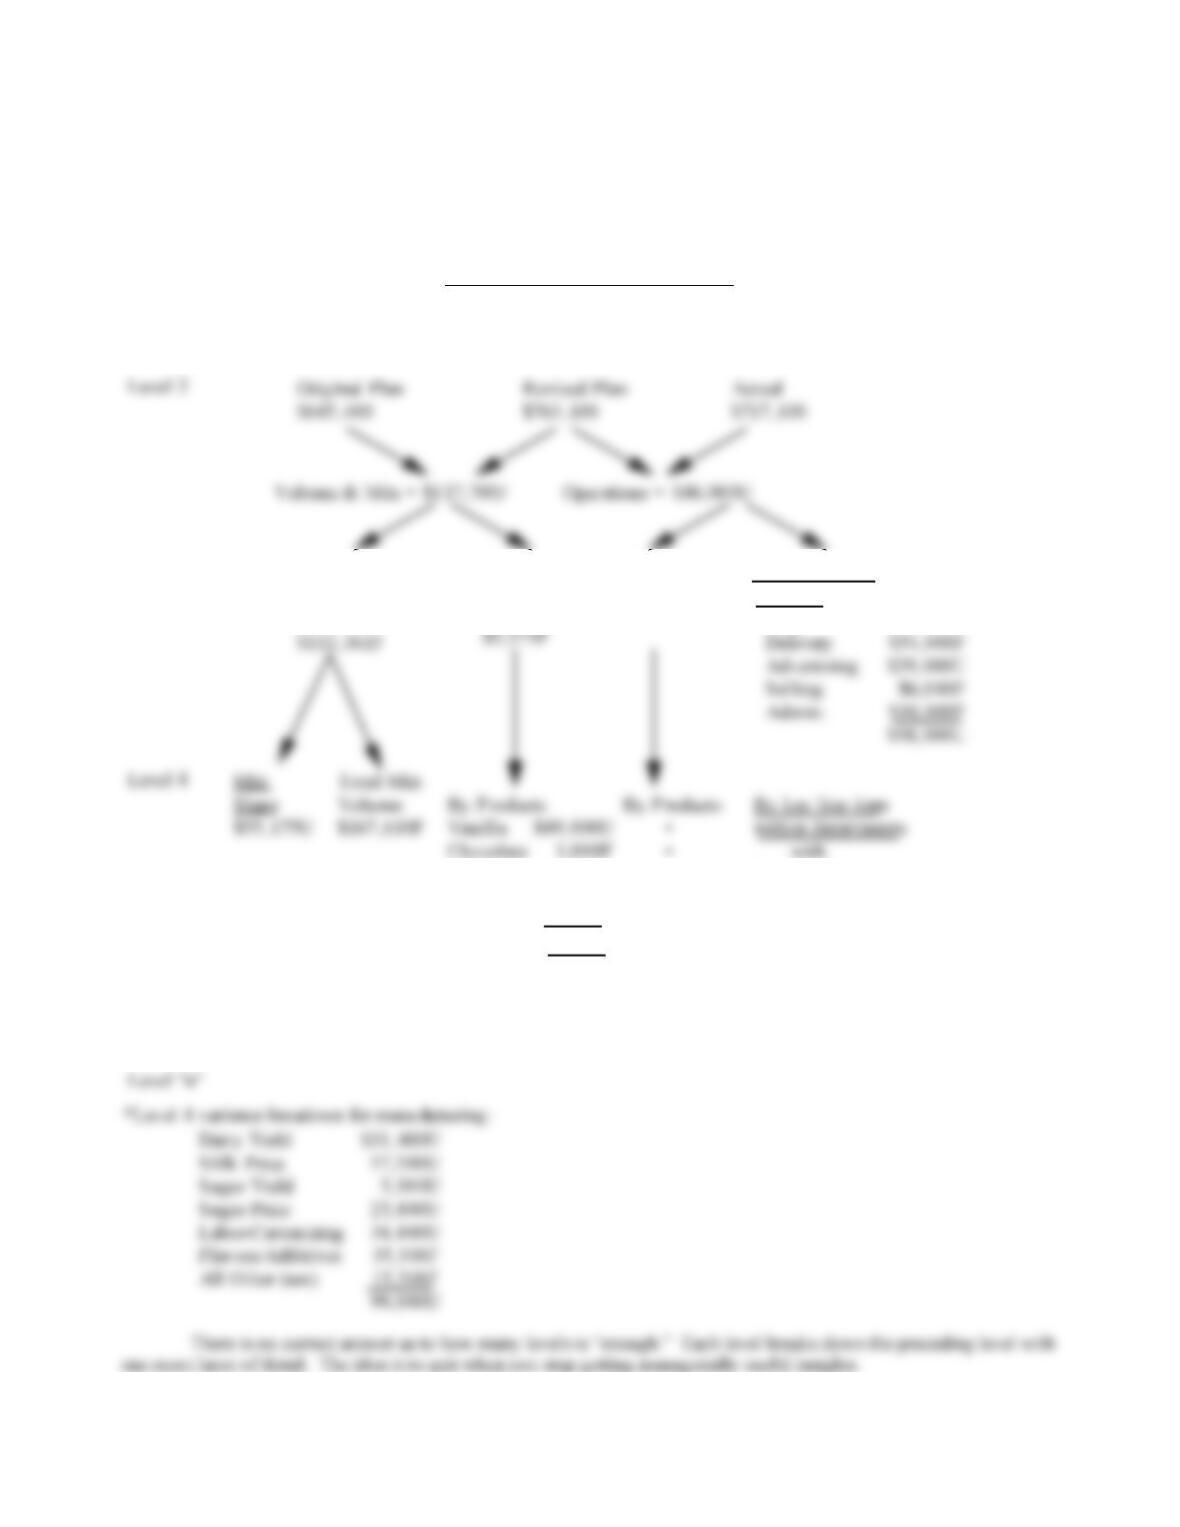
4B. Mix Variance By Products
Act. gal x Margin (product standard margin – average standard margin)
4C. Sales Prices By Products
(Actual Price – Standard Price) x Actual Volume
4D. Manufacturing Department Cost Variances—Key Line Items
Milk QV $31,400U
PV 57,300U
9-6
Summary of the Calculations
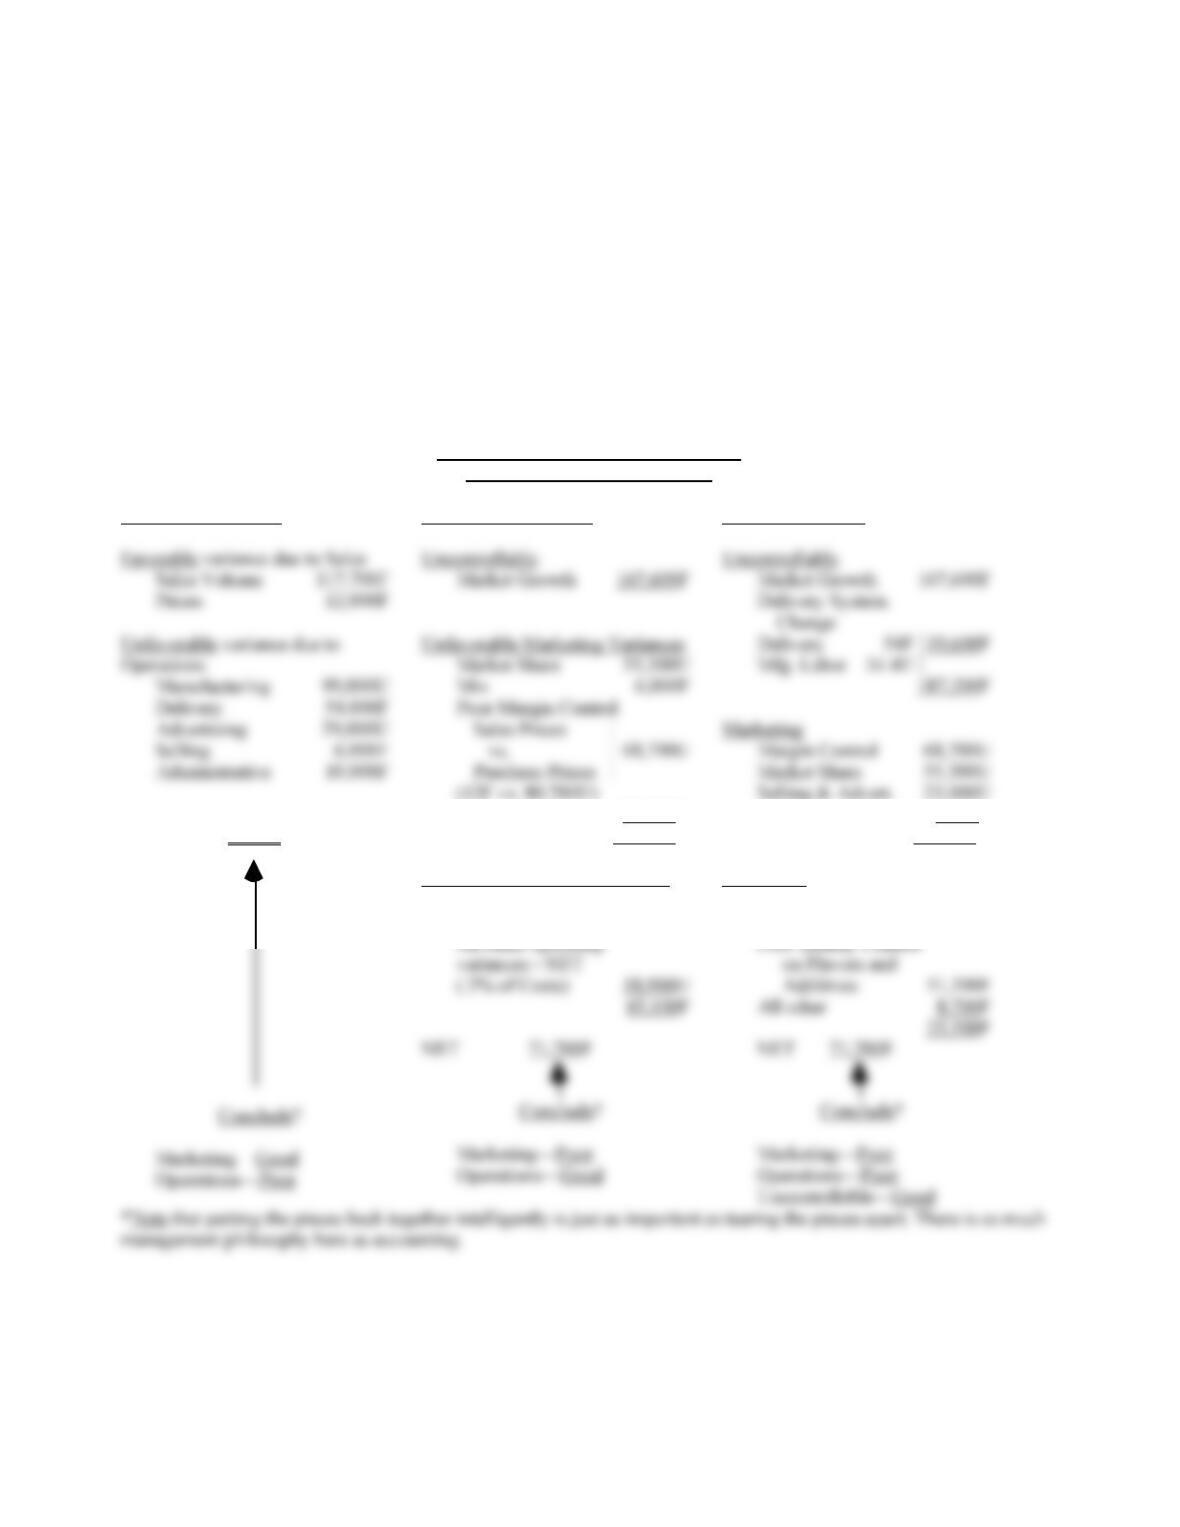
Following is a recap of the “peel the onion” approach down through four levels:
Recap of
Multi-Level Profit Variance Analysis
Level 0
Level 3
Level 5
Original Plan
$645,400
vs. Actual
$717,100 = $71,700F
Volume
248, 000 gal F
x $.4539 =
Mix
$.00 1U
x 5,968,000 =
Sales Price
$12, 000F Operating Costs
By Depts:
Mfg.
Rate vs. Qty.
Breakdown on key
item s*
$99, 000U
•
•
•
$12, 000F
•
•
•
•
•
•
$5,3 40F
•
•
•
•
•
•
•
•
•
•
•
•
•
•
•
•
•
•
9-7
We try to cover all of the above calculations in no more than an hour to save thirty minutes for the “so what”
question. After discussing these two different approaches to calculating the variance components, we note that we are
only half finished. Calculating the components is half the task, but the other half is to put the components together to tell
a meaningful story about what happened.
Telling a Story from the Calculations
What story do the components tell for Boston Creamery for 1973? The case shows one possible story—Frank
Robert’s preliminary report. Jim Peterson, however, has raised several questions about this format. A “level four”
analysis in the “peel the onion” format addresses most of Peterson’s concerns. But how can the pieces be put back
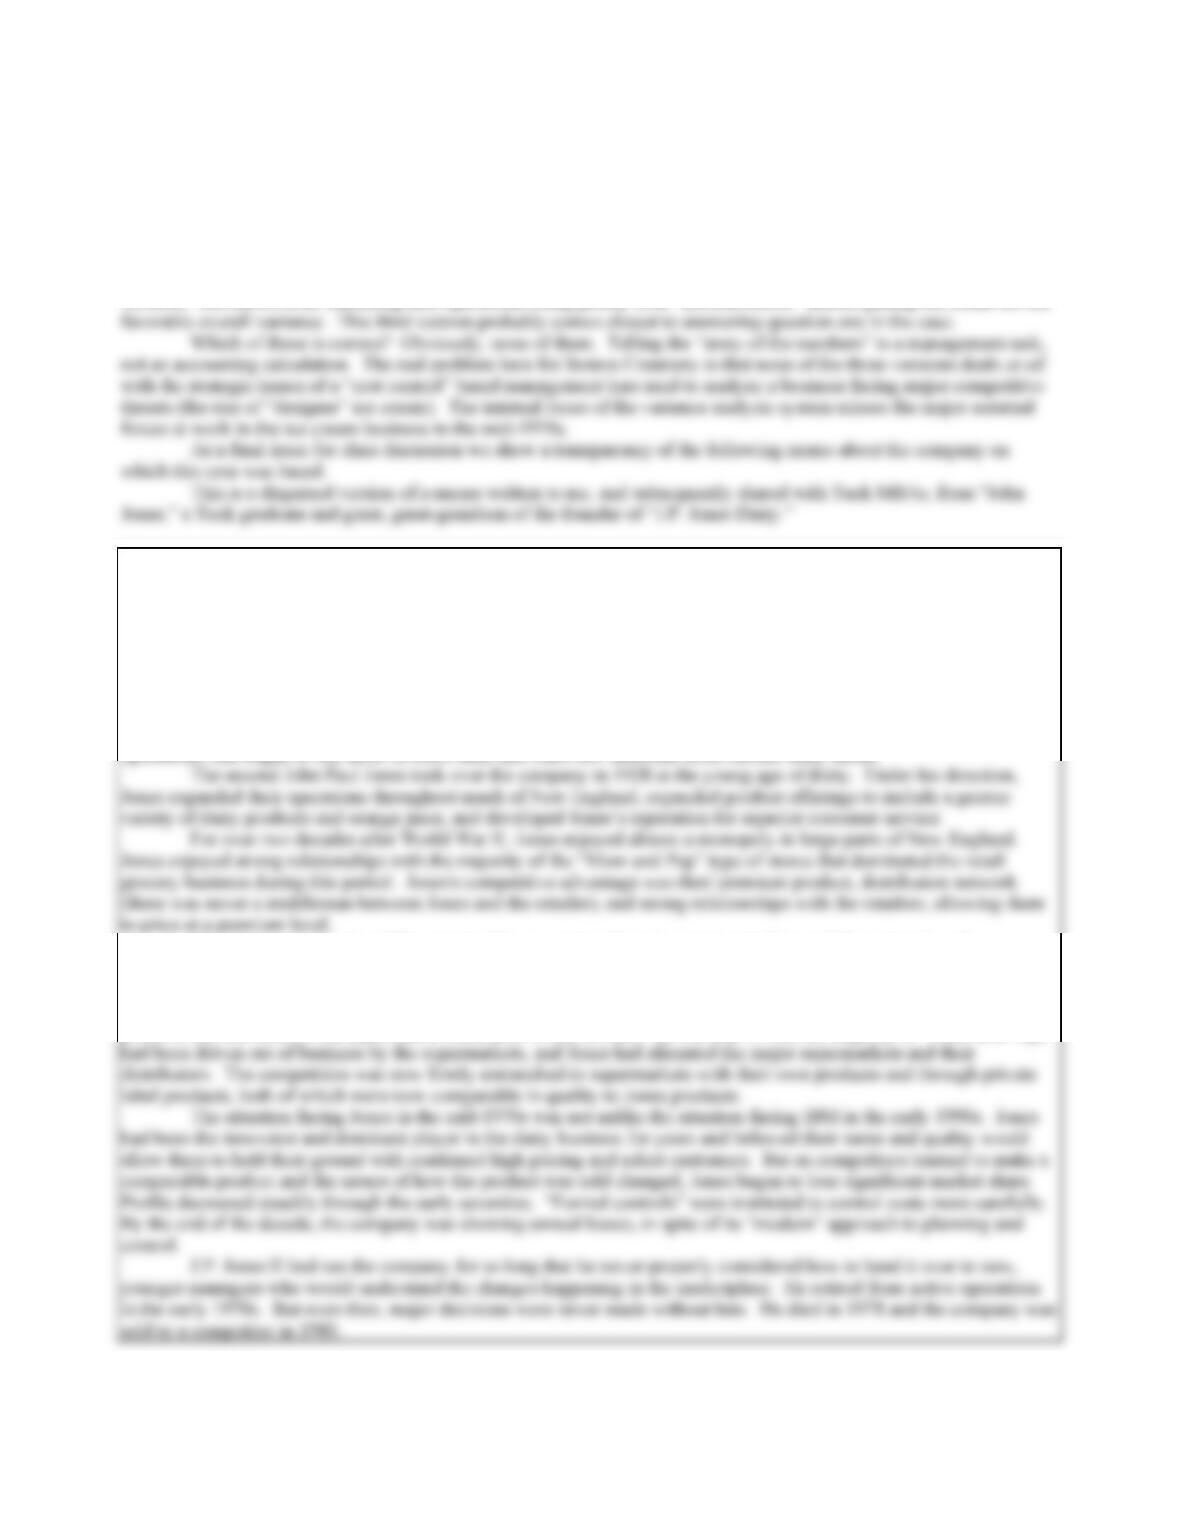
together most meaningfully? The following table presents three very different stories, all drawn from the same
components:
From the Calculations to the “Story”
Three Versions of the “Story”
I. Per Marketing VP
II. Per Operations VP
III. Per Controller
Uncontrollable—Good
NET 71,700F
Selling & Advert. 23,000U
141,000U
Favorable Operations Variances
Delivery 54,000F
Administrative 10,000F
Mix 6,000F
141,000U
Operations
Poor Dairy Yield 31,400U
Poor Sugar Yield 3,100U
9-8
FROM THE “STORY” (WHICH ONE?!) TO THE RECOMMENDATIONS FOR ACTION
The first column is Frank Robert’s preliminary report in which Marketing looks good and Operations looks bad.
The middle column is the report that John Parker constructed to “neutralize” Robert’s version. In Parker’s version,
Operations looks good and Marketing looks bad. This version is one answer to question three in the case. The third
version is one produced by the controller when Jim Peterson asked him to comment on the other two conflicting
versions. His shows both Marketing and Operations doing poorly with “uncontrollable” factors getting the credit for the
*M E M O R A N D U M*
The Boston Creamery case takes place at the beginning of the final stage in J.P. Jones’s career as head of the
Jones family business.
The company evolved out of a Chester Vermont dairy farm owned by John Paul Jones, grandfather of the
current (1973) CEO of the same name. Jones specialized in local delivery of premium quality milk. Paul Jones, son of
the founder, took over the company early in the twentieth century and established Jones as the premier dairy producer in
the Hartford area. He established a large fleet of delivery vehicles (initially horse drawn), established large bottling
operations, and began to buy most of Jones milk and other raw materials from outside dairy farms.
The sixties saw the rise of the supermarket as a major force in grocery retailing and the narrowing of
differentiation in most dairy products. Rather than lower their prices to the levels that supermarkets demanded, Jones
made a strategic decision to keep prices at their high levels so as not to undercut the prices of their primary customers,
the “Mom and Pop” stores, and so that their healthy margins could be retained. Unfortunately, the company did not
perceive the relevance of the supermarket trend until it was too late. By the mid–1970s, the majority of “Mom and Pops”

9-9
We spend whatever time we have left discussing the issues raised in the memo. We try to close by asking