Solution
1. The accompanying table shows data from the Penn World Table, Version 8.0, for
real GDP per capita in 2005 U.S. dollars for Argentina, Ghana, South Korea, and the
United States for 1960, 1970, 1980, 1990, 2000, and 2011.
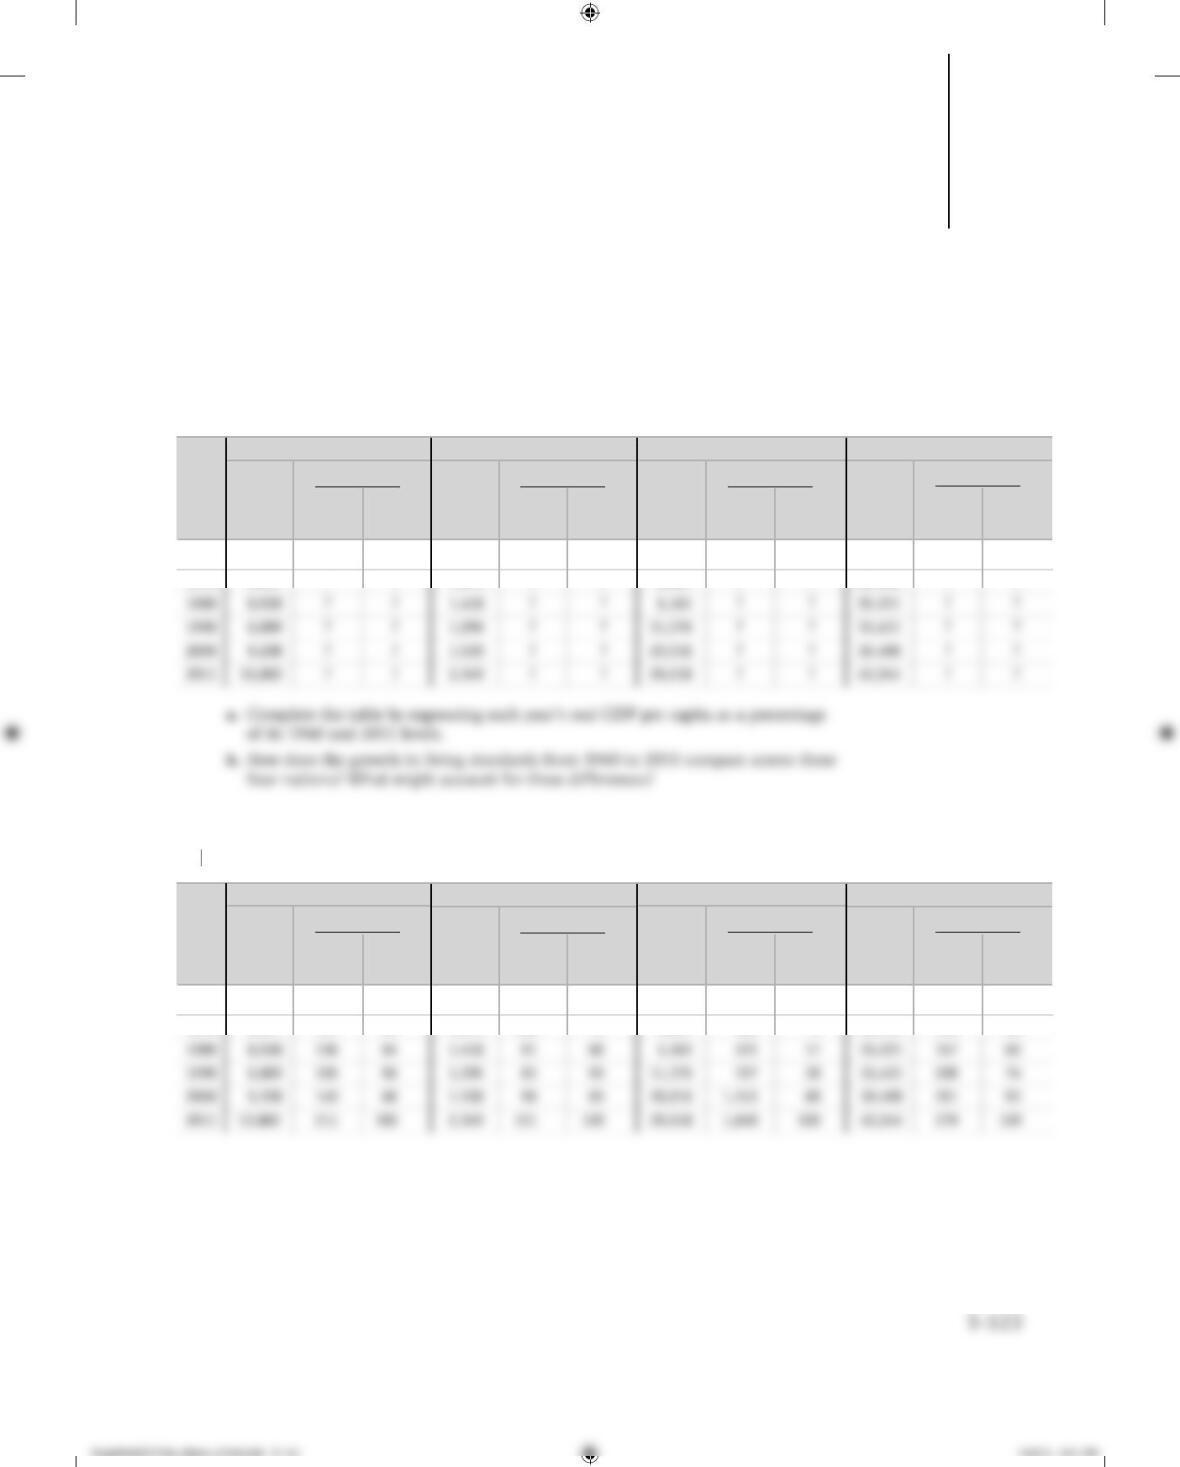
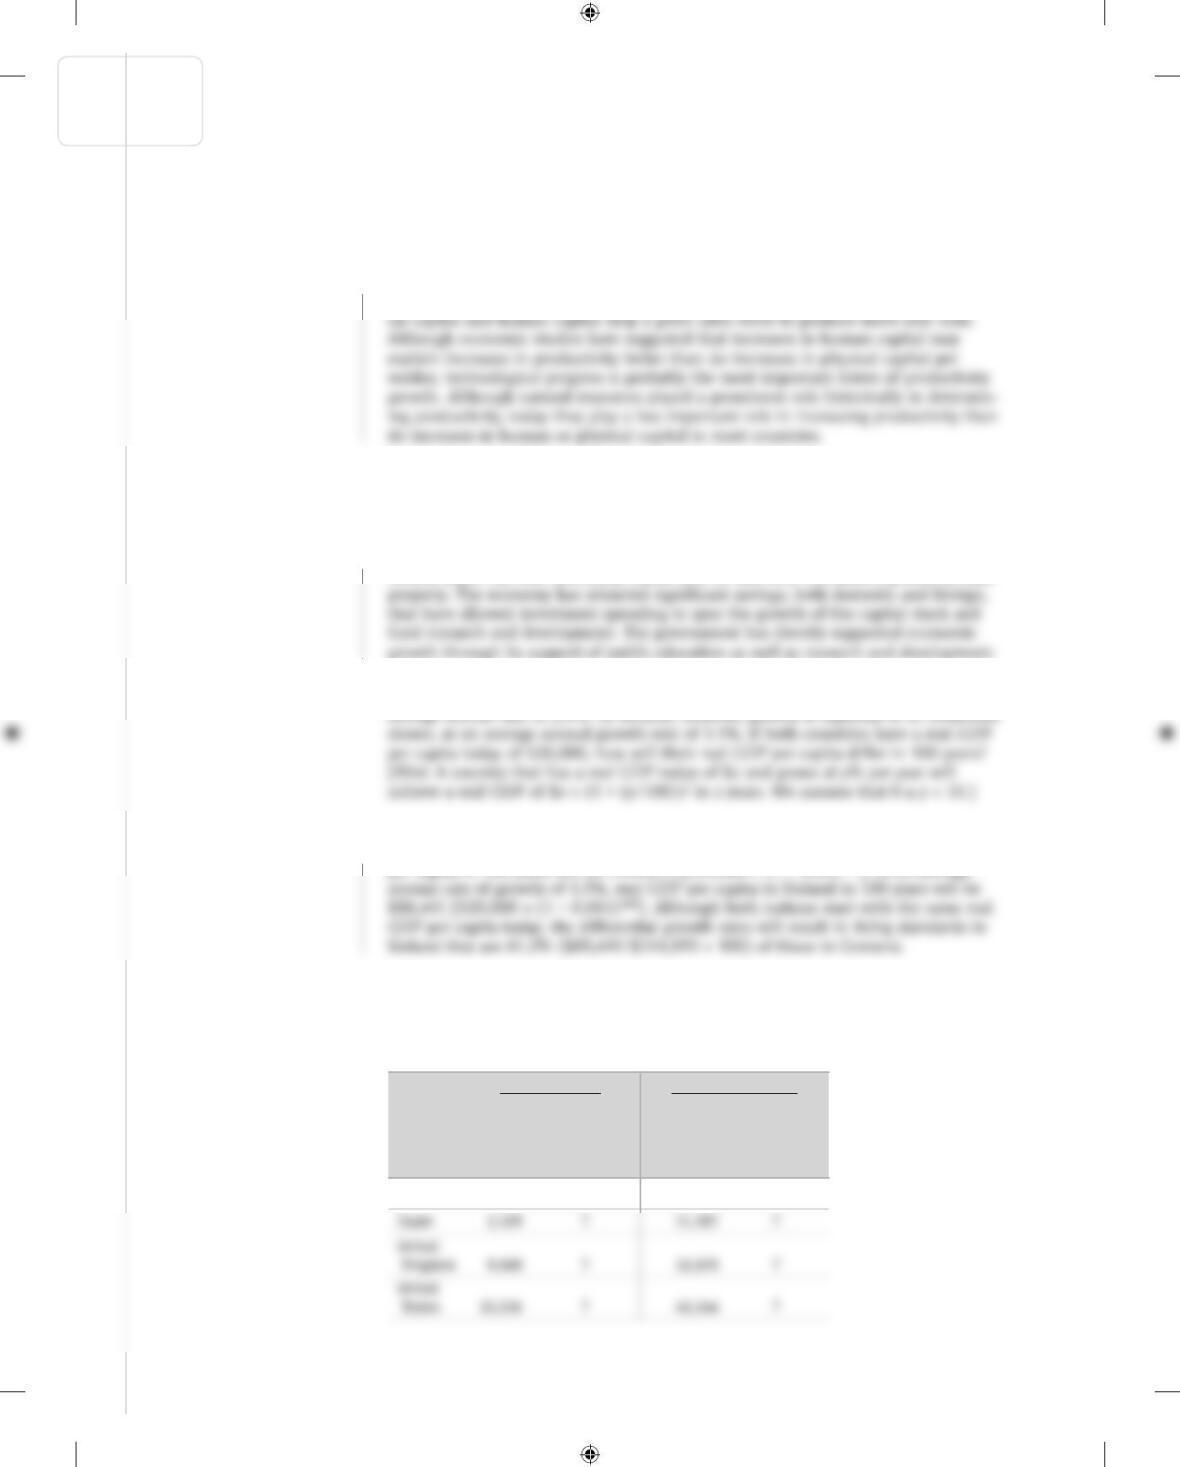
1. a. The accompanying table shows each nation’s real GDP per capita in terms of its
1960 and 2011 levels.
Real GDP
per capita
(2005
dollars)
1960 $6,585 100% 47% $1,557 100% 66% $1,610 100% 5% $15,136 100% 36%
1970 8,147 124 59 1,674 108 71 2,607 162 9 20,115 133 48
Year
1960
real GDP
per capita
2011
real GDP
per capita
Per centage of Real GDP
per capita
(2005
dollars)
1960
real GDP
per capita
2011
real GDP
per capita
Per centage of Real GDP
per capita
(2005
dollars)
1960
real GDP
per capita
2011
real GDP
per capita
Per centage of Real GDP
per capita
(2005
dollars)
1960
real GDP
per capita
2011
real GDP
per capita
Per centage of
Argentina GhanaGhana South Korea United States
Long-Run Economic Growth
Real GDP
per capita
(2005
dollars)
1960 $6,585 ? ? $1,557 ? ? $1,610 ? ? $15,136 ? ?
1970 8,147 ? ? 1,674 ? ? 2,607 ? ? 20,115 ? ?
Year
1960
real GDP
per capita
2011
real GDP
per capita
Per centage of Real GDP
per capita
(2005
dollars)
1960
real GDP
per capita
2011
real GDP
per capita
Per centage of Real GDP
per capita
(2005
dollars)
1960
real GDP
per capita
2011
real GDP
per capita
Per centage of Real GDP
per capita
(2005
dollars)
1960
real GDP
per capita
2011
real GDP
per capita
Per centage of
Argentina GhanaGhana South Korea United States
9
CHAPTER
Solution
b. South Korea experienced the greatest increase in living standards from 1960 to
2011; in 2011 it produced 1,840% ($29.618/$1,610 × 100) of what it produced
in 1960. Argentina experienced only a modest growth in living standards over
the same period, and Argentina’s path was less consistent than that of Ghana.
Compared with real GDP per capita in 1960, the United States in 2011 produced
279% ($42,244/$15,136 × 100) of what it produced in 1960. The growth in liv-
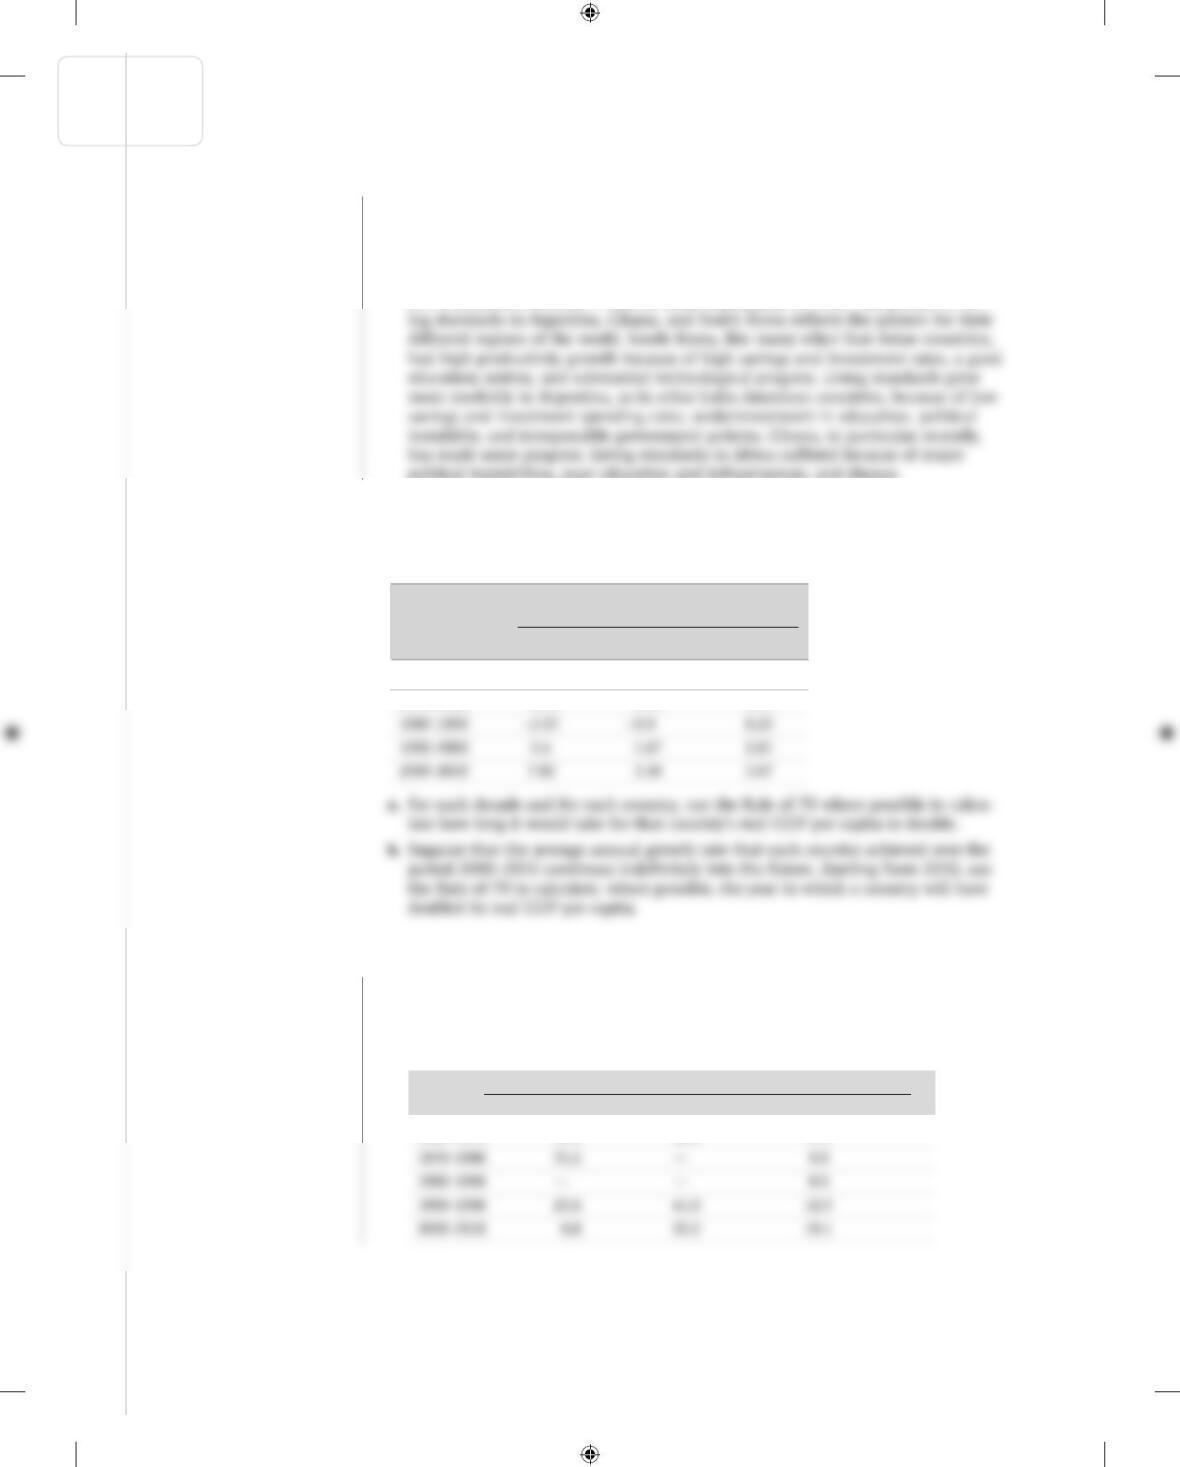
2. The accompanying table shows the average annual growth rate in real GDP per cap-
ita for Argentina, Ghana, and South Korea using data from the Penn World Table,
Version 8.0, for the past few decades.
2. a. The accompanying table shows the number of years it would take for real GDP per
capita to double according to the Rule of 70 using the average annual growth rate
in real GDP per capita per decade in each country. Values corresponding to years
with negative growth rates are left uncalculated because we cannot apply the Rule
of 70 to a negative growth rate.
Average annual growth rate of
real GDP per capita
Years Argentina Ghana South Korea
1960 –1970 2.15% 0.73% 4.94%
1970–1980 0.93 −1.64 7.07
Years for real GDP per capita to double according to the Rule of 70
Years Argentina Ghana South Korea
1960–1970 32.6 95.9 14.2
S-124 CHAPTER 9 LONG-RUN ECONOMIC GROWTH
KrugWellsECPS4e_Macro_CH09.indd S-124KrugWellsECPS4e_Macro_CH09.indd S-124 1/29/15 8:07 AM1/29/15 8:07 AM
Solution
b. If each nation continues to grow as it did from 2000 to 2010, real GDP per
capita will have doubled in Argentina by 2019, in Ghana by 2032 and in South
Korea by 2029.
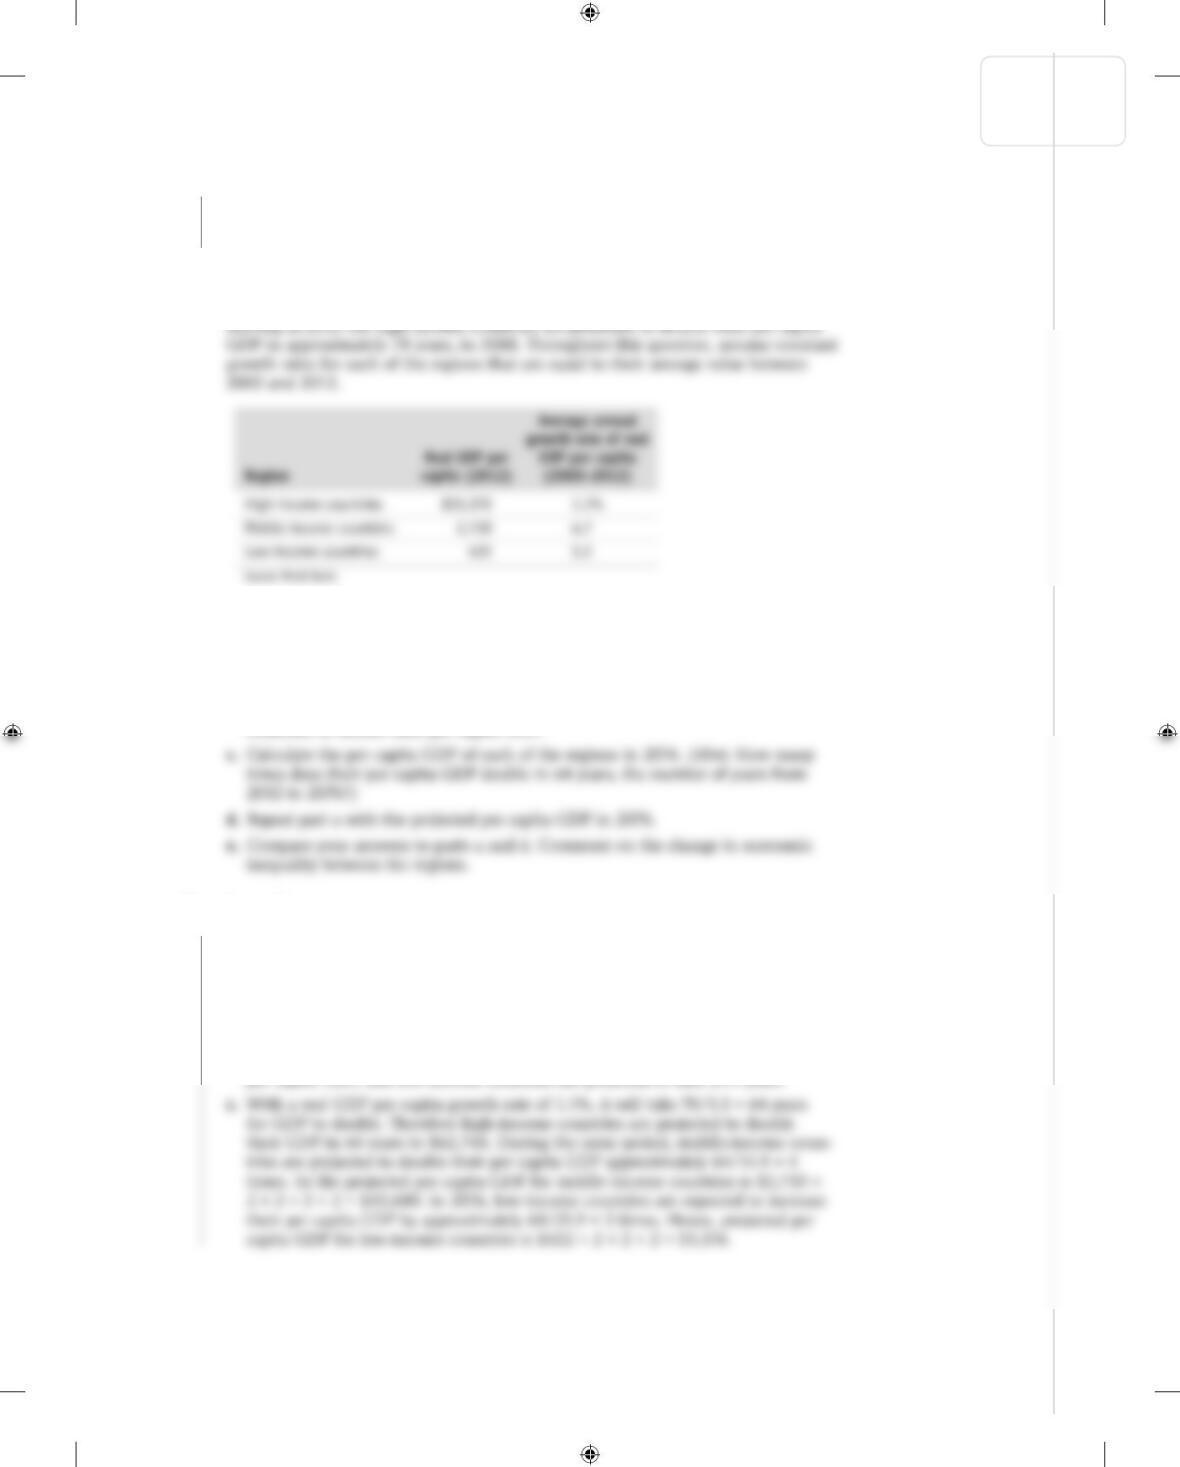
3. The accompanying table provides approximate statistics on per capita income levels
and growth rates for regions defined by income levels. According to the Rule of 70,
a. Calculate the ratio of per capita GDP in 2012 of the following:
i. Middle-income to high-income countries
ii. Low-income to high-income countries
iii. Low-income to middle-income countries
b. Calculate the number of years it will take the low-income and middle-income
countries to double their per capita GDP.
3. a. i. The ratio of per capita GDP in 2012 of middle-income to high-income coun-
tries is 0.087 or 8.7%.
ii. The ratio of per capita GDP in 2012 of low-income to high-income countries
is 0.014 or 1.4%.
iii. The ratio of per capita GDP in 2012 of low-income to middle-income coun-
tries is 0.155 or 15.5%.
b. Middle-income countries are projected to take 70/4.7 = 14.9 years to double their
per capita GDP, and low-income countries are projected to take 21.9 years.
CHAPTER 9 LONG-RUN ECONOMIC GROWTH S-125
KrugWellsECPS4e_Macro_CH09.indd S-125KrugWellsECPS4e_Macro_CH09.indd S-125 1/29/15 8:07 AM1/29/15 8:07 AM
d. Using the projected per capita GDP figures in 2076, the percentages are as follows:
i. Middle-income to high-income countries: 0.696 or 69.6%
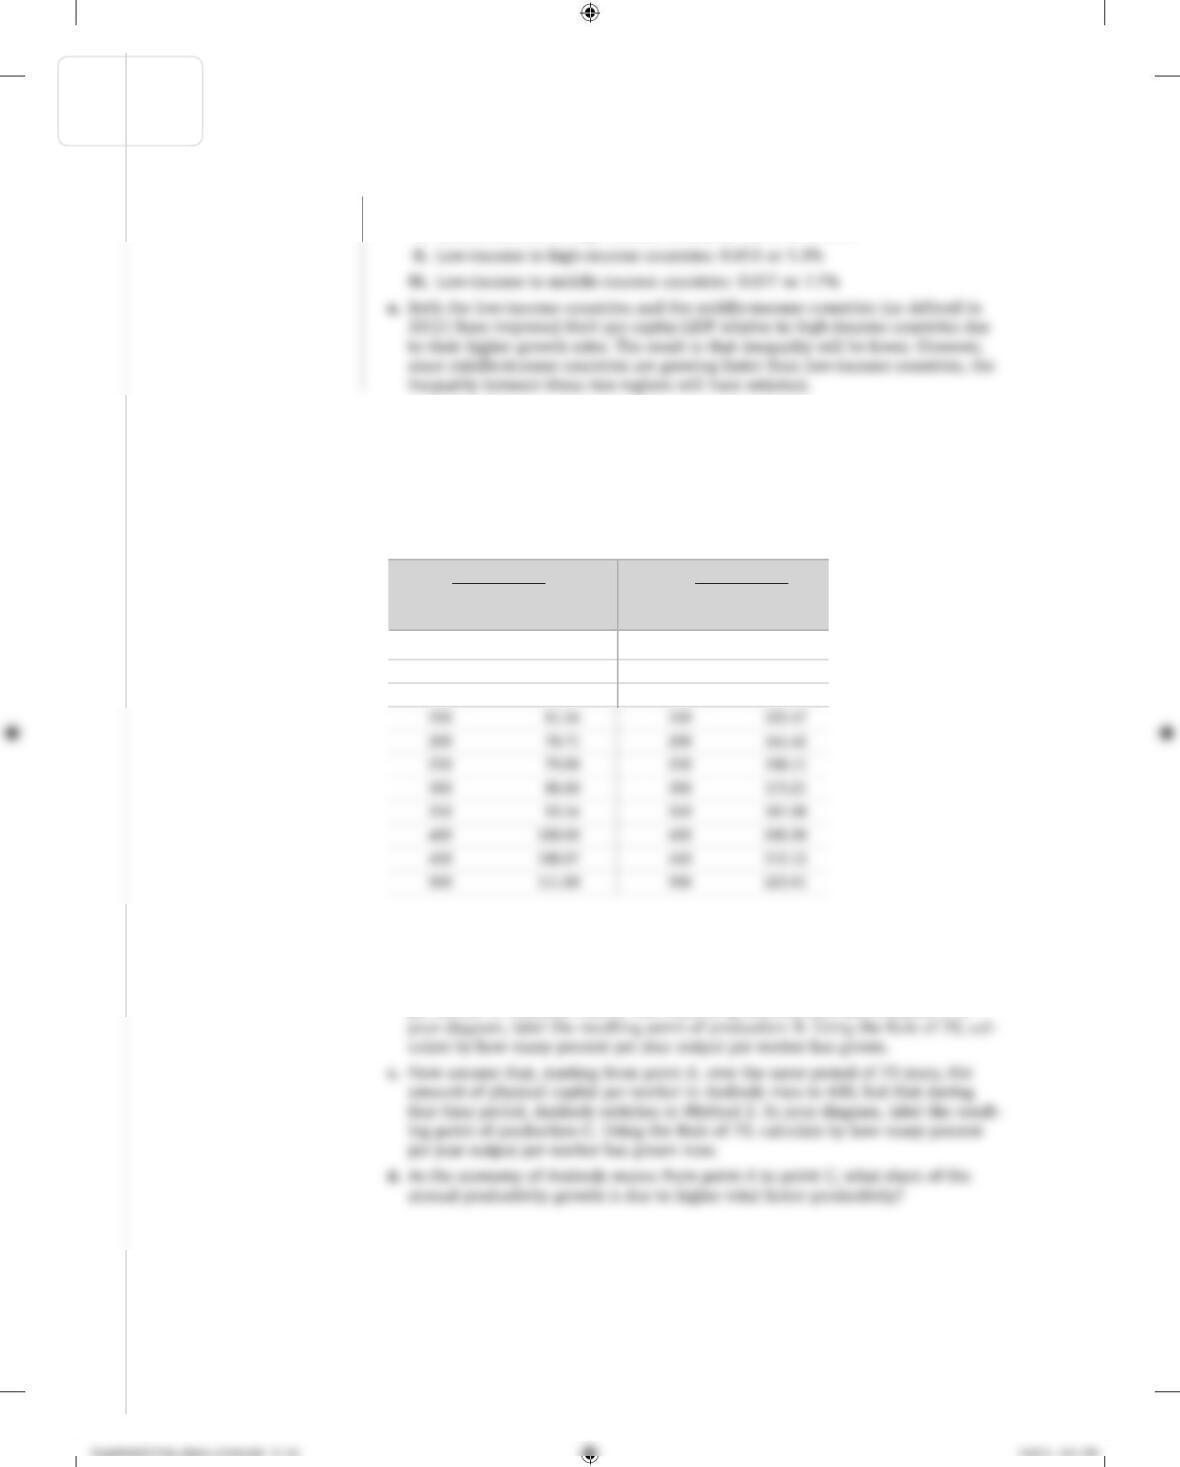
4. The country of Androde is currently using Method 1 for its production function.
By chance, scientists stumble onto a technological breakthrough that will enhance
Androde’s productivity. This technological breakthrough is reflected in another
production function, Method 2. The accompanying table shows combinations of
physical capital per worker and output per worker for both methods, assuming that
human capital per worker is fixed.
Method 1 Method 2
Real GDP
per worker
Physical capital
per worker
Real GDP
per worker
Physical capi-
tal per worker
0 0.00 0 0.00
50 35.36 50 70.71
100 50.00 100 100.00
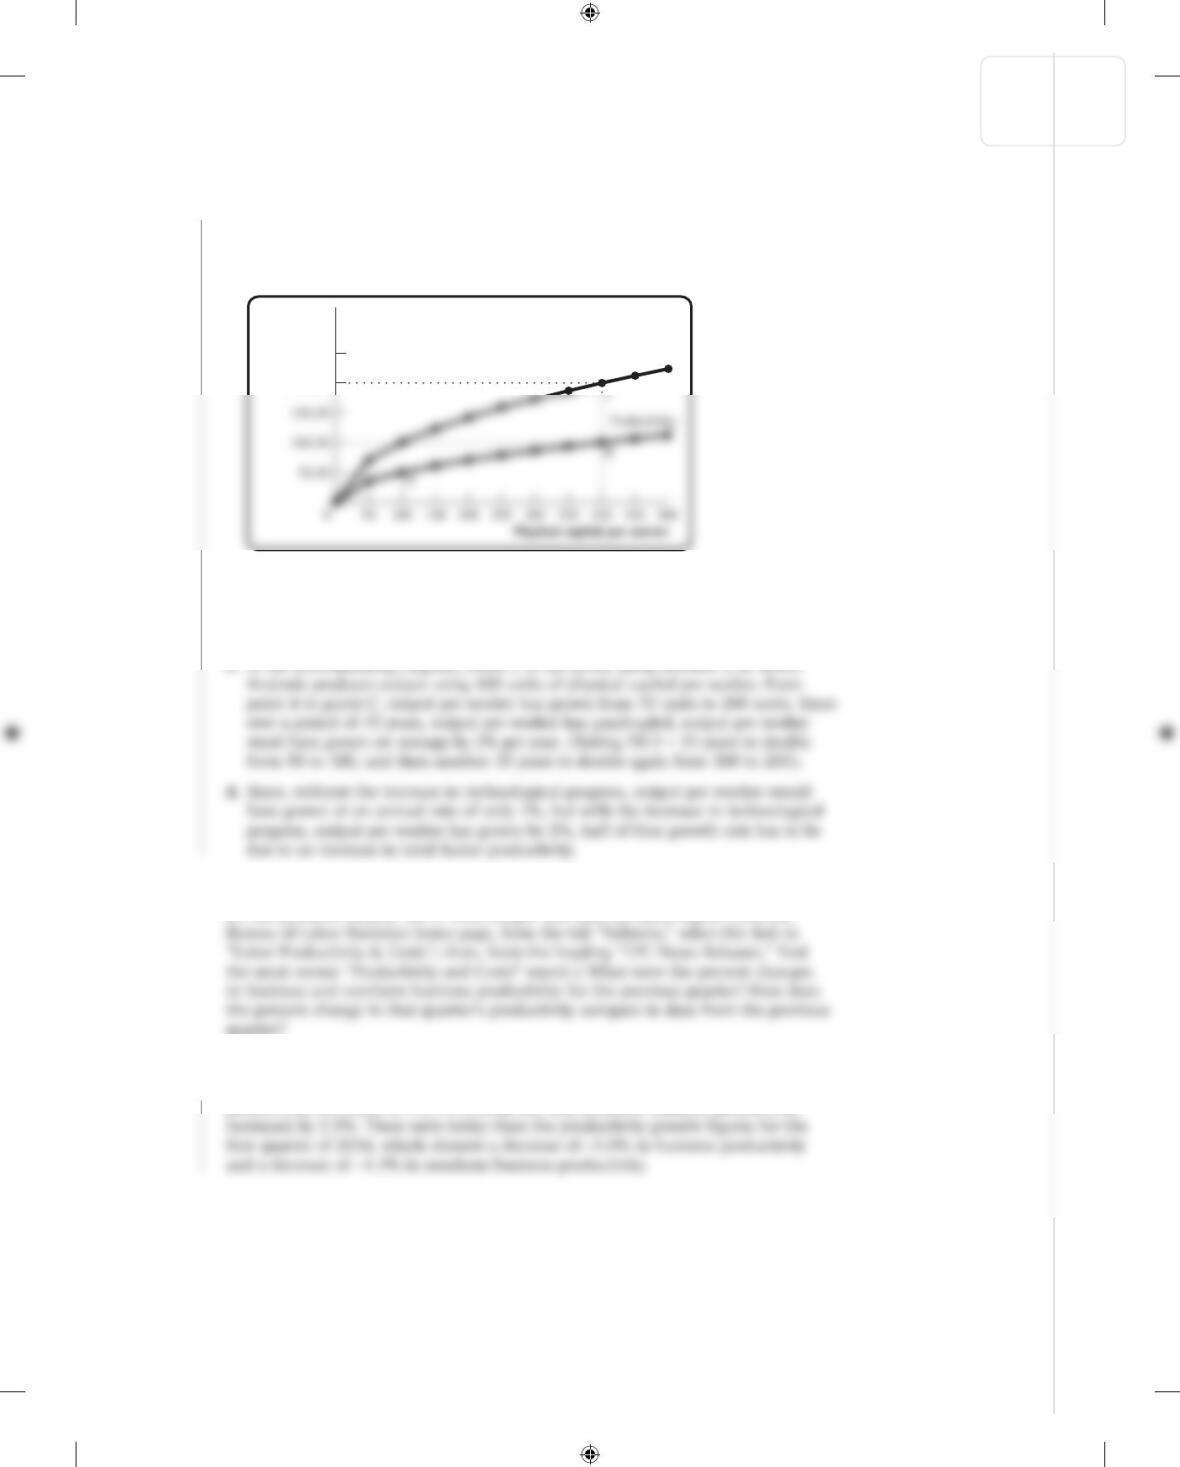
a. Using the data in the accompanying table, draw the two production functions in
one diagram. Androde’s current amount of physical capital per worker is 100. In
your figure, label that point A.
b. Starting from point A, over a period of 70 years, the amount of physical capital
per worker in Androde rises to 400. Assuming Androde still uses Method 1, in
S-126 CHAPTER 9 LONG-RUN ECONOMIC GROWTH
Solution
CHAPTER 9 LONG-RUN ECONOMIC GROWTH S-127
Solution
4. a. In the accompanying diagram, the line labeled “Productivity1” shows the produc-
tion function using Method 1, and the line labeled “Productivity2” shows the pro-
duction function using Method 2. Point A is the point, using Method 1, at which
Androde produces output using 100 units of physical capital per worker.
250.00
200.00
Real GDP
per worker
Productivity2
b. In the accompanying diagram, Point B is the point, using Method 1, at which
Androde produces output using 400 units of physical capital per worker. Output
per worker has grown from 50 units to 100 units. Since over a period of 70 years,
output per worker has doubled, output per worker must have grown by 1% per year.
5. The Bureau of Labor Statistics regularly releases the “Productivity and Costs” report
for the previous month. Go to www.bls.gov and find the latest report. (On the
quarter?
5. Answers will vary with the latest data. For the second quarter of 2014, business
productivity increased at a 2.0% annual rate and nonfarm business productivity
KrugWellsECPS4e_Macro_CH09.indd S-127KrugWellsECPS4e_Macro_CH09.indd S-127 1/29/15 8:07 AM1/29/15 8:07 AM
Solution
Solution
Solution
6. What roles do physical capital, human capital, technology, and natural resources play
in influencing long – run economic growth of aggregate output per capita?
6. Physical capital, human capital, technology, and natural resources play important
roles in influencing long – run growth in real GDP per capita. Increases in both physi-
7. How have U.S. policies and institutions influenced the country’s long – run economic
growth?
7. U.S. institutions and policies have greatly aided the country’s economic growth. The
United States has been politically stable, and its laws and institutions protect private
8. Over the next 100 years, real GDP per capita in Groland is expected to grow at an
8. If real GDP per capita in Groland grows at an average annual rate of 2.0%, real GDP
per capita in 100 years will be $144,893 [$20,000 × (1 + 0.02)100]. At an average
9. The accompanying table shows data from the Penn World Table, Version 8.0, for real
GDP per capita (2005 U.S. dollars) in France, Japan, the United Kingdom, and the
United States in 1950 and 2011. Complete the table. Have these countries converged
economically?
1950 2011
Real GDP Percentage Real GDP Percentage
per capita of U.S. per capita of U.S.
(2005 real GDP (2005 real GDP
dollars) per capita dollars) per capita
France $6,475 ? $29,476 ?
S-128 CHAPTER 9 LONG-RUN ECONOMIC GROWTH
KrugWellsECPS4e_Macro_CH09.indd S-128KrugWellsECPS4e_Macro_CH09.indd S-128 1/29/15 8:07 AM1/29/15 8:07 AM
Solution
Solution
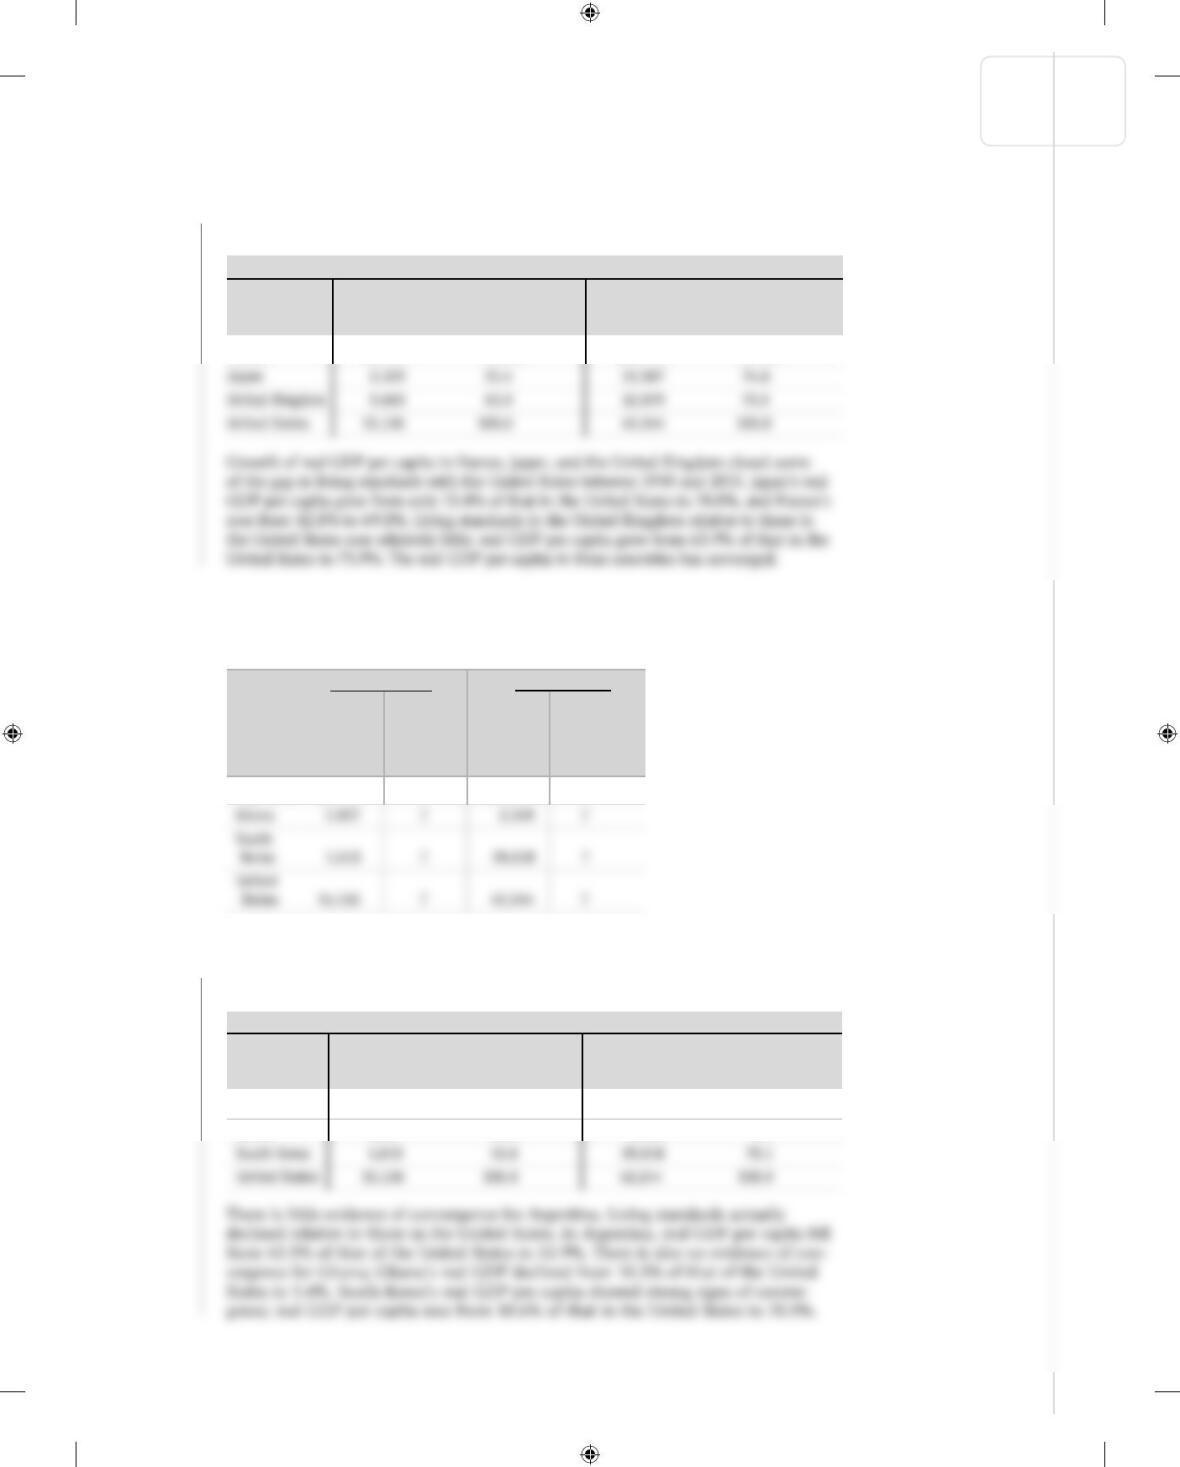
9. The accompanying table shows real GDP per capita (2005 U.S. dollars) in France, Japan,
and the United Kingdom as a percentage of real GDP per capita in the United States.
1950 2011
Real GDP Real GDP
per capita Percentage of U.S. per capita Percentage of U.S.
(2005 dollars) real GDP per capita (2005 dollars) real GDP per capita
France $6,475 42.8% $29,476 69.8%
10. The accompanying table shows data from the Penn World Table, Version 8.0, for real GDP
per capita (2005 U.S. dollars) for Argentina, Ghana, South Korea, and the United States in
1960 and 2011. Complete the table. Have these countries converged economically?
1960 2011
Real GDP Percentage Real GDP Percentage
per capita of U.S. per capita of U.S.
(2005 real GDP (2005 real GDP
dollars) per capita dollars) per capita
Argentina $6,585 ? $13,882 ?
10. The accompanying table shows real GDP per capita (2005 U.S. dollars) in Argentina,
Ghana, and South Korea as a percentage of real GDP per capita in the United States.
1960 2011
Real GDP Real GDP
per capita Percentage of U.S. per capita Percentage of U.S.
(2005 dollars) real GDP per capita (2005 dollars) real GDP per capita
Argentina $6,585 43.5% $13,882 32.9%
Ghana 1,557 10.3 2,349 5.6
CHAPTER 9 LONG-RUN ECONOMIC GROWTH S-129
KrugWellsECPS4e_Macro_CH09.indd S-129KrugWellsECPS4e_Macro_CH09.indd S-129 1/29/15 8:07 AM1/29/15 8:07 AM
Solution
Solution
11. Why would you expect real GDP per capita in California and Pennsylvania to exhibit
convergence but not in California and Baja California, a state of Mexico that borders the
United States? What changes would allow California and Baja California to converge?
11. According to the conditional convergence hypothesis, other things equal, countries
with relatively low real GDP per capita tend to have higher rates of growth than
12. According to the Oil & Gas Journal, the proven oil reserves existing in the world in 2012
consisted of 1,525 billion barrels. In that year, the U.S. Energy Information Administration
reported that the world daily oil production was 75.58 million barrels a day.
a. At this rate, for how many years will the proven oil reserves last? Discuss the
Malthusian view in the context of the number you just calculated.
12. a. In one year, approximately 75.58 million × 365 = 27.5 billion barrels of oil are
produced. At this rate, 1,525 billion barrels of oil will last for approximately
55 years. The numbers support the Malthusian view that there is a limit to the
standard of living. Because population growth also results in a growing need for
natural resources to continually raise the standard of living, the limited supply of
resources like oil results in a limit on the standard of living.
S-130 CHAPTER 9 LONG-RUN ECONOMIC GROWTH
KrugWellsECPS4e_Macro_CH09.indd S-130KrugWellsECPS4e_Macro_CH09.indd S-130 1/29/15 8:07 AM1/29/15 8:07 AM
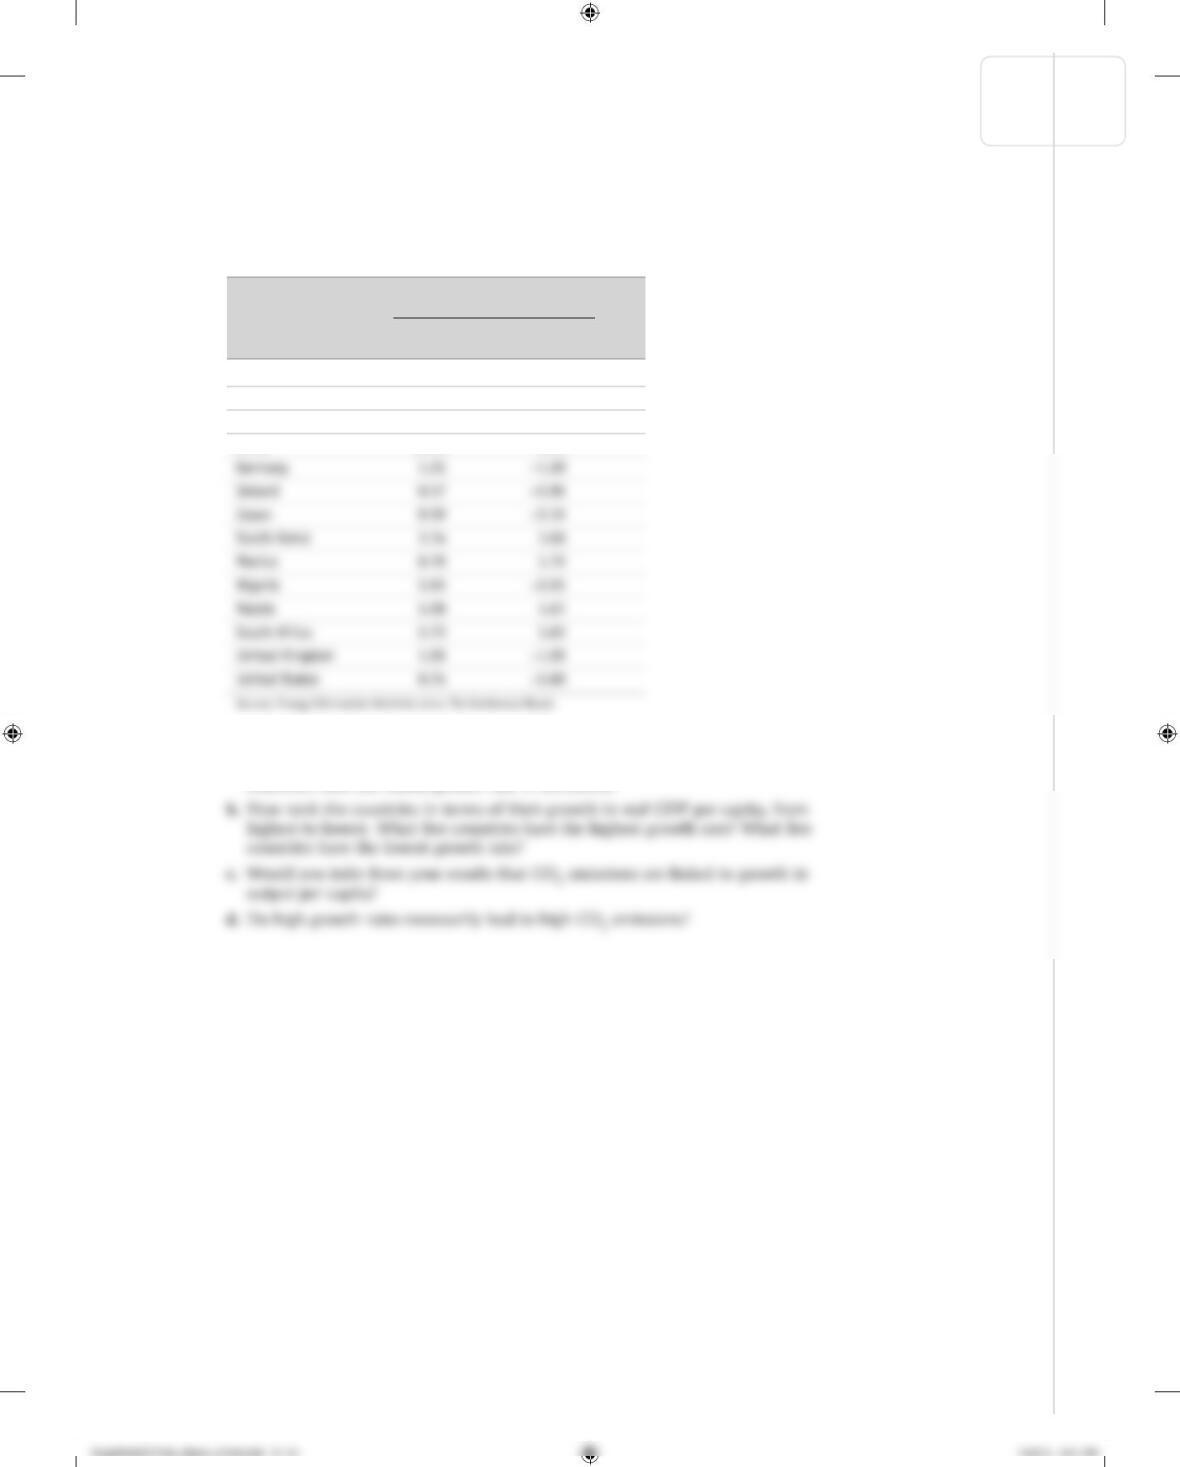
13. The accompanying table shows the annual growth rate for the years 2000–2011 in
per capita emissions of carbon dioxide (CO2) and the annual growth rate in real
GDP per capita for selected countries.
2000–2011
average annual growth rate of:
Real GDP per CO2 emissions
Country capita per capita
Argentina 2.25% 2. 95%
Bangladesh 4.16 6.52
Canada 1.1 −0.33
China 10.72 9.31
a. Rank the countries in terms of their growth in CO2 emissions, from highest to
lowest. What five countries have the highest growth rate in emissions? What five
countries have the lowest growth rate in emissions?
CHAPTER 9 LONG-RUN ECONOMIC GROWTH S-131

Solution
13. a. As shown in the accompanying table, the five countries with the highest growth
rate in per capita CO2 emissions are China, Bangladesh, South Korea, Argentina,
and Mexico. The five countries with the lowest growth rate in per capita CO2 emis-
sions are Germany, the United Kingdom, Ireland, the United States, and Nigeria.
2000–2011
average annual growth
rate of CO2 emissions
Country per capita
China 9.31%
Bangladesh 6.52
South Korea 3.06
Argentina 2.95
b. As shown in the accompanying table, the five countries with the highest growth
rate in real GDP per capita are China, Nigeria, Russia, Bangladesh, and South
Korea. The five countries with the lowest growth rate in real GDP per capita are
Ireland, Japan, the United States, Mexico, and the United Kingdom.
2000–2011
average annual growth
rate of real GDP
Country per capita
China 10.72%
Nigeria 5.93
Russia 5.08
Bangladesh 4.16
South Korea 3.74
S-132 CHAPTER 9 LONG-RUN ECONOMIC GROWTH
c. Yes. Three of the five countries with the highest growth rate in per capita CO2
emissions also have the highest growth rate in real GDP per capita: China,
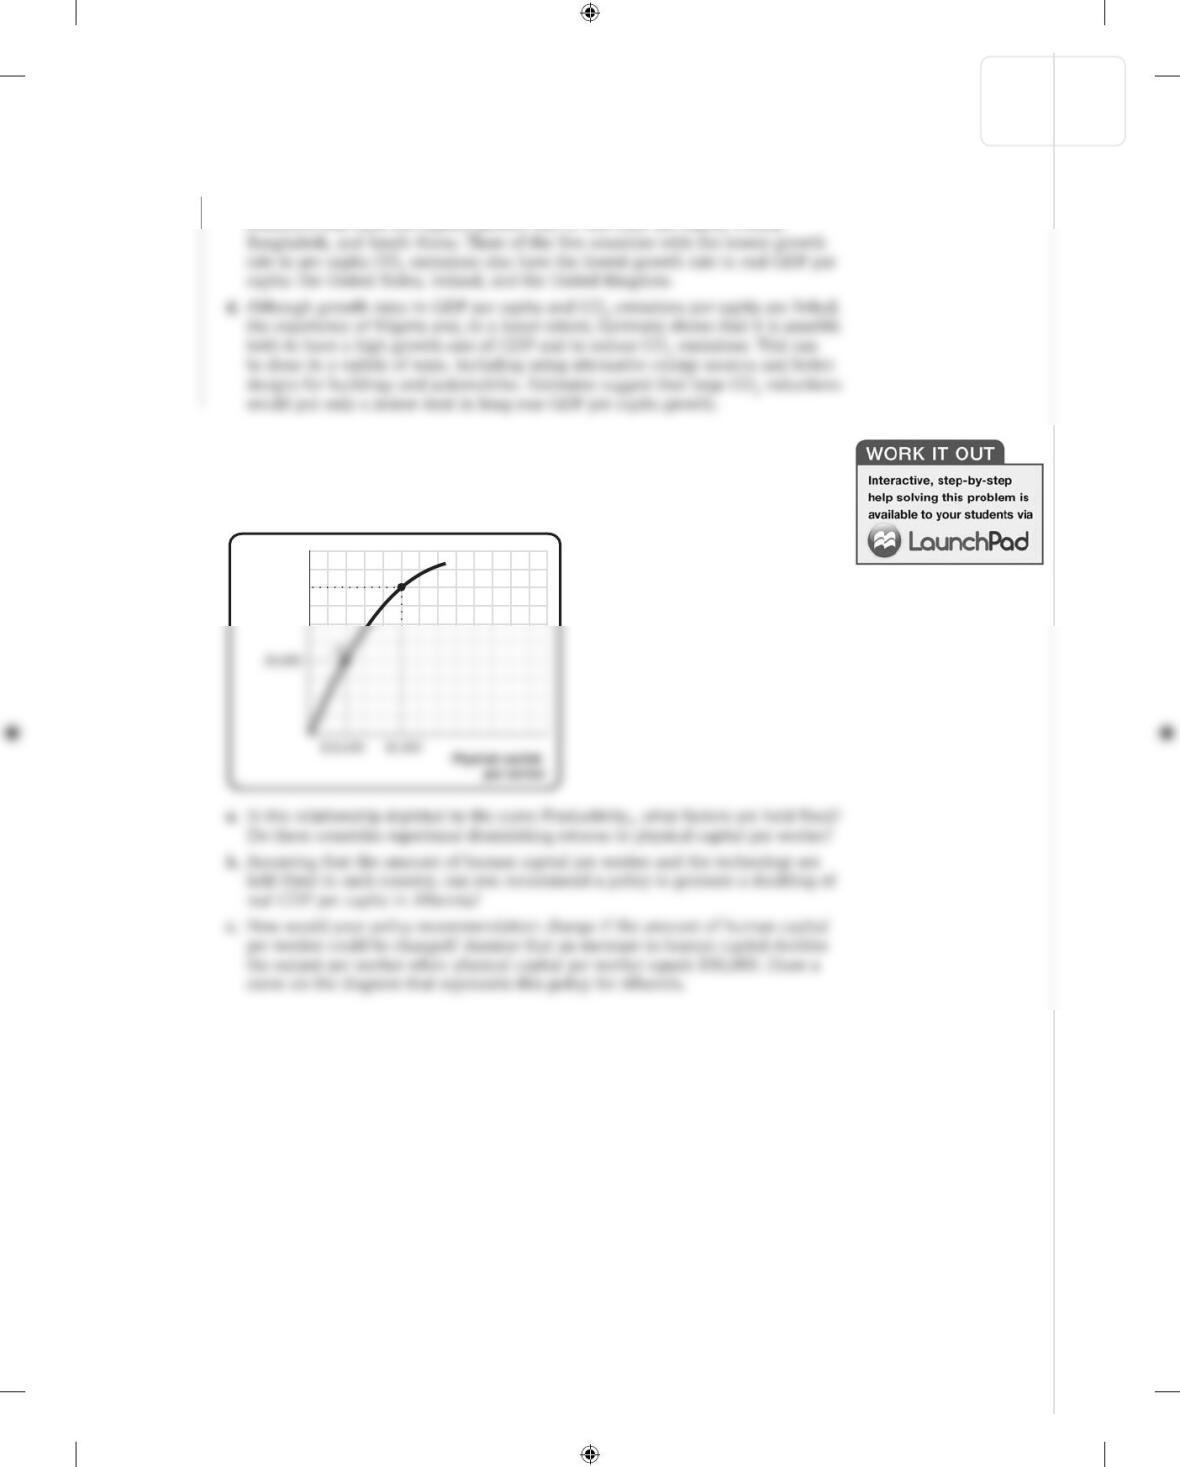
14. You are hired as an economic consultant to the countries of Albernia and Brittania.
Each country’s current relationship between physical capital per worker and output
per worker is given by the curve labeled “Productivity1” in the accompanying dia-
gram. Albernia is at point A and Brittania is at point B.
Real GDP
per worker
B
Productivity1
$40,000
CHAPTER 9 LONG-RUN ECONOMIC GROWTH S-133
KrugWellsECPS4e_Macro_CH09.indd S-133 1/29/15 8:07 AM
Solution
14. a. The curve reflecting the relationship between physical capital per worker and out-
put per worker is drawn holding human capital per worker and technology fixed.
Both Albernia and Brittania experience diminishing returns to physical capital
since in both countries equal successive increases in physical capital per worker—
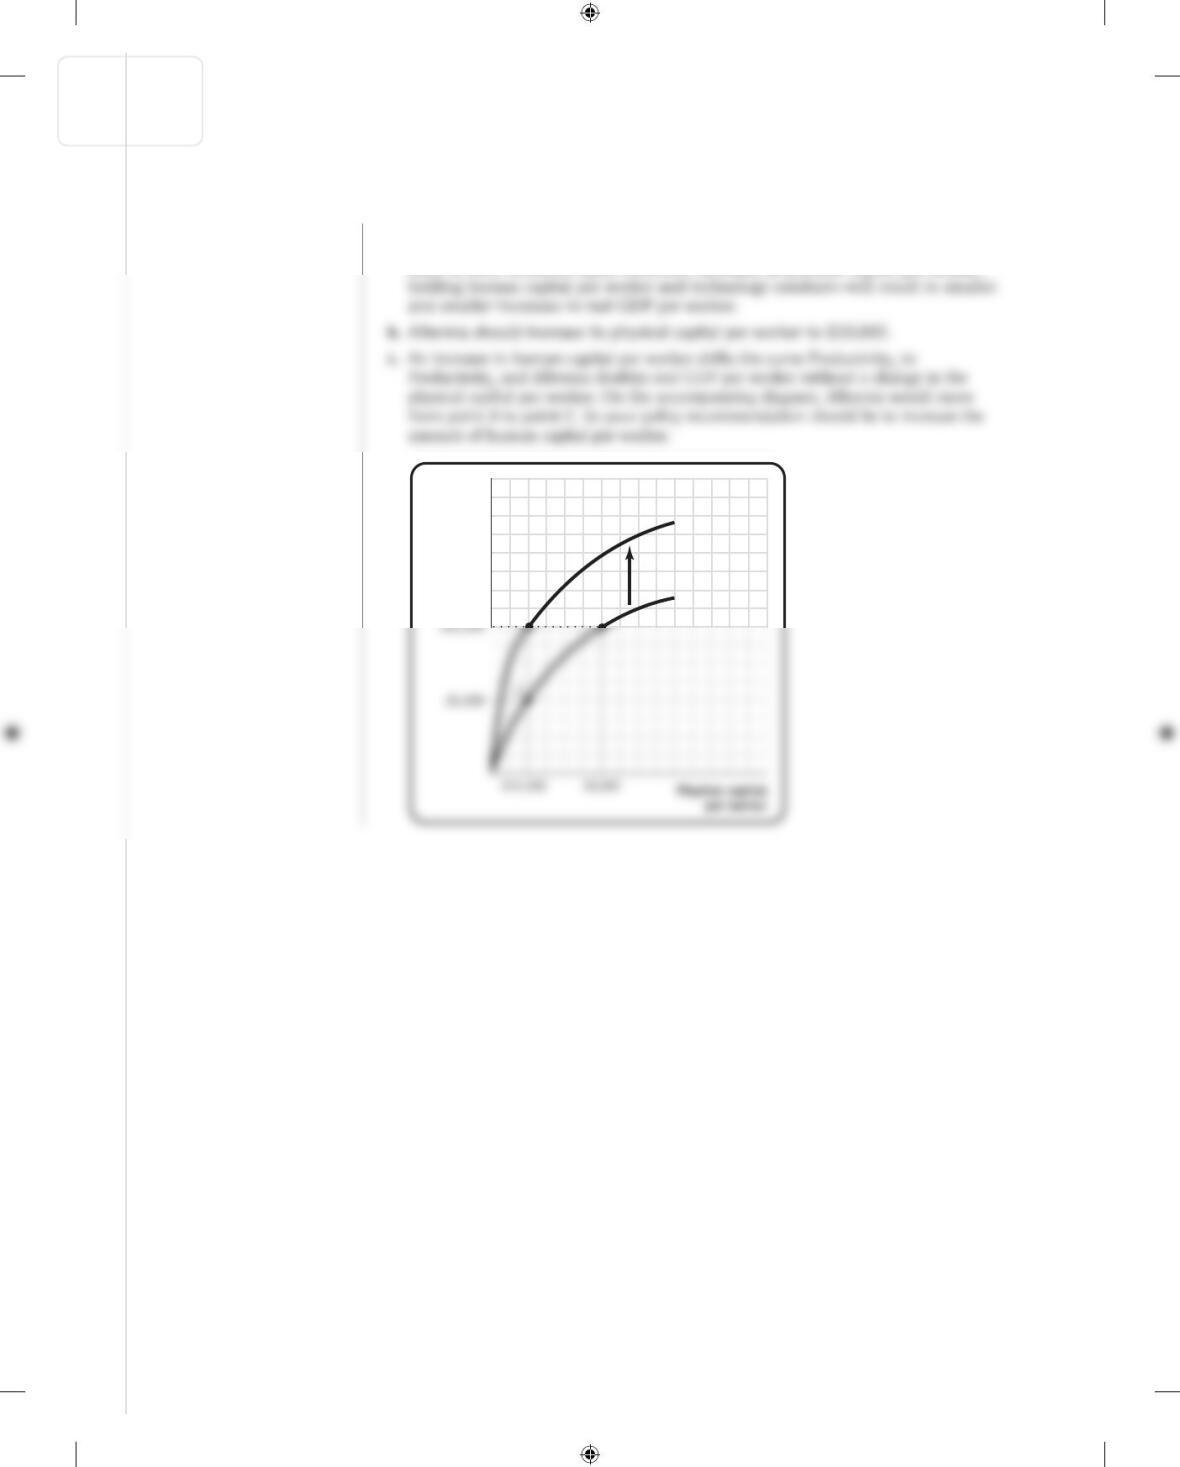
Real GDP
per worker
B
Productivity1
Productivity2
C
S-134 CHAPTER 9 LONG-RUN ECONOMIC GROWTH
KrugWellsECPS4e_Macro_CH09.indd S-134KrugWellsECPS4e_Macro_CH09.indd S-134 1/29/15 8:07 AM1/29/15 8:07 AM