Problem 9-23 (continued)
3.
Assembly Department
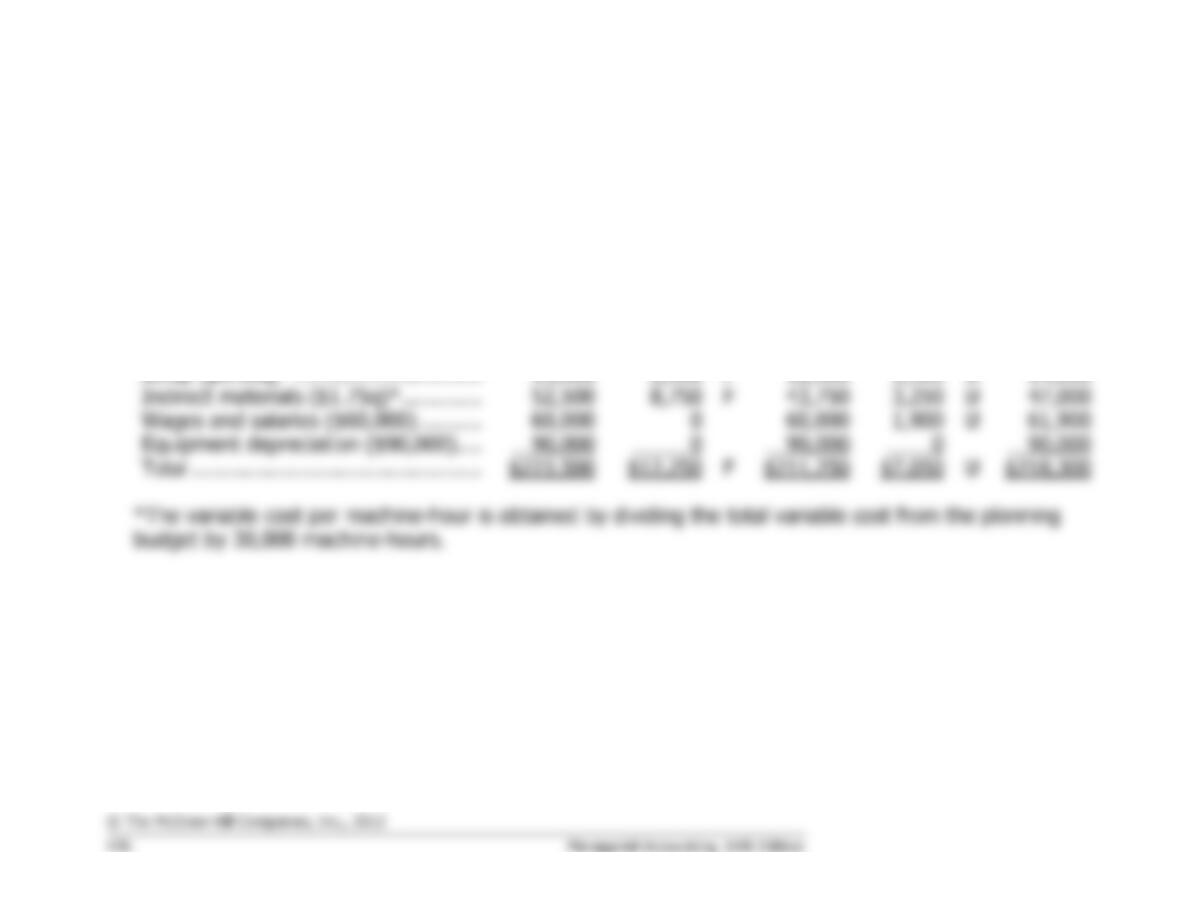
Flexible Budget Performance Report
For the Month Ended March 31
Planning
Budget
Activity
Variances
Flexible
Budget
Spending
Variances
Actual
Results
Machine-hours (q) ………………………
30,000
25,000
25,000
Supplies ($0.20q)* ……………………..
$ 6,000
$ 1,000
F
$ 5,000
$ 400
U
$ 5,400
Scrap ($0.50q)* …………………………
15,000
2,500
F
12,500
1,500
U
14,000
Indirect materials ($1.75q)*………….
52,500
F
43,750
U
47,000
Wages and salaries ($60,000) ……….
60,000
60,000
U
61,900
Equipment depreciation ($90,000) ….
Total ……………………………………….
F
$7,050
U
Problem 9-24 (45 minutes)
1. The cost control report compares the planning budget, which was
prepared for 40,000 machine-hours, to actual results for 42,000
Problem 9-24 (continued)
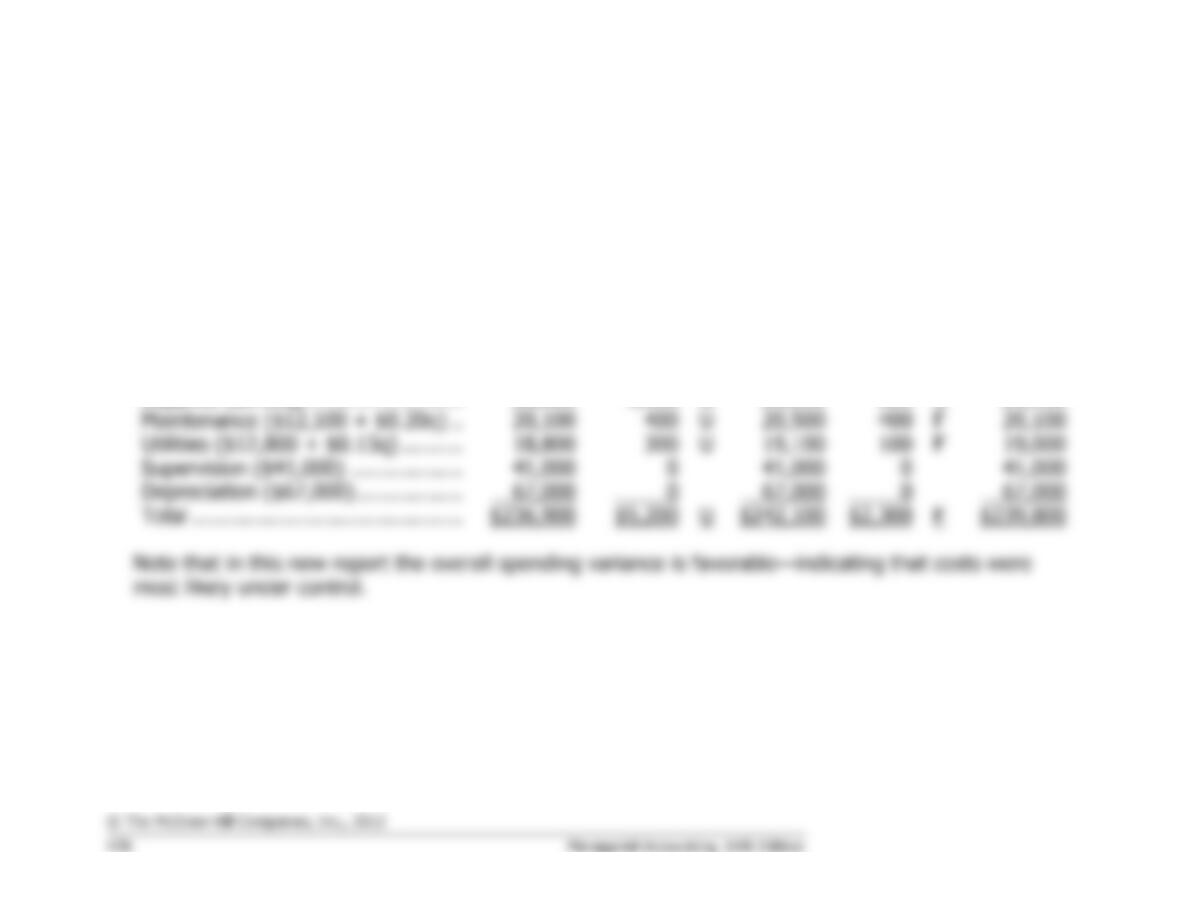
2. A report that would be helpful in assessing how well costs were controlled appears below:
Karaki Corporation—Machining Department
Flexible Budget Performance Report
For the Month Ended June 30
Planning
Budget
Activity
Variances
Flexible
Budget
Spending
Variances
Actual
Results
Machine-hours (q) ……………………
40,000
42,000
42,000
Direct labor wages ($1.75q) ……….
$ 70,000
$3,500
U
$ 73,500
$2,100
F
$ 71,400
Supplies ($0.50q) …………………….
20,000
1,000
U
21,000
300
U
21,300
Maintenance ($12,100 + $0.20q) ..
20,100
U
20,500
400
F
20,100
Utilities ($12,800 + $0.15q) ……….
U
F
Supervision ($41,000) ………………
41,000
41,000
41,000
Depreciation ($67,000) ……………..
Total …………………………………….
$5,200
U
$242,100
$2,300
F
Problem 9-25 (45 minutes)
1. The report prepared by the bookkeeper compares average budgeted per
unit revenues and costs to average actual per unit revenues and costs.
This approach implicitly assumes that all costs are strictly variable; only
variable costs should be constant on a per unit basis. The average fixed
cost should decrease as the level of activity increases and should
increase as the level of activity decreases. In this case, the actual level
of activity was greater than the budgeted level of activity. As a
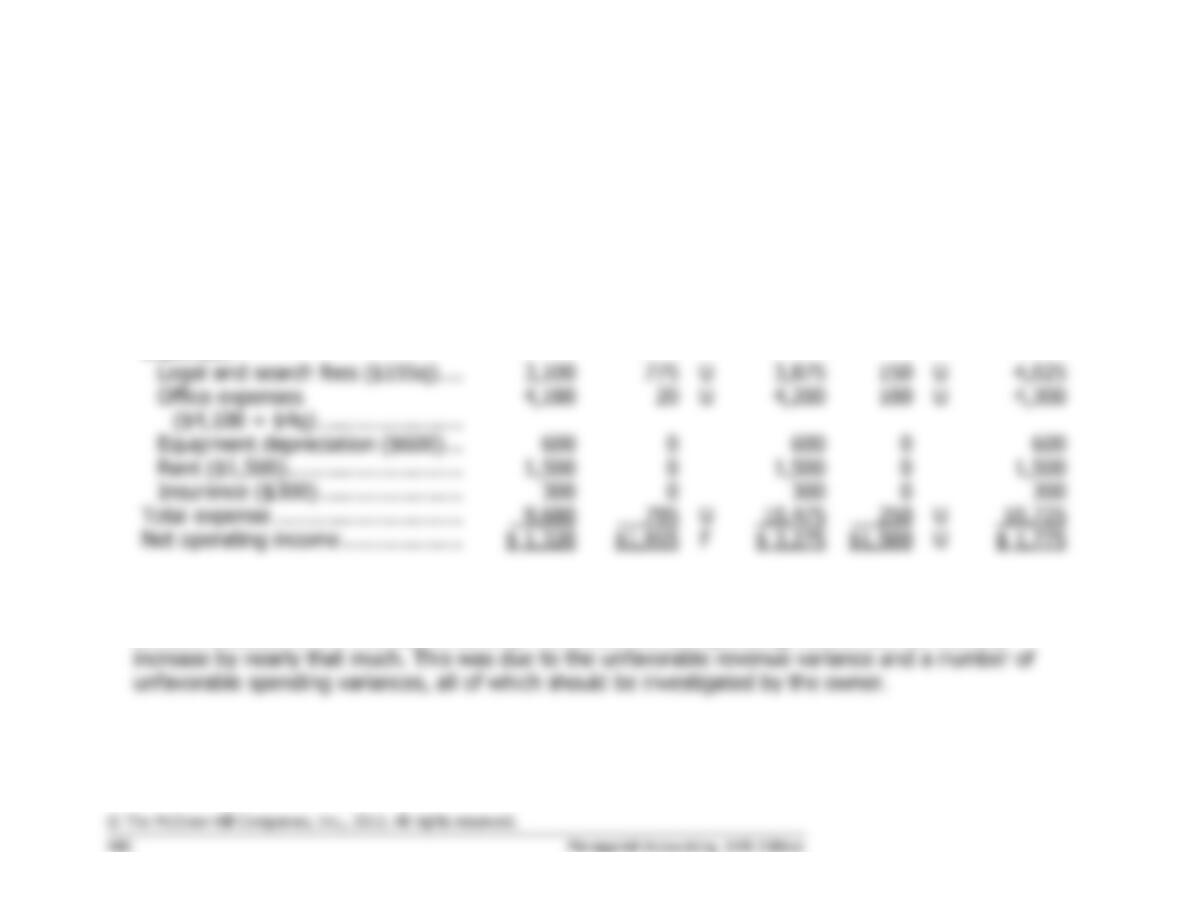
2. A flexible budget performance report would be much more helpful in
assessing the performance of the company than the report prepared by
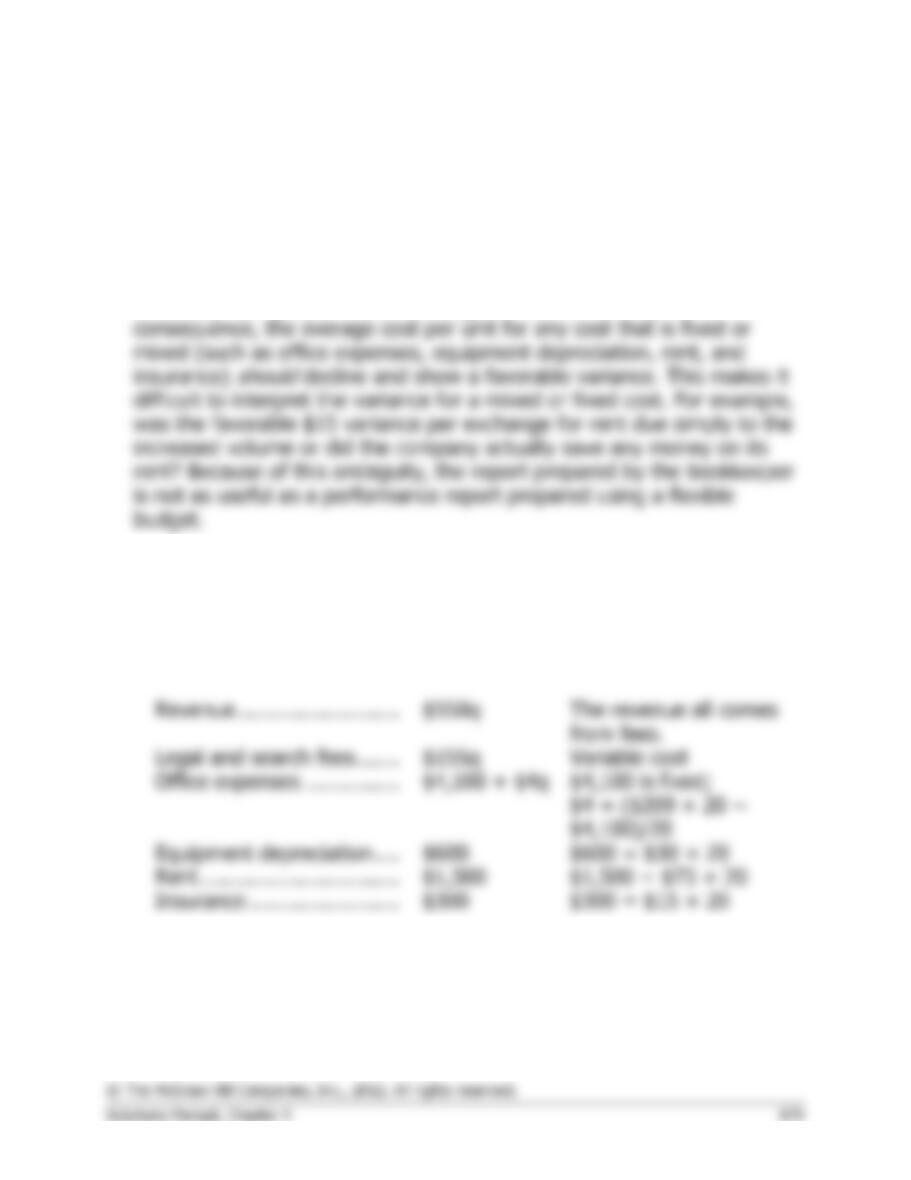
the bookkeeper. To construct such a report, we first need to determine
the cost formulas as follows, where q is the number of exchanges
completed:
Problem 9-25 (continued)
Facilitator Corp
Flexible Budget Performance Report
For the Month Ended May 31
Planning
Budget
Activity
Variances
Flexible
Budget
Spending
Variances
Actual
Results
Exchanges completed (q) ………….
20
25
25
Revenue ($550q) …………………….
$11,000
$2,750
F
$13,750
$1,250
U
$12,500
Expenses:
U
U
Rent ($1,500) ……………………….
Insurance ($300) …………………..
Total expense …………………………
U
U
Net operating income ……………….
$1,955
F
$ 3,275
$1,500
U
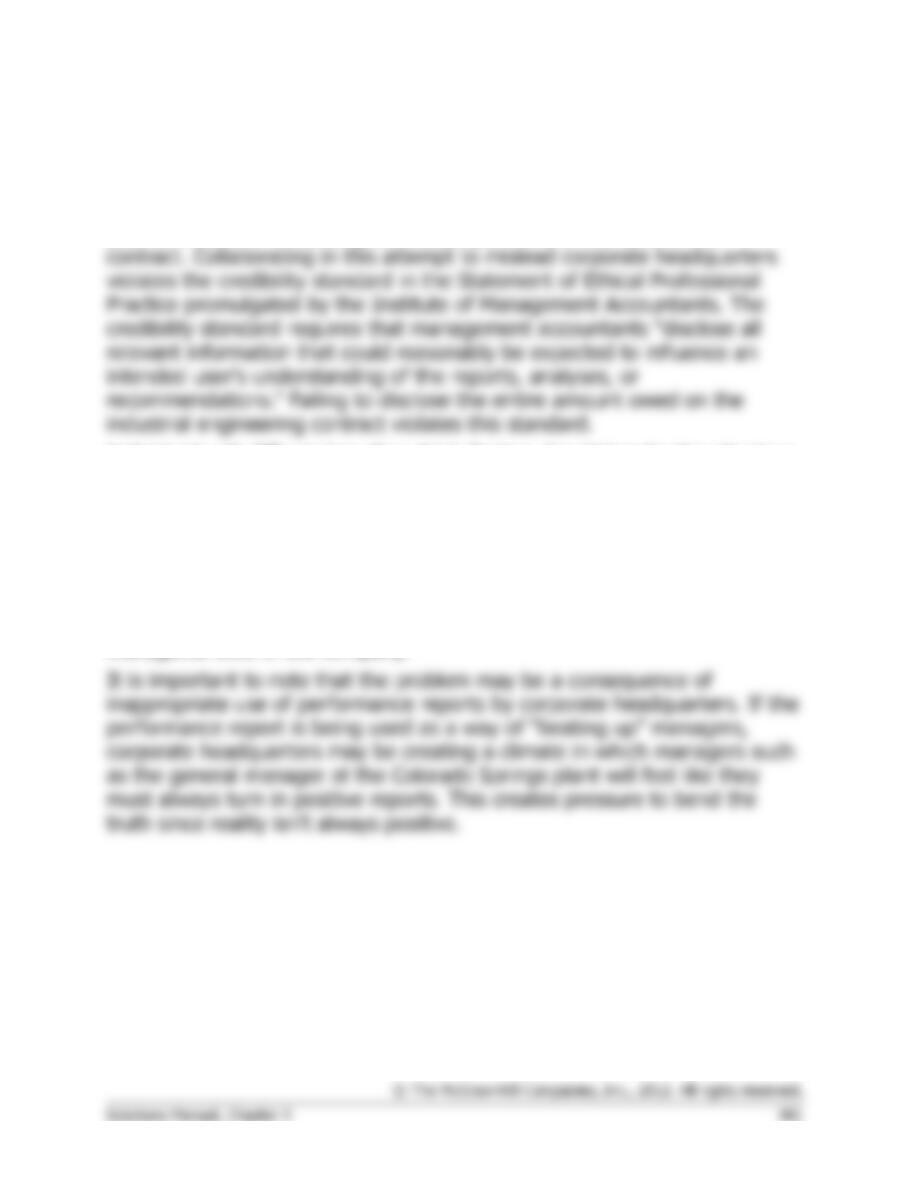
3. On the one hand, the increase in the number of exchanges completed was positive. The overall
favorable activity of $1,955 indicates that the net operating income should have increased by that
amount because of the increase in activity. However, the net operating income did not actually
Case 9-26 (30 minutes)
It is difficult to imagine how Lance Prating could ethically agree to go along
with reporting the favorable $6,000 variance for industrial engineering on
the final report, even if the bill were not actually received by the end of the
year. It would be misleading to exclude part of the final cost of the
Individuals will differ in how they think Prating should handle this situation.
In our opinion, he should firmly state that he is willing to call Maria, but
even if the bill does not arrive, he is ethically bound to properly accrue the
expenses on the report—which will mean an unfavorable variance for
industrial engineering and an overall unfavorable variance. This would
require a great deal of personal courage. If the general manager insists on
keeping the misleading $6,000 favorable variance on the report, Prating
would have little choice except to take the dispute to the next higher
managerial level in the company.
Case 9-27 (45 minutes)
1. The flexible budget can be prepared using the following cost formulas:
o Gasoline: $0.16 per mile. Given.
o Oil, minor repairs, parts: $0.05 per mile. Given
o Outside repairs: $40 per auto per month. $40 = $480/12
o Insurance: $75 per auto per month. $75 = $900/12
o Salaries and benefits: $8,610 per month. Given
o Vehicle depreciation: $200 per auto per month. $200 = $2,400/12
Farrar University Motor Pool
Spending Variances
For the Month Ended March 31
Flexible
Budget
Actual
Results
Spending
Variances
Miles (q1) …………………………………..
58,000
58,000
Autos (q2) ………………………………….
21
21
Gasoline ($0.16q1) ………………………
F
Oil, minor repairs, parts ($0.05q1) …..
F
Outside repairs ($40q2) ………………..
U
Salaries and benefits ($8,610) ……….
Vehicle depreciation ($200q2) ………..
Total ………………………………………..
F
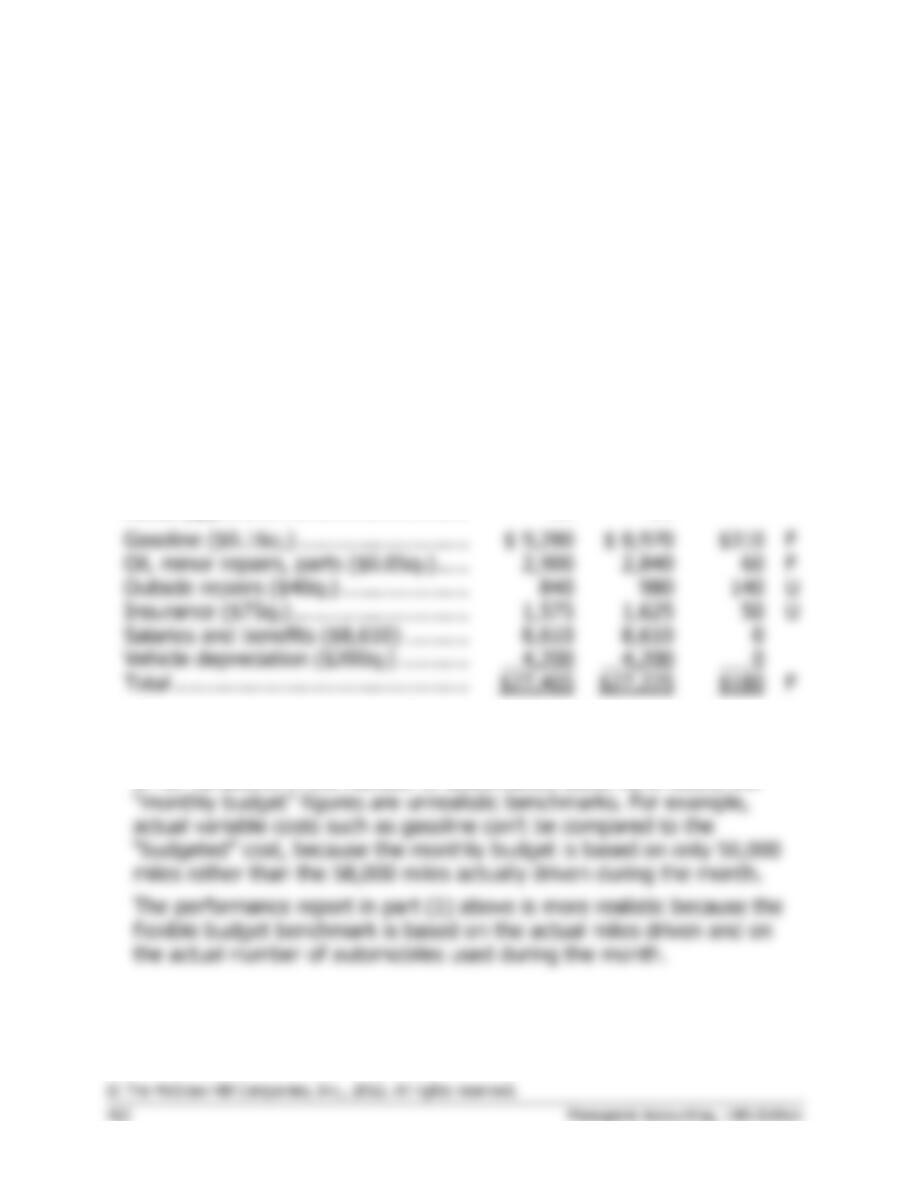
2. The original report is based on a static budget approach that does not
allow for variations in the number of miles driven from month to month,
or for variations in the number of automobiles used. As a result, the
Case 9-28 (75 minutes)
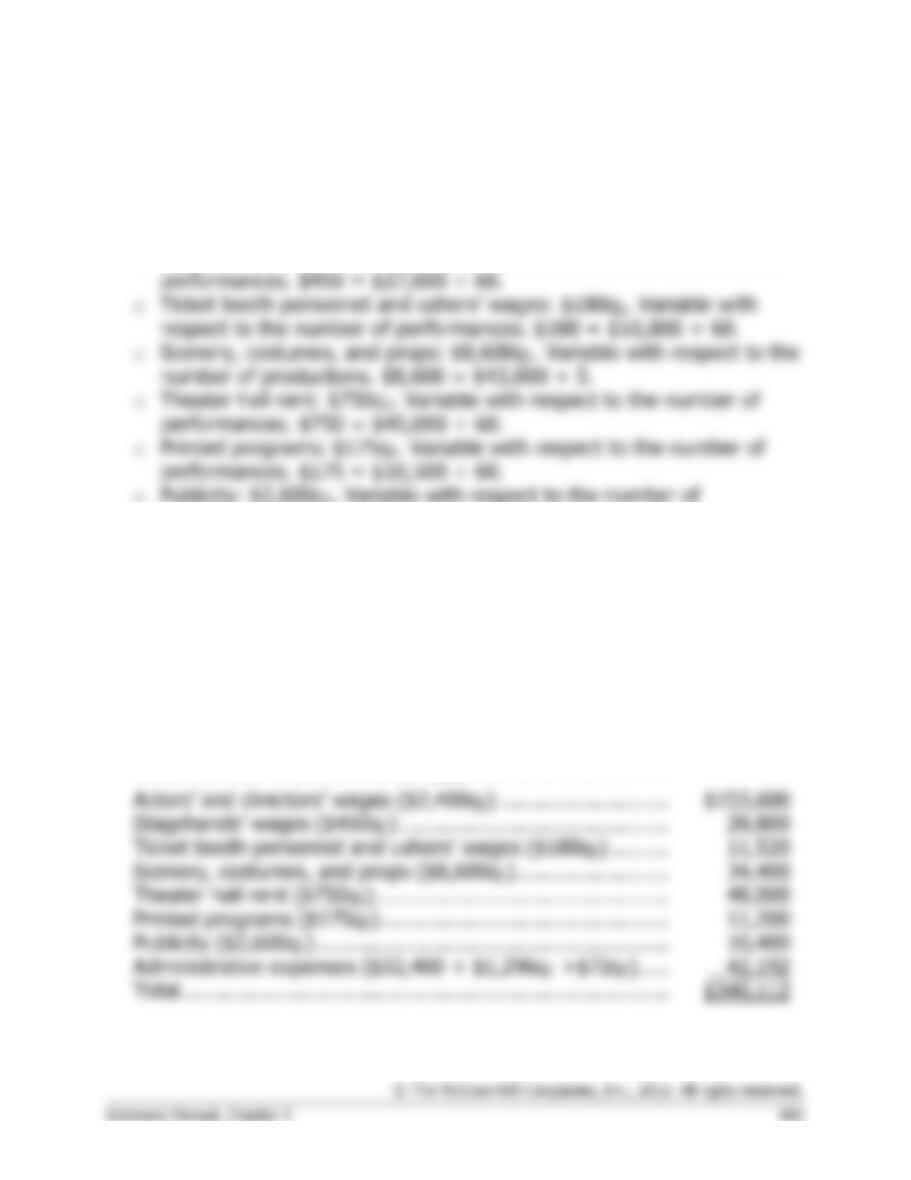
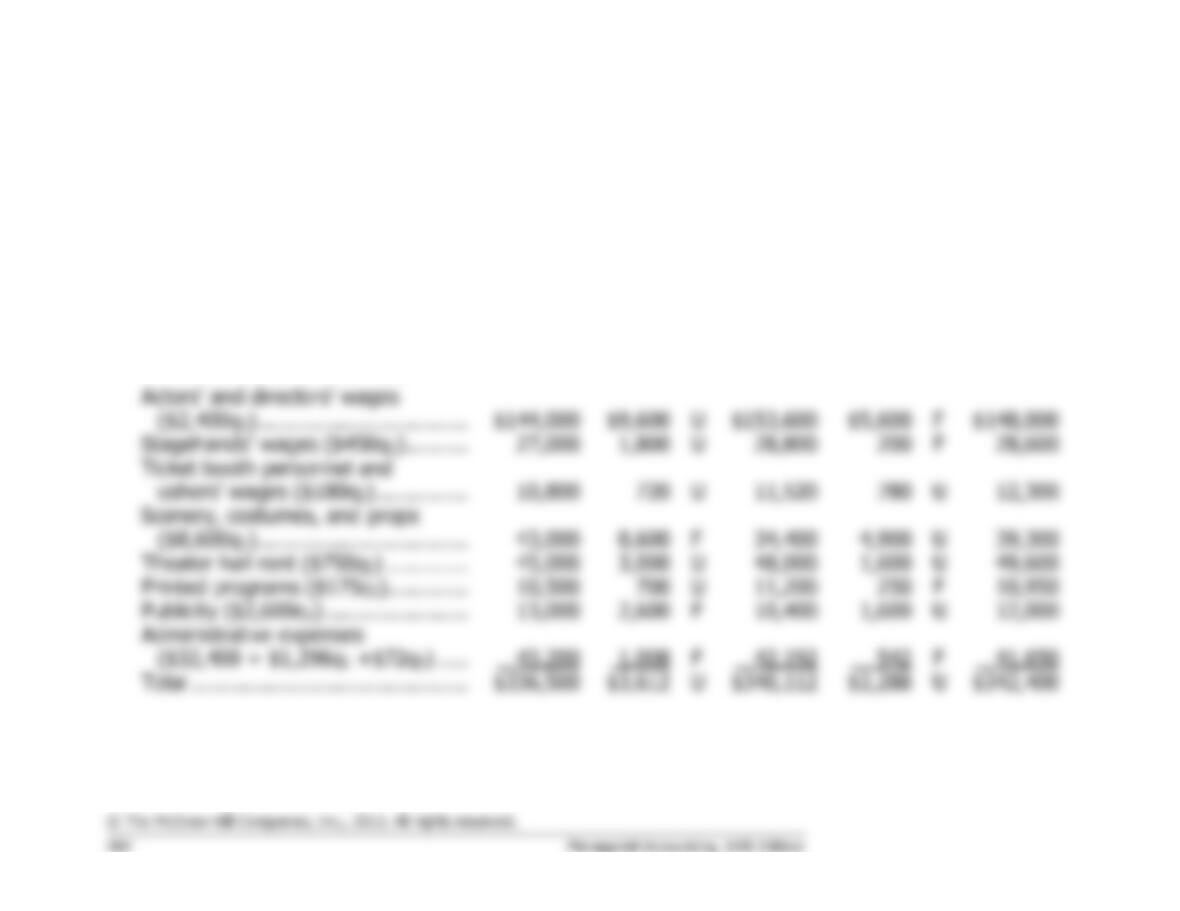
1. The cost formulas for The Munchkin Theater appear below, where q1 is
the number of productions and q2 is the number of performances:
o Actors’ and directors’ wages: $2,400q2. Variable with respect to the
number of performances. $2,400 = $144,000 ÷ 60.
o Stagehands’ wages: $450q2. Variable with respect to the number of
productions. $2,600 = $13,000 ÷ 5.
o Administrative expenses: $32,400 + $1,296q1 +$72q2.
o $32,400 = 0.75 × $43,200
o $1,296 = (0.15 × $43,200) ÷ 5
o $72 = (0.10 × $43,200) ÷ 60
The Munchkin Theater
Flexible Budget
For the Year Ended December 31
Actual number of productions (q1) ……………………………..
4
Actual number of performances (q2) …………………………..
64
Ticket booth personnel and ushers’ wages ($180q2) ………
Scenery, costumes, and props ($8,600q1) ……………………
Theater hall rent ($750q2) ………………………………………..
Printed programs ($175q2) ……………………………………….
Publicity ($2,600q1) ………………………………………………..
Administrative expenses ($32,400 + $1,296q1 +$72q2)…..
Total ……………………………………………………………………
Case 9-28 (continued)
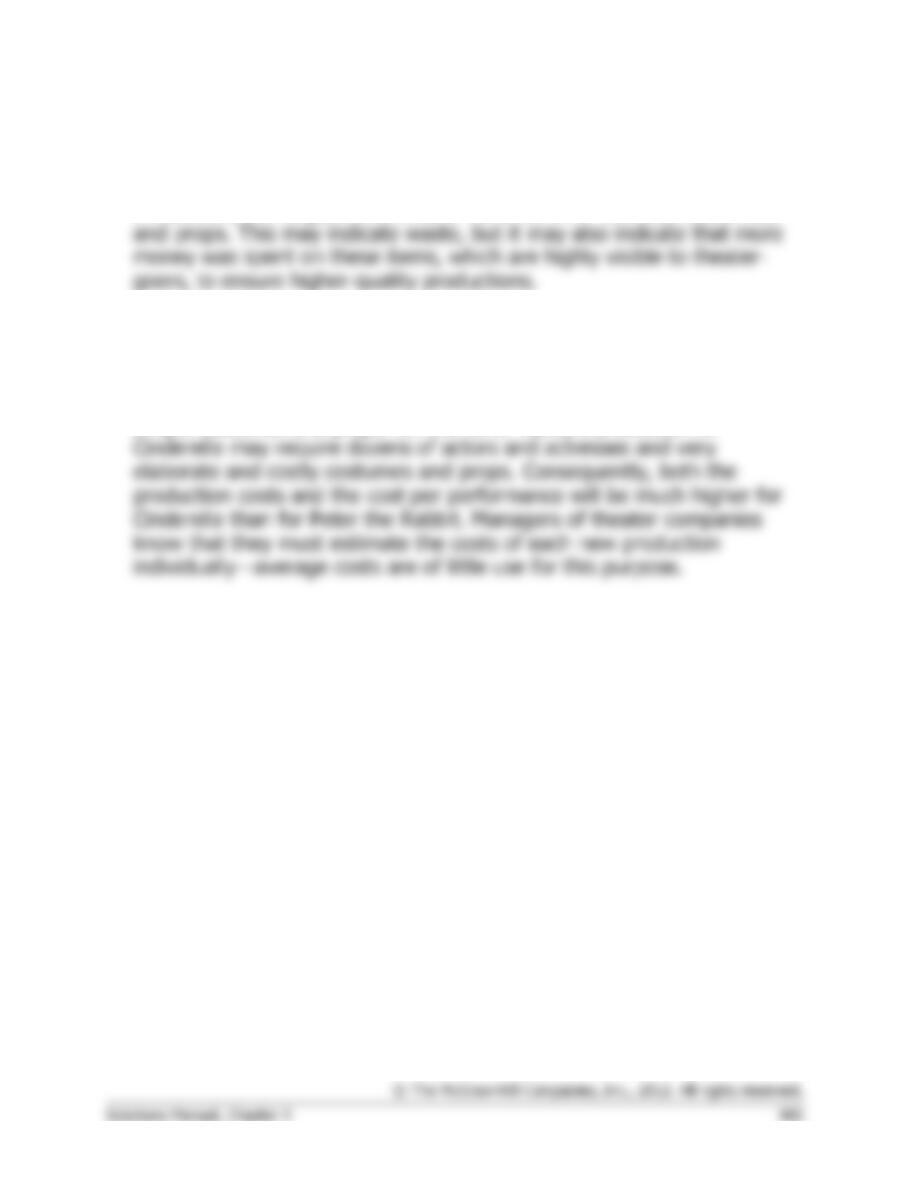
2. The flexible budget performance report follows:
The Munchkin Theater
Flexible Budget Performance Report
For the Year Ended December 31
Planning
Budget
Activity
Variances
Flexible
Budget
Spending
Variances
Actual
Results
Number of productions (q1) ………..
5
4
4
Number of performances (q2) ……..
60
64
64
U
F
Stagehands’ wages ($450q2) ……….
U
F
U
U
F
U
Theater hall rent ($750q2) ………….
U
U
Printed programs ($175q2) ………….
U
F
Publicity ($2,600q1) …………………..
F
U
F
F
Total ……………………………………..
U
U
Case 9-28 (continued)
3. The overall unfavorable spending variance is a very small percentage of
the total cost, about 0.7%, which suggests that costs are under control.
In addition, the largest unfavorable variance is for scenery, costumes,
4. The average costs may not be very good indicators of the additional
costs of any particular production or performance. The averages gloss
over considerable variations in costs. For example, a production of Peter
the Rabbit may require only half a dozen actors and actresses and fairly
simple costumes and props. On the other hand, a production of