Chapter 9
Flexible Budgets and Performance Analysis
Solutions to Questions
9-1 The planning budget is prepared for the
planned level of activity. It is static because it is
9-2 A flexible budget can be adjusted to
reflect any level of activity—including the actual
level of activity. By contrast, a static planning
budget is prepared for a single level of activity
and is not subsequently adjusted.
9-3 Actual results can differ from the budget
for many reasons. Very broadly speaking, the
9-4 As noted in 9-3 above, a difference
between the budget and actual results can be
due to many factors. Most importantly, the level
of activity can have a very big impact on costs.
9-5 An activity variance is the difference
between a revenue or cost item in the static
planning budget and the same item in the
flexible budget. An activity variance is due solely
to the difference in the level of activity assumed
in the planning budget and the actual level of
activity used in the flexible budget. Caution
should be exercised in interpreting an activity
variance. The “favorable” and “unfavorable”
labels are perhaps misleading for activity
variances that involve costs. A “favorable”
activity variance for a cost occurs because the
variance for a cost occurs because the cost has
some variable component and the actual level of
activity is greater than the planned level of
activity.
9-6 A revenue variance is the difference
between how much the revenue should have
been, given the actual level of activity, and the
activity. An unfavorable revenue variance occurs
because the revenue is less than expected for
the actual level of activity.
9-8 In a flexible budget performance report,
the static planning budget is not directly
compared to actual results. The flexible budget
is interposed between the static planning budget
and actual results. The differences between the
static planning budget and the flexible budget
are activity variances. The differences between
the flexible budget and the actual results are the
revenue and spending variances. The flexible
budget performance report cleanly separates the
differences between the static planning budget
and the actual results that are due to changes in
activity (the activity variances) from the
differences that are due to changes in prices and
the effectiveness with which resources are
managed (the revenue and spending variances).
9-10 When the static planning budget is
directly compared to actual results, it is implicitly
assumed that costs (and revenues) should not
change with a change in the level of activity.
This assumption is valid only for fixed costs.
However, it is unlikely that all costs are fixed.
Exercise 9-1 (10 minutes)
Gator Divers
Flexible Budget
For the Month Ended March 31
Actual diving-hours …………………………………
190
Revenue ($380.00q) ……………………………….
$72,200
Expenses:
Total expense ………………………………………..
Net operating income ………………………………
$22,085
Exercise 9-2 (10 minutes)
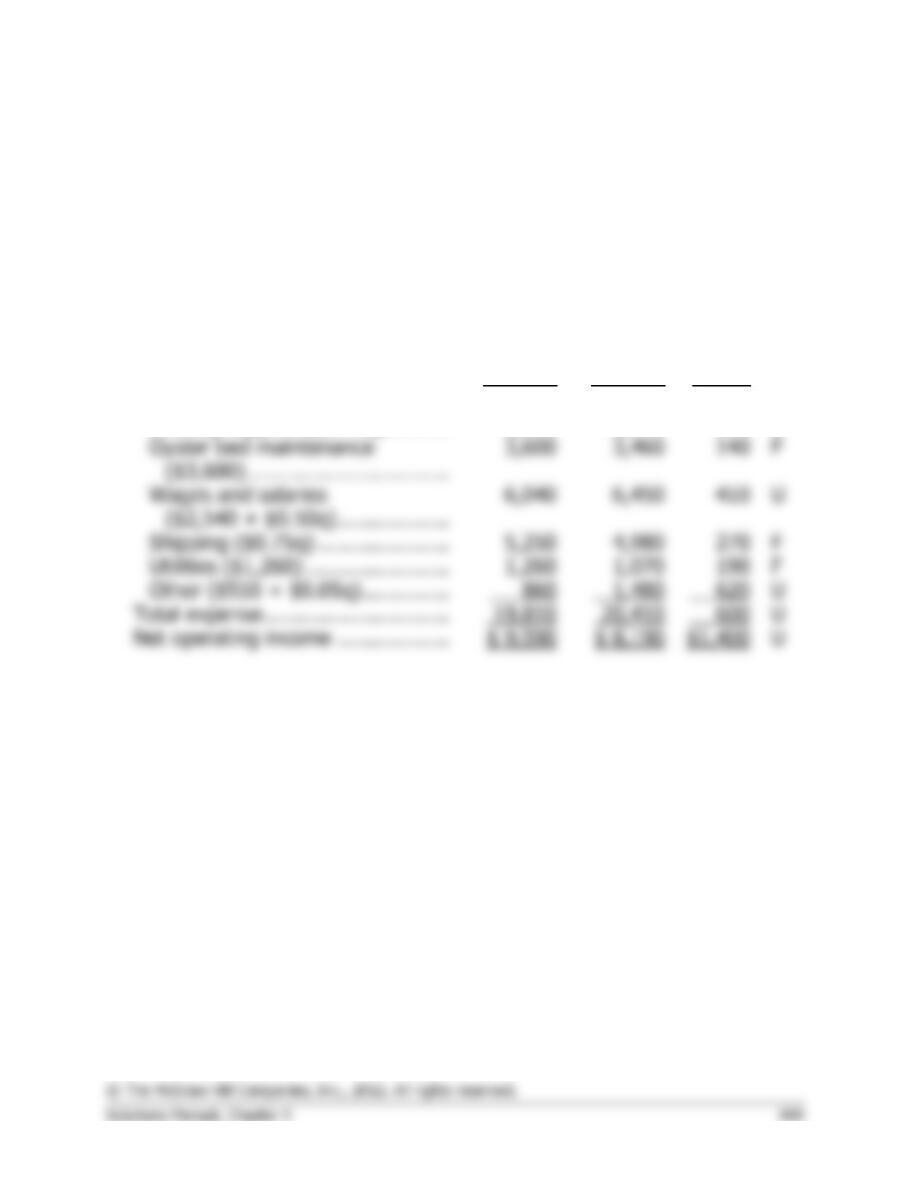
1. The activity variances are shown below:
Air Meals
Activity Variances
For the Month Ended December 31
Planning
Budget
Flexible
Budget
Activity
Variances
Meals ……………………………………
20,000
21,000
Revenue ($3.80q) ……………………
$76,000
$79,800
$3,800
F
Expenses:
46,000
48,300
U
11,400
11,650
U
U
U
Total expense …………………………
U
2. Management should note that the level of activity was above what had
been planned for the month. This led to an expected increase in profits
Exercise 9-3 (15 minutes)
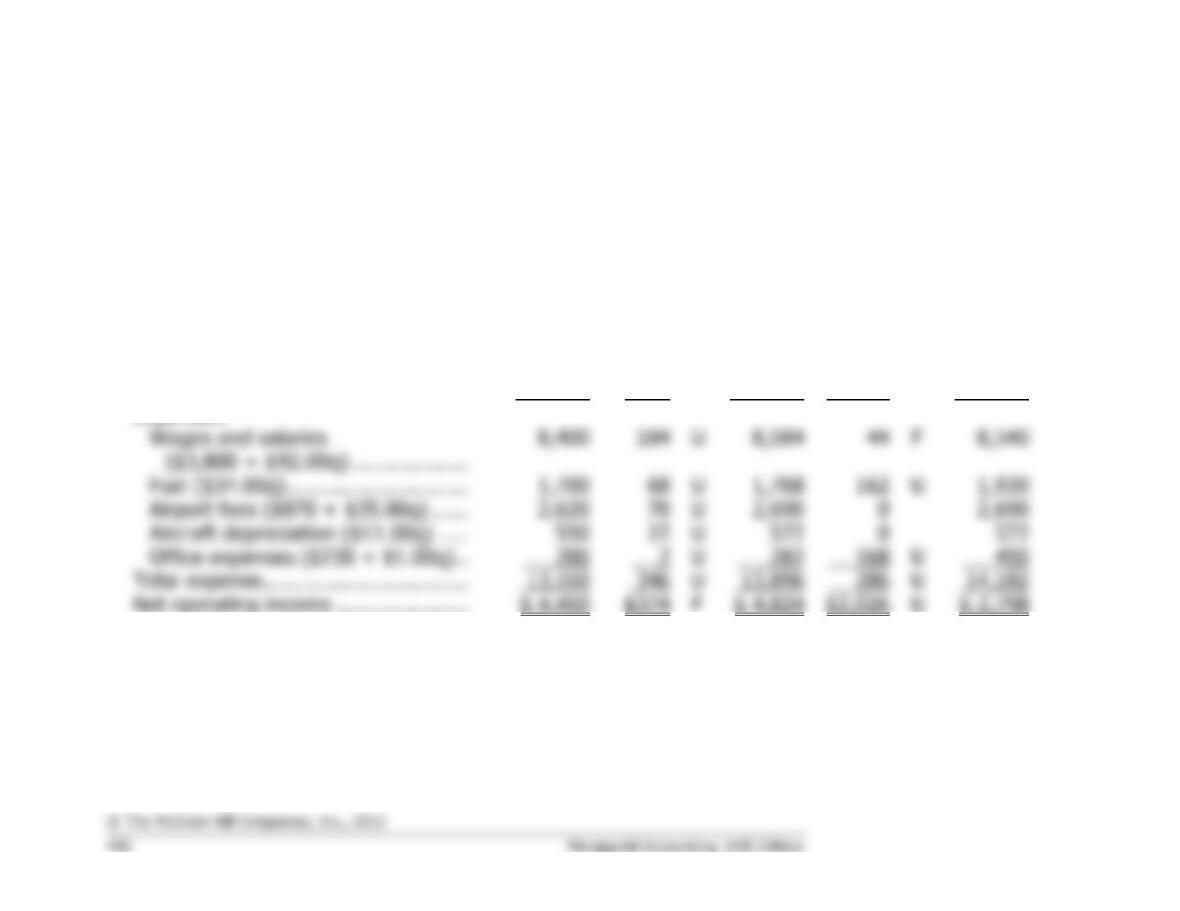
Olympia Bivalve
Revenue and Spending Variances
For the Month Ended July 31
Flexible
Budget
Actual
Results
Revenue
and
Spending
Variances
Pounds …………………………………
7,000
7,000
Revenue ($4.20q) ……………………
$29,400
$28,600
$ 800
U
Expenses:
Packing supplies ($0.40q) ……….
2,800
2,970
170
U
Shipping ($0.75q) …………………
5,250
4,980
270
F
Utilities ($1,260) …………………..
1,260
1,070
190
F
U
Net operating income ………………
$ 8,190
$1,400
U
Exercise 9-4 (20 minutes)
1.
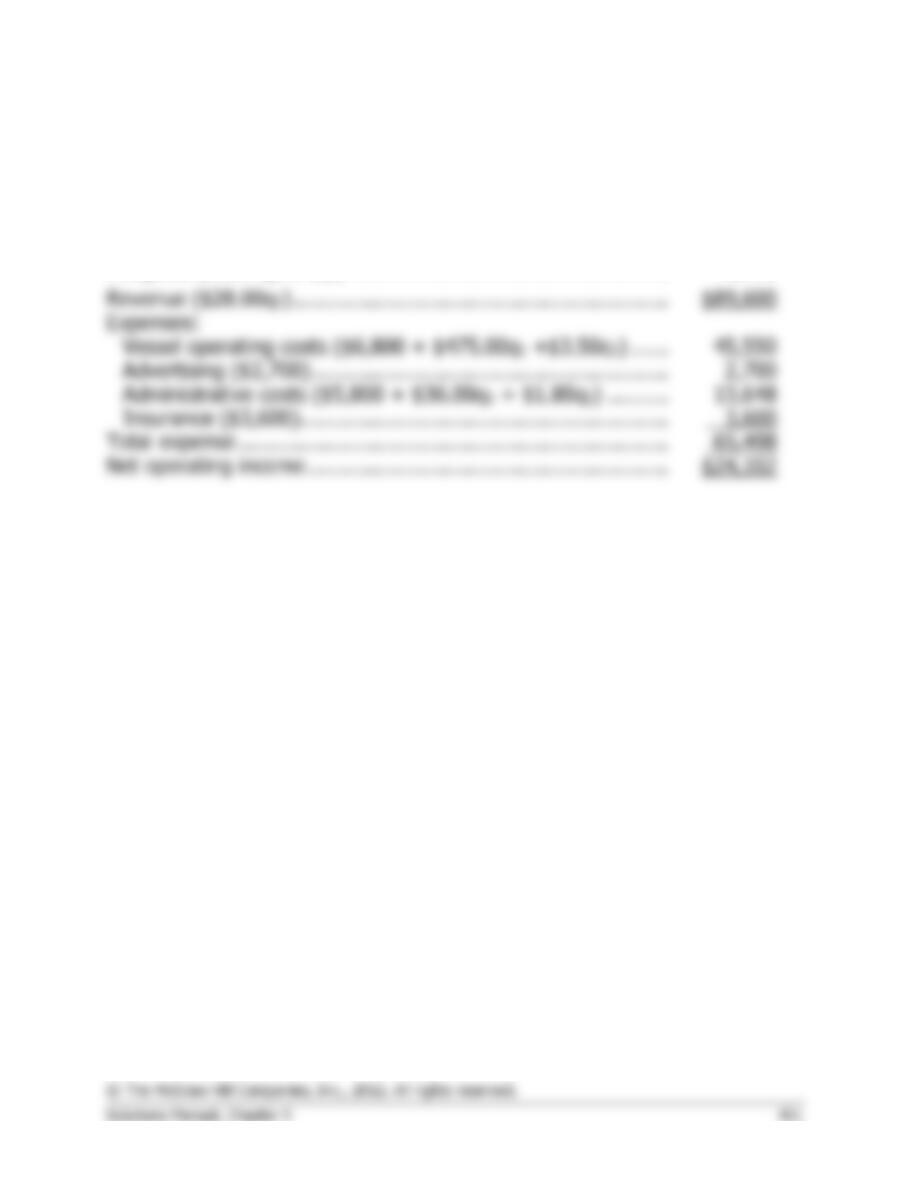
Mt. Hood Air
Flexible Budget Performance Report
For the Month Ended August 31
Planning
Budget
Activity
Variances
Flexible
Budget
Revenue
and
Spending
Variances
Actual
Results
Flights (q) ………………………………..
50
52
52
Revenue ($360.00q) …………………..
$18,000
$720
F
$18,720
$1,740
U
$16,980
Expenses:
U
U
U
U
U
168
U
450
Total expense …………………………...
U
U
Net operating income …………………
$374
F
$2,026
U
2. The overall activity variance is $374 favorable and is due to an increase in activity. The $1,740
unfavorable revenue variance is very large relative to the company’s net operating income and should
be investigated. Was this due to discounts given or perhaps a lower average number of passengers
per flight than usual? The other variances are relatively small, but are worth some management
attention—particularly if they recur next month.
Exercise 9-5 (15 minutes)
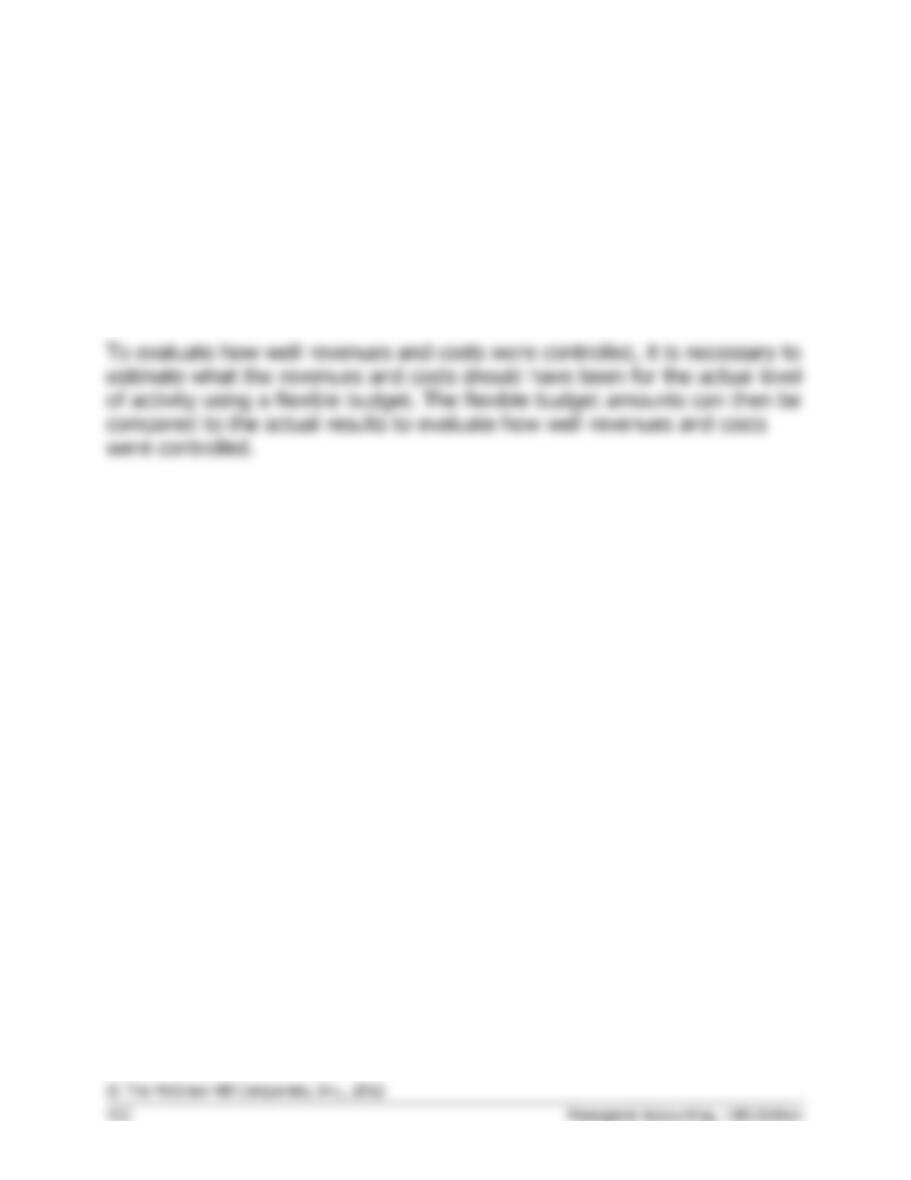
Icicle Bay Tours
Planning Budget
For the Month Ended August 31
Budgeted cruises (q1) ………………………………………………….
58
Budgeted passengers (q2) ……………………………………………
3,200
Expenses:
Net operating income ………………………………………………….
Exercise 9-6 (10 minutes)
The variance report compares the planning budget to actual results and
should
not
be used to evaluate how well costs were controlled during May.
The planning budget is based on 200 jobs, but the actual results are for
208 jobs. Consequently, the actual revenues and many of the actual costs
should
have been different from what was budgeted at the beginning of
the period. Direct comparisons of budgeted to actual costs are valid only if
the costs are fixed.
Exercise 9-7 (15 minutes)
The adjusted budget was created by multiplying each item in the budget
by the ratio 208/200; in other words, each item was adjusted upward by
4%. This procedure provides valid benchmarks for revenues and for costs
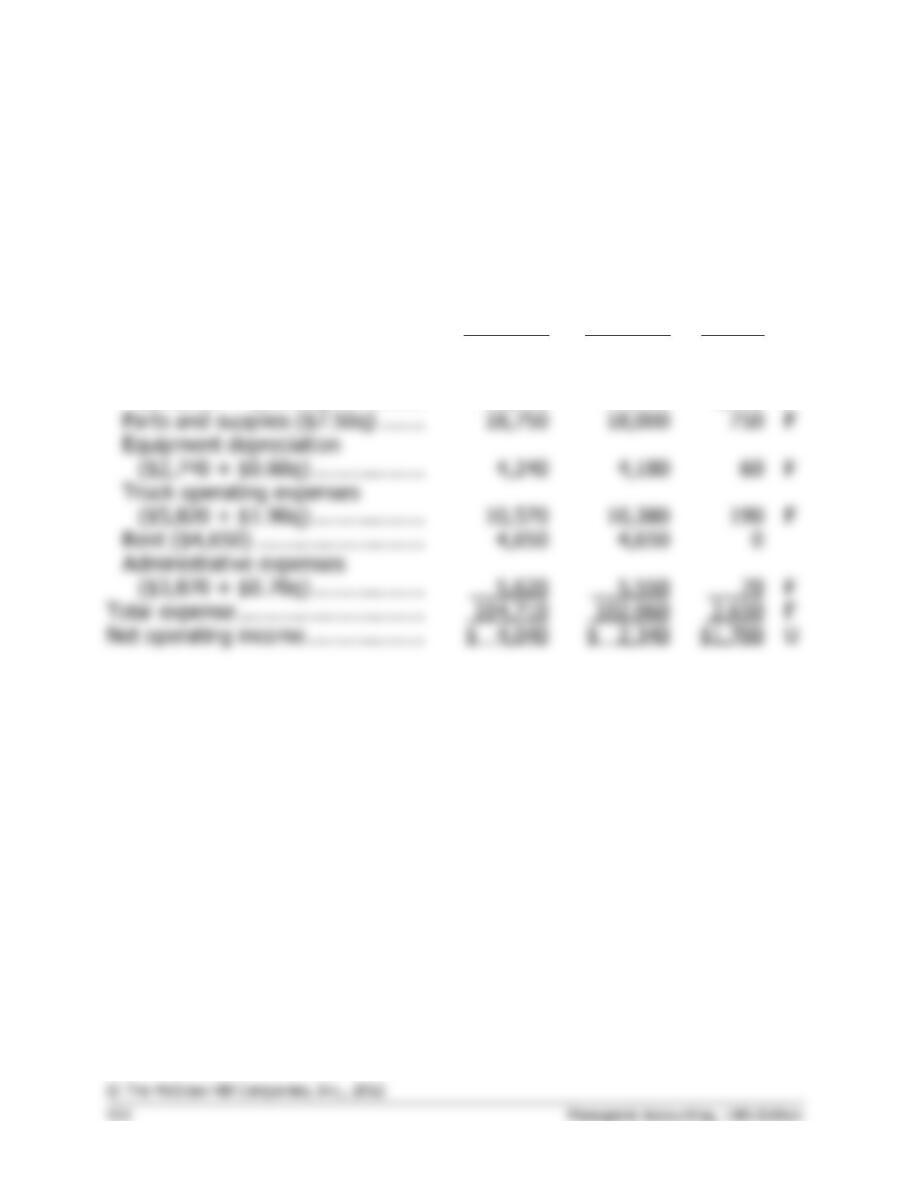
Exercise 9-8 (20 minutes)
Harold’s Roof Repair
Activity Variances
For the Month Ended June 30
Planning
Budget
Flexible
Budget
Activity
Variances
Repair-hours (q) ……………………..
2,500
2,400
Revenue ($43.50q) ………………….
$108,750
$104,400
$4,350
U
Expenses:
Wages and salaries
($21,380 + $15.80q) …………..
60,880
59,300
1,580
F
18,750
18,000
F
Equipment depreciation
($2,740 + $0.60q) ………………
F
Truck operating expenses
F
Administrative expenses
F
Net operating income ……………….
$1,700
U
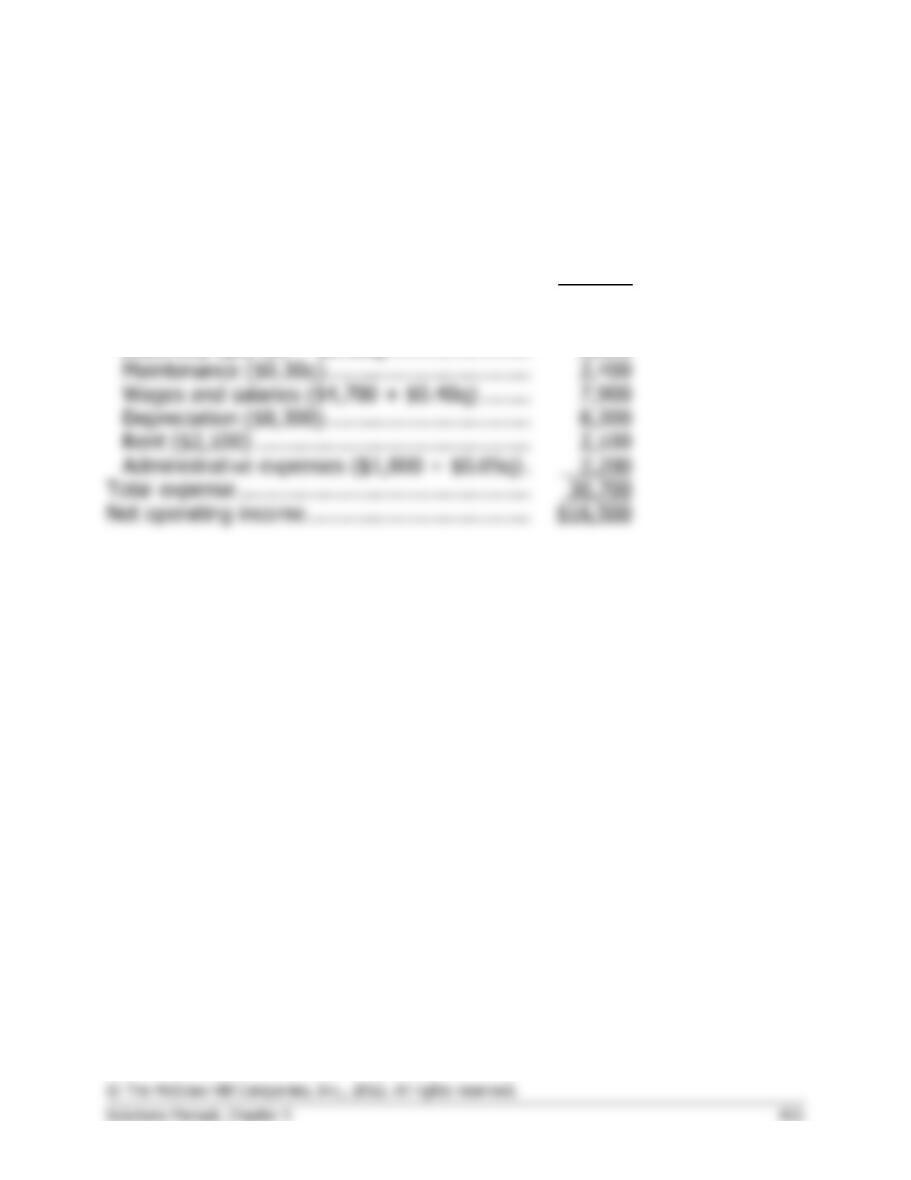
Exercise 9-9 (15 minutes)
Auto Lavage
Planning Budget
For the Month Ended October 31
Budgeted cars washed (q) ………………………..
8,000
Revenue ($5.90q) …………………………………..
$47,200
Expenses:
Cleaning supplies ($0.70q) ……………………..
5,600
Electricity ($1,400 + $0.10q) ………………….
2,200
Wages and salaries ($4,700 + $0.40q) ……..
7,900
Depreciation ($8,300) …………………………...
8,300
Administrative expenses ($1,800 + $0.05q) .
Total expense ………………………………………..
Net operating income ………………………………
$16,500
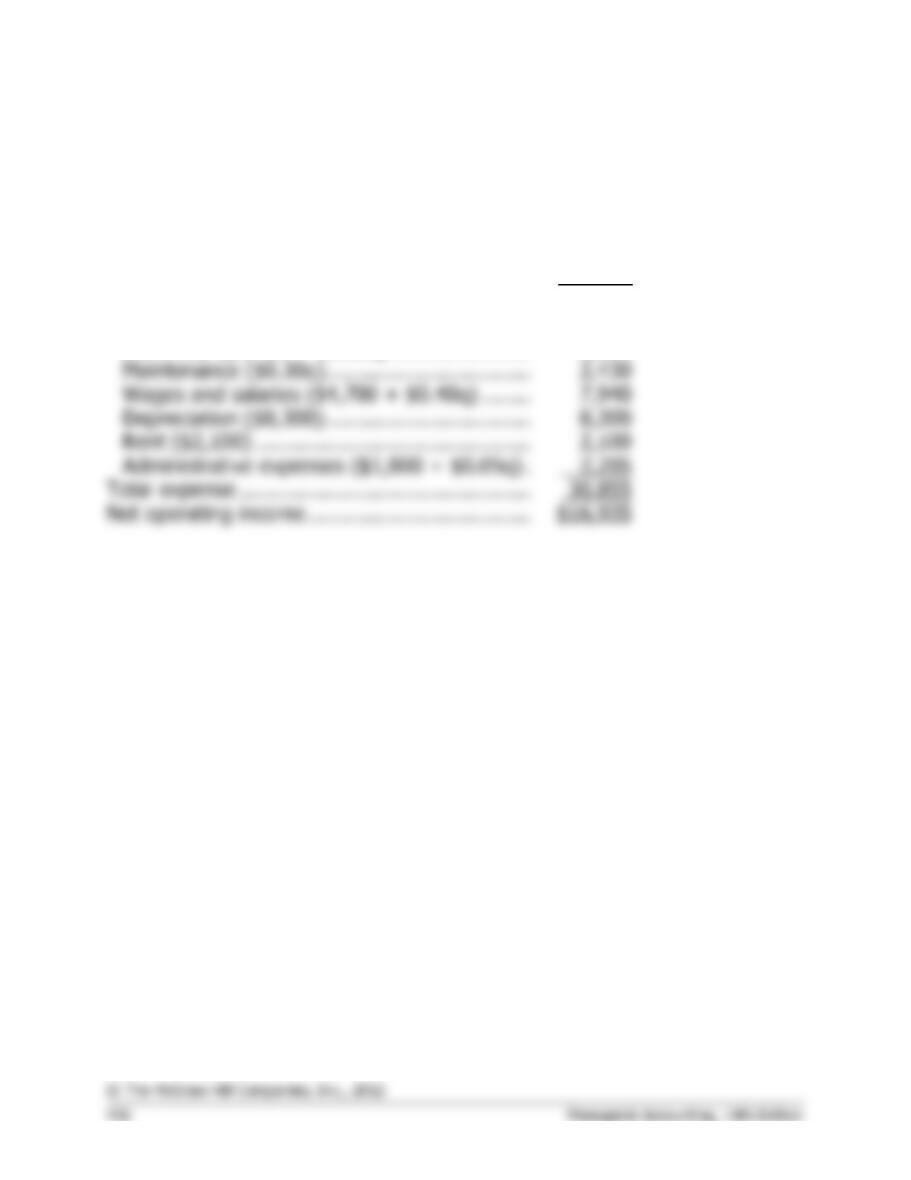
Exercise 9-10 (15 minutes)
Auto Lavage
Flexible Budget
For the Month Ended October 31
Actual cars washed (q) …………………………....
8,100
Revenue ($5.90q) …………………………………..
$47,790
Expenses:
Cleaning supplies ($0.70q) ……………………..
5,670
Electricity ($1,400 + $0.10q) ………………….
2,210
Wages and salaries ($4,700 + $0.40q) ……..
7,940
Depreciation ($8,300) …………………………...
8,300
Administrative expenses ($1,800 + $0.05q) .
Total expense ………………………………………..
Net operating income ………………………………
$16,935
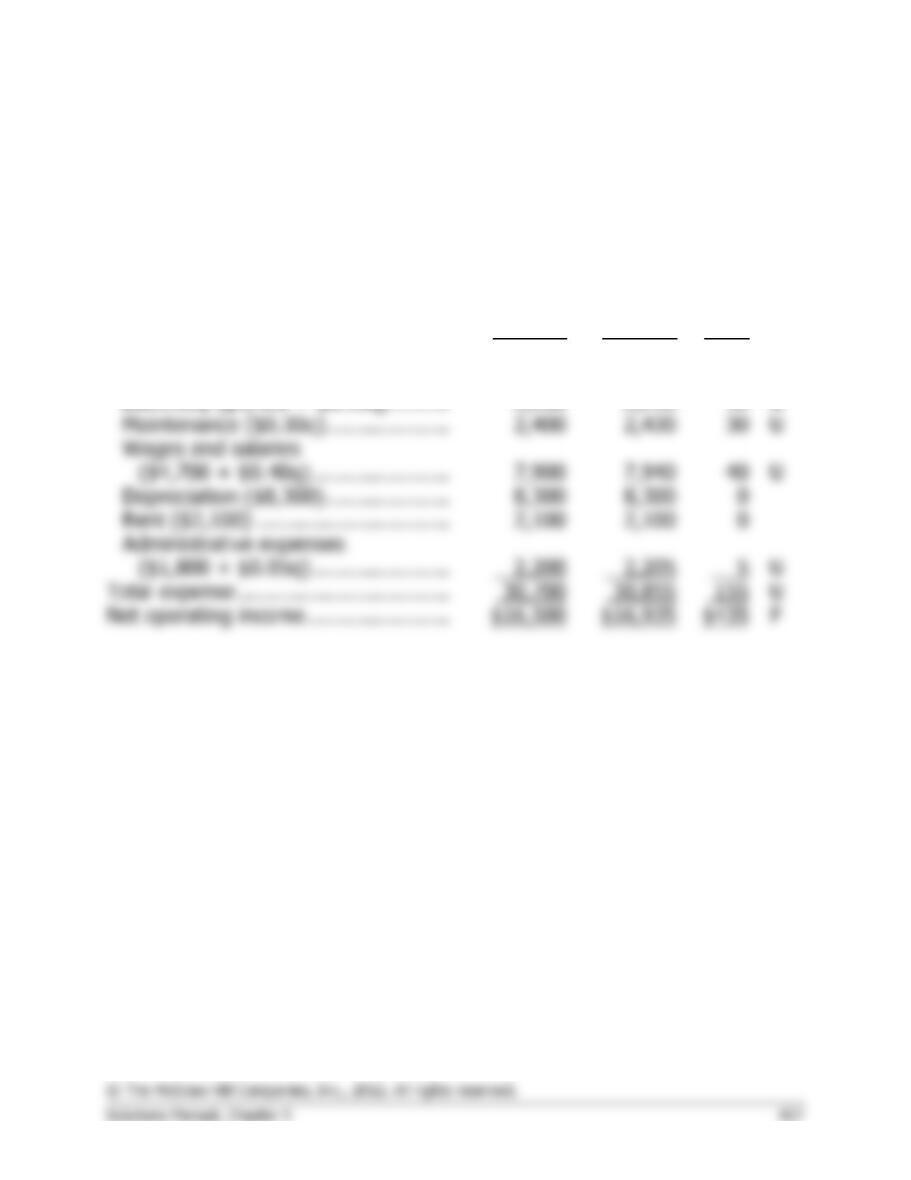
Exercise 9-11 (20 minutes)
Auto Lavage
Activity Variances
For the Month Ended October 31
Planning
Budget
Flexible
Budget
Activity
Variances
Cars washed (q) …………………………
8,000
8,100
Revenue ($5.90q) ……………………….
$47,200
$47,790
$590
F
Expenses:
Cleaning supplies ($0.70q) ………….
5,600
5,670
70
U
U
Maintenance ($0.30q)………………..
2,400
2,430
30
U
U
Depreciation ($8,300) ………………..
8,300
8,300
Rent ($2,100) ………………………….
2,100
2,100
U
Total expense …………………………….
U
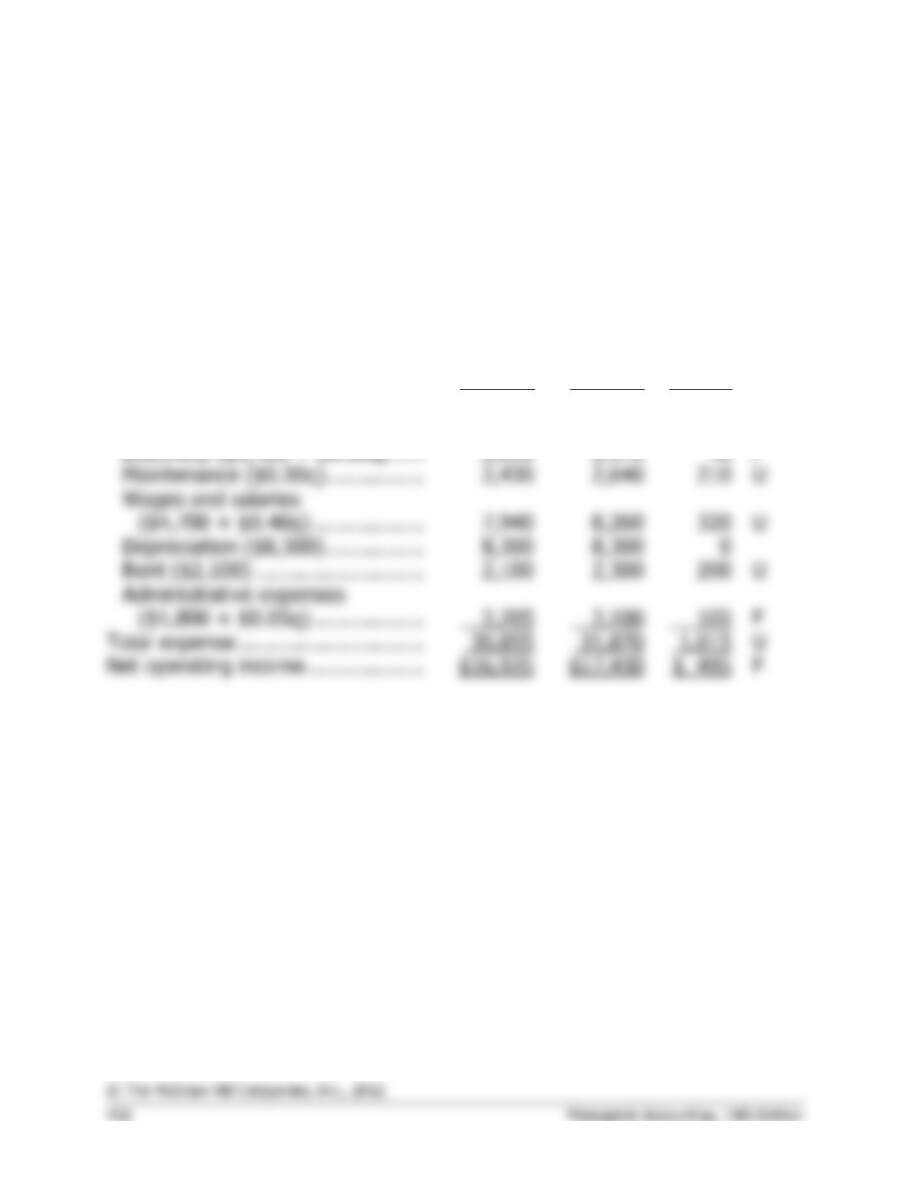
Exercise 9-12 (20 minutes)
Auto Lavage
Revenue and Spending Variances
For the Month Ended October 31
Flexible
Budget
Actual
Results
Revenue
and
Spending
Variances
Cars washed (q) ……………………..
8,100
8,100
Revenue ($5.90q) ……………………
$47,790
$49,300
$1,510
F
Expenses:
Cleaning supplies ($0.70q) ………
5,670
6,100
430
U
Electricity ($1,400 + $0.10q) …..
2,210
2,170
F
U
7,940
8,260
320
U
Rent ($2,100) ………………………
2,100
2,300
200
U
F
Total expense …………………………
30,855
U
Net operating income ……………….
$16,935
$17,430
F
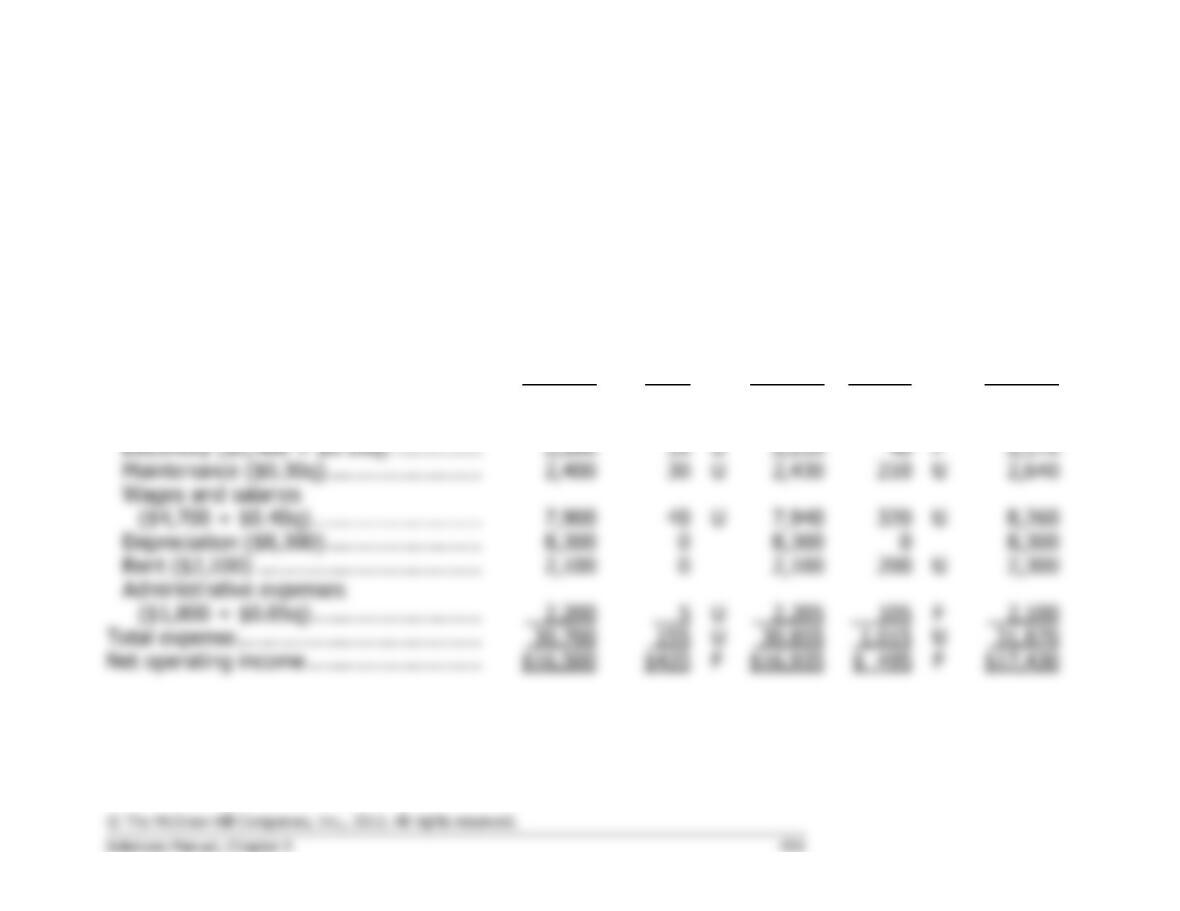
Exercise 9-13 (30 minutes)
Auto Lavage
Flexible Budget Performance Report
For the Month Ended October 31
Planning
Budget
Activity
Variances
Flexible
Budget
Revenue
and
Spending
Variances
Actual
Results
Cars washed (q) ……………………………..
8,000
8,100
8,100
Revenue ($5.90q) …………………………...
$47,200
$590
F
$47,790
$1,510
F
$49,300
Expenses:
Cleaning supplies ($0.70q) ………………
5,600
70
U
5,670
430
U
6,100
U
F
U
U
Depreciation ($8,300) …………………….
8,300
8,300
8,300
Rent ($2,100) ………………………………
2,100
2,100
200
U
2,300
5
U
F
Total expense …………………………………
U
30,855
U
31,870
Net operating income ……………………….
$16,500
$435
F
$16,935
F
$17,430
Exercise 9-14 (10 minutes)
Pierr Manufacturing Inc.
Planning Budget for Manufacturing Costs
For the Month Ended July 31
Budgeted machine-hours (q) ……..
4,000
Direct materials ($5.70q) …………..
$22,800
Supplies ($0.20q) ……………………
Utilities ($1,600 + $0.15q) ………..
2,200
Insurance ($11,400) ………………..
Total manufacturing cost …………..
$94,900
Exercise 9-15 (45 minutes)
1. The variance report should
not
be used to evaluate how well costs were
controlled. In August, the planning budget was based on 200 lessons,
but the actual results are for 210 jobs—an increase of 5% over budget.
2. See the following page.
3. The overall activity variance for net operating income was $670 F
(favorable). That means that as a consequence of the increase in
activity from 200 lessons to 210 lessons, the net operating income
should have been up $670 over budget. However, it wasn’t. The
budgeted net operating income was $6,880 and the actual net operating
income was $7,110, so the profit was up by only $230—not $670 as it
should have been. There are many reasons for this—as shown in the
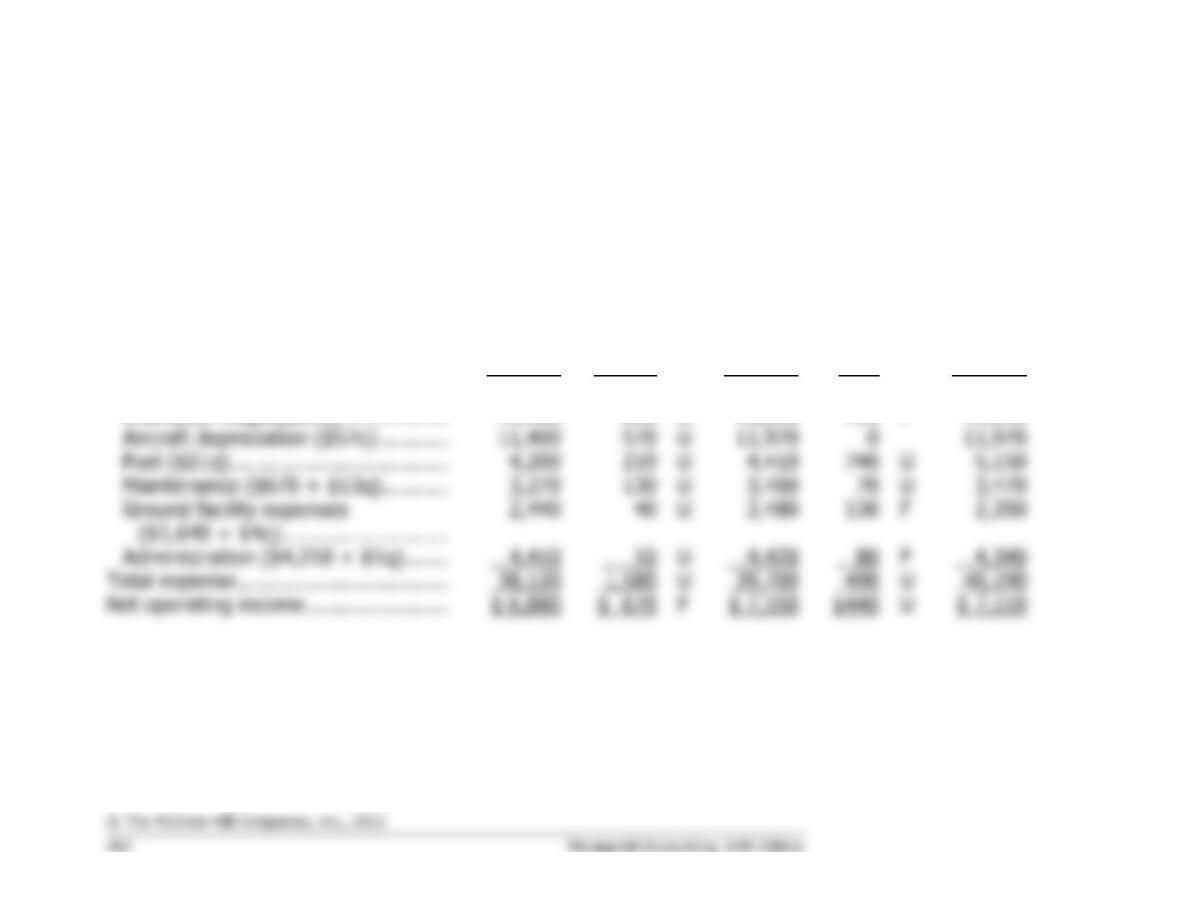
Problem 9-15 (continued)
Wings Flight School
Flexible Budget Performance Report
For the Month Ended August 31
Planning
Budget
Activity
Variances
Flexible
Budget
Revenue
and
Spending
Variances
Actual
Results
Lessons (q) ……………………………….
200
210
210
Revenue ($225q) ………………………..
$45,000
$2,250
F
$47,250
$ 50
F
$47,300
Expenses:
Instructor wages($62q) ……………..
12,400
620
U
13,020
110
F
12,910
U
Fuel ($21q) ……………………………..
210
U
740
U
Maintenance ($670 + $13q) ………..
130
U
U
Administration ($4,210 + $1q) …….
U
80
F
Total expense …………………………….
U
U
Net operating income …………………..
F
$ 7,550
U
$ 7,110
Exercise 9-16 (45 minutes)
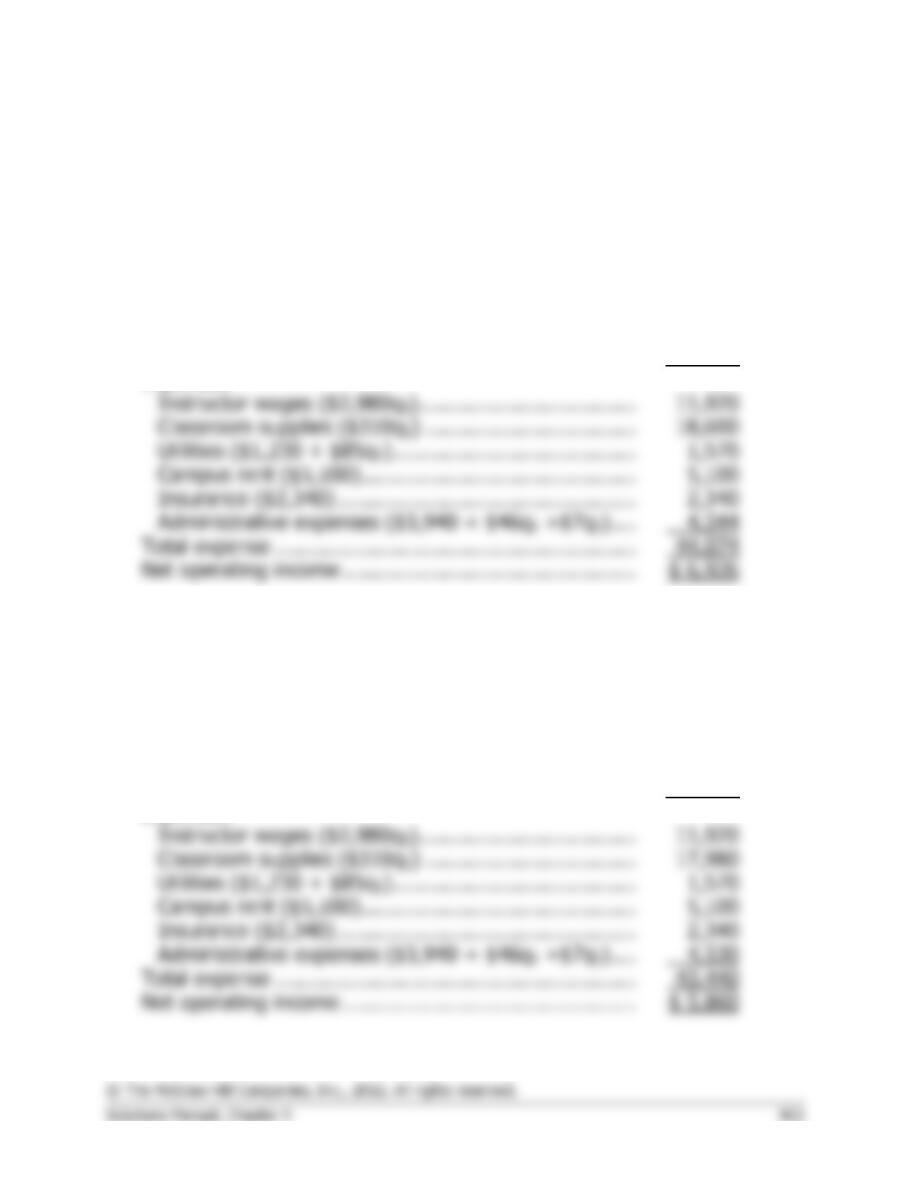
1. The planning budget based on 4 courses and 60 students appears
below:
Toque Cooking Academy
Planning Budget
For the Month Ended October 31
Budgeted courses (q1) ……………………………………….
4
Budgeted students (q2) ………………………………………
60
Revenue ($850q2) …………………………………………….
$51,000
Expenses:
Total expense ………………………………………………….
Net operating income ………………………………………..
2. The flexible budget based on 4 courses and 58 students appears below:
Toque Cooking Academy
Flexible Budget
For the Month Ended October 31
Actual courses (q1) ……………………………………………
4
Actual students (q2) …………………………………………..
58
Revenue ($850q2) …………………………………………….
$49,300
Expenses:
Total expense ………………………………………………….
Net operating income ………………………………………..
Exercise 9-16 (continued)
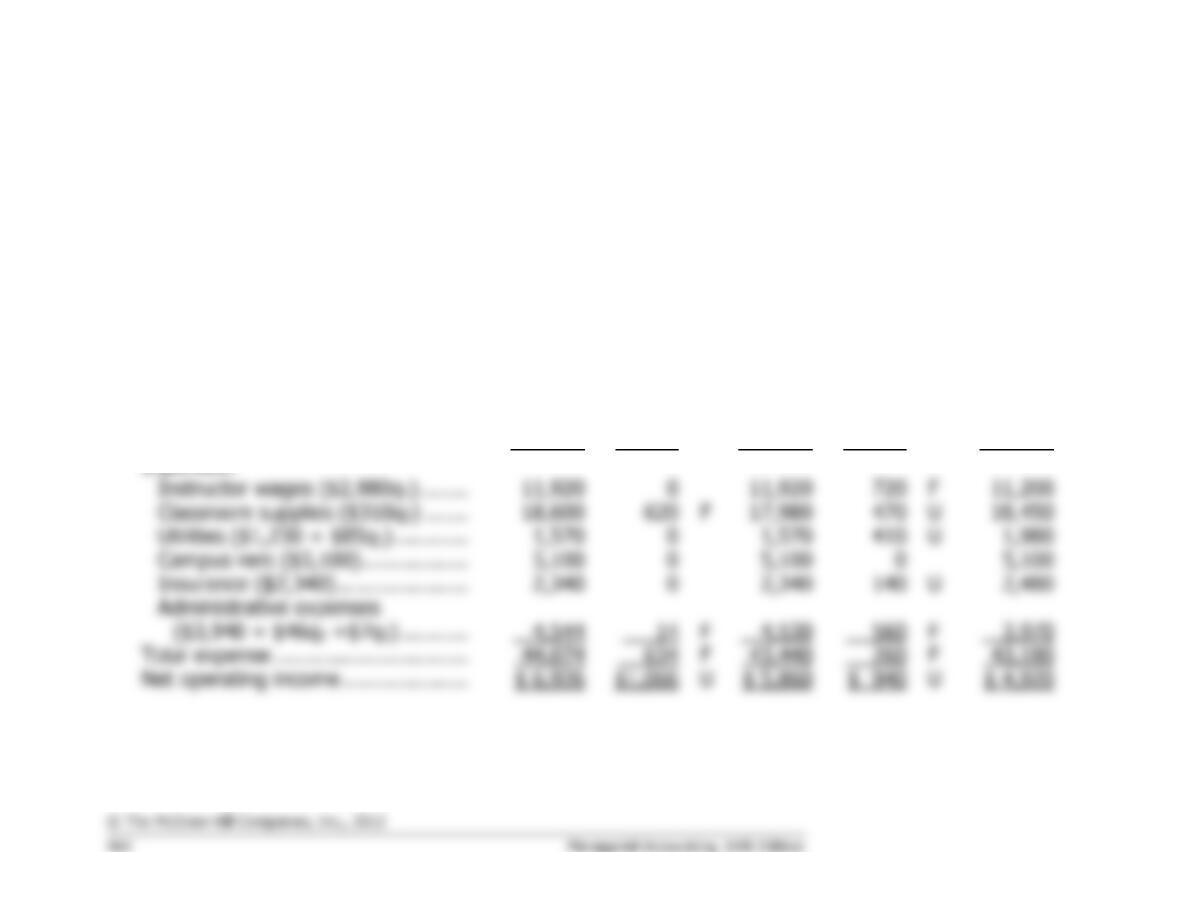
3. The flexible budget performance report for October appears below:
Toque Cooking Academy
Flexible Budget Performance Report
For the Month Ended October 31
Planning
Budget
Activity
Variances
Flexible
Budget
Revenue
and
Spending
Variances
Actual
Results
Courses (q1) …………………………...
4
4
4
Students (q2) …………………………..
60
58
58
Revenue ($850q2) …………………….
$51,000
$1,700
U
$49,300
$1,200
U
$48,100
Expenses:
F
F
U
U
U
F
560
F
Total expense ………………………….
634
F
260
F
Net operating income ………………..
U
U