208
Period Actual Forecast Error
1949 1984 1905 79
1950 1787 2018 -231
1951 1689 1697 -8
1952 1866 1644 222
Comparing the forecasting equation for the ARIMA(1,1,0) model with the forecasting
equation for the AR(2) model given in the case, we see the two equations are very
3. This question is intended to stimulate thinking about technological advances in
209
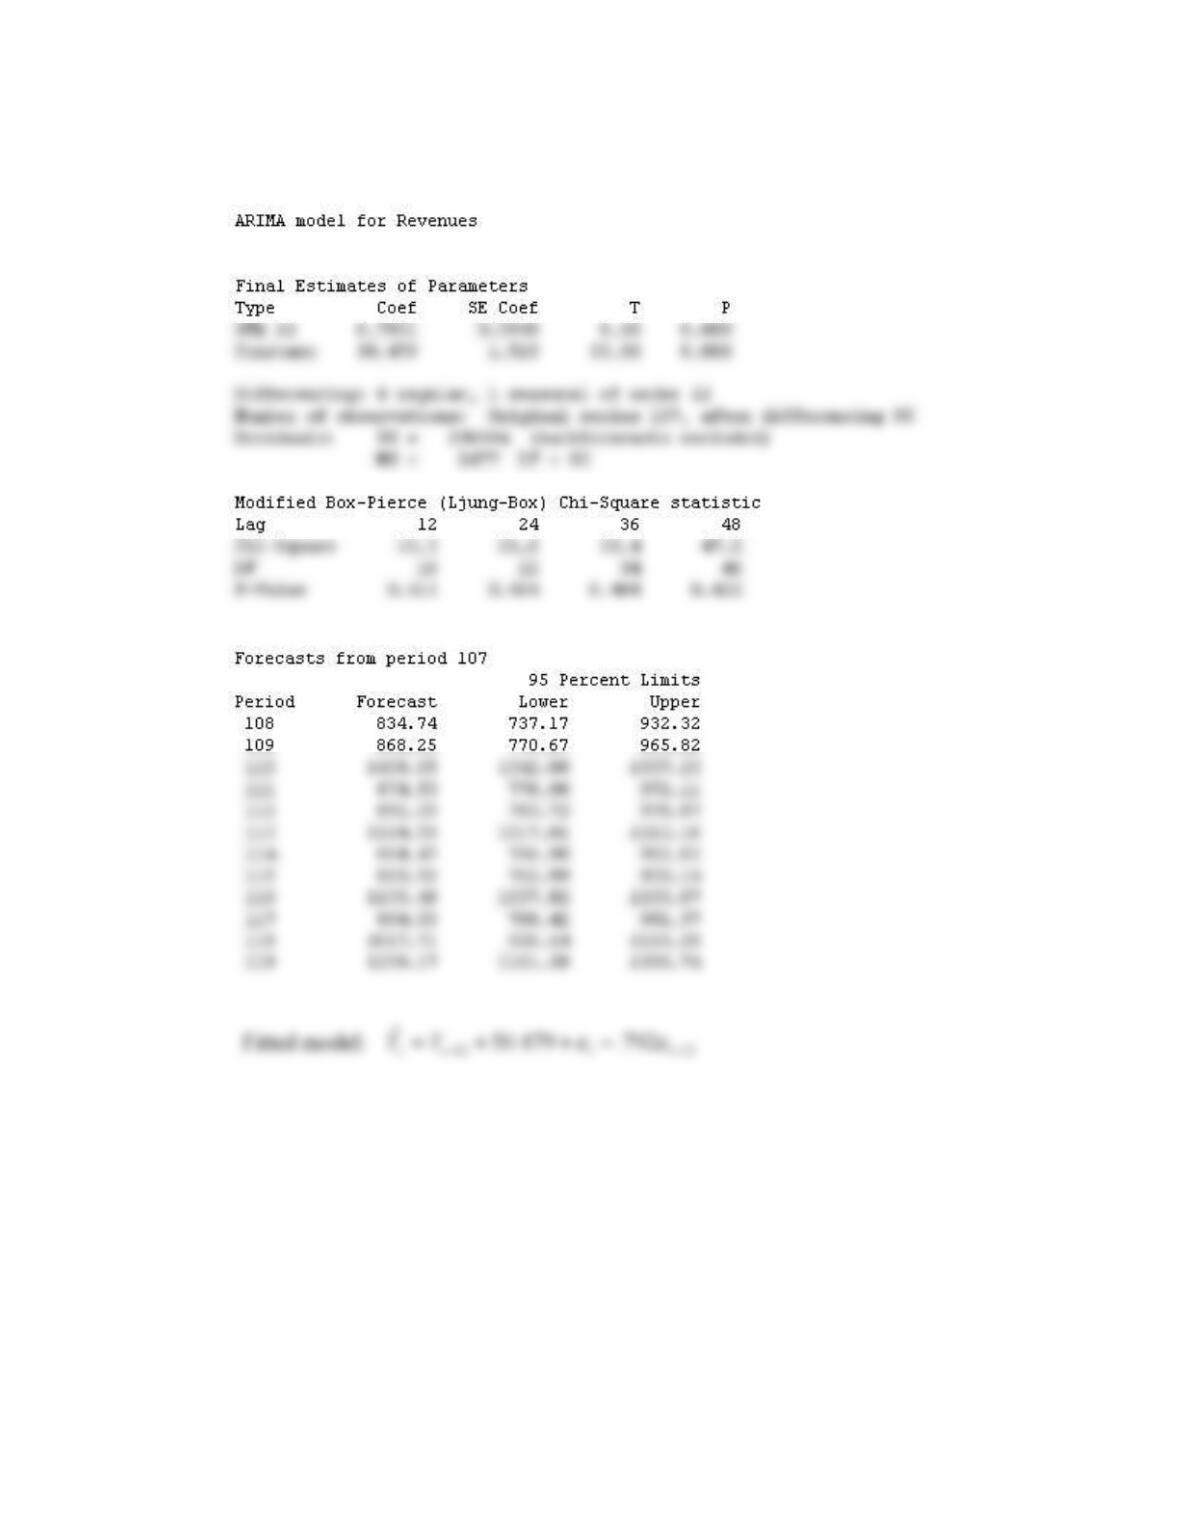
CASE 9-5: CITY OF COLLEGE STATION
1. & 2.
CASE 9-6: UPS AIR FINANCE DIVISION
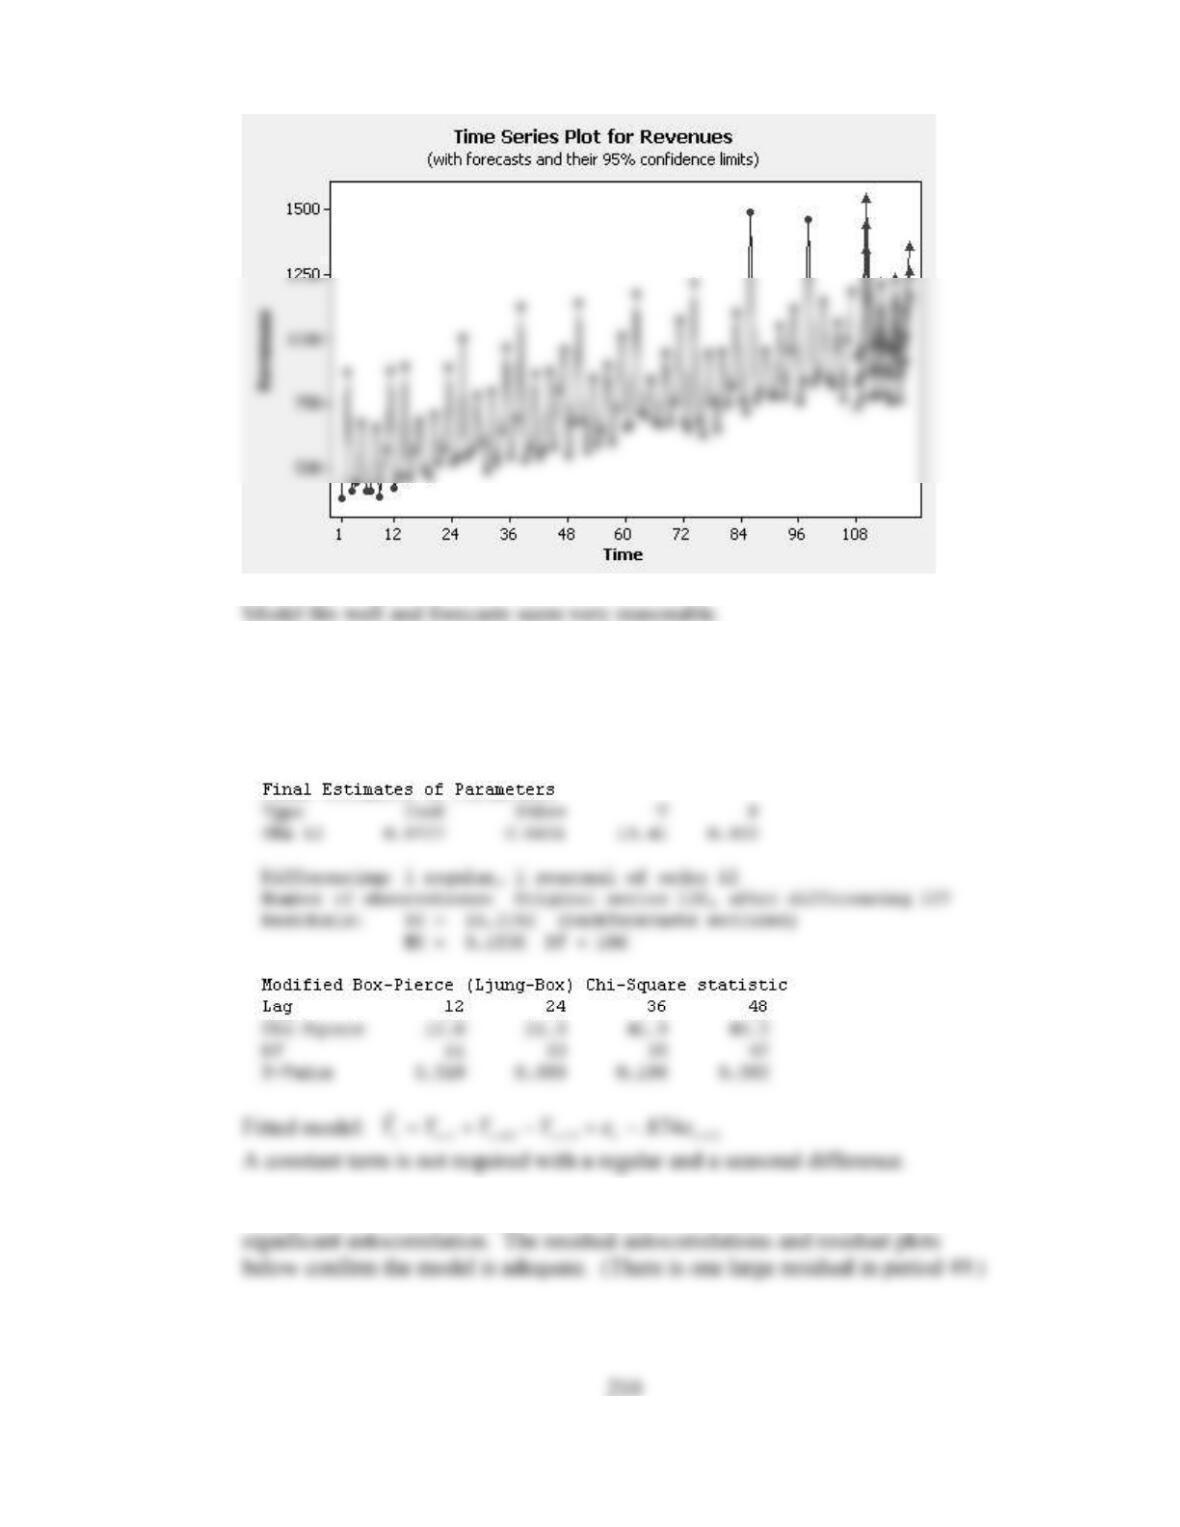
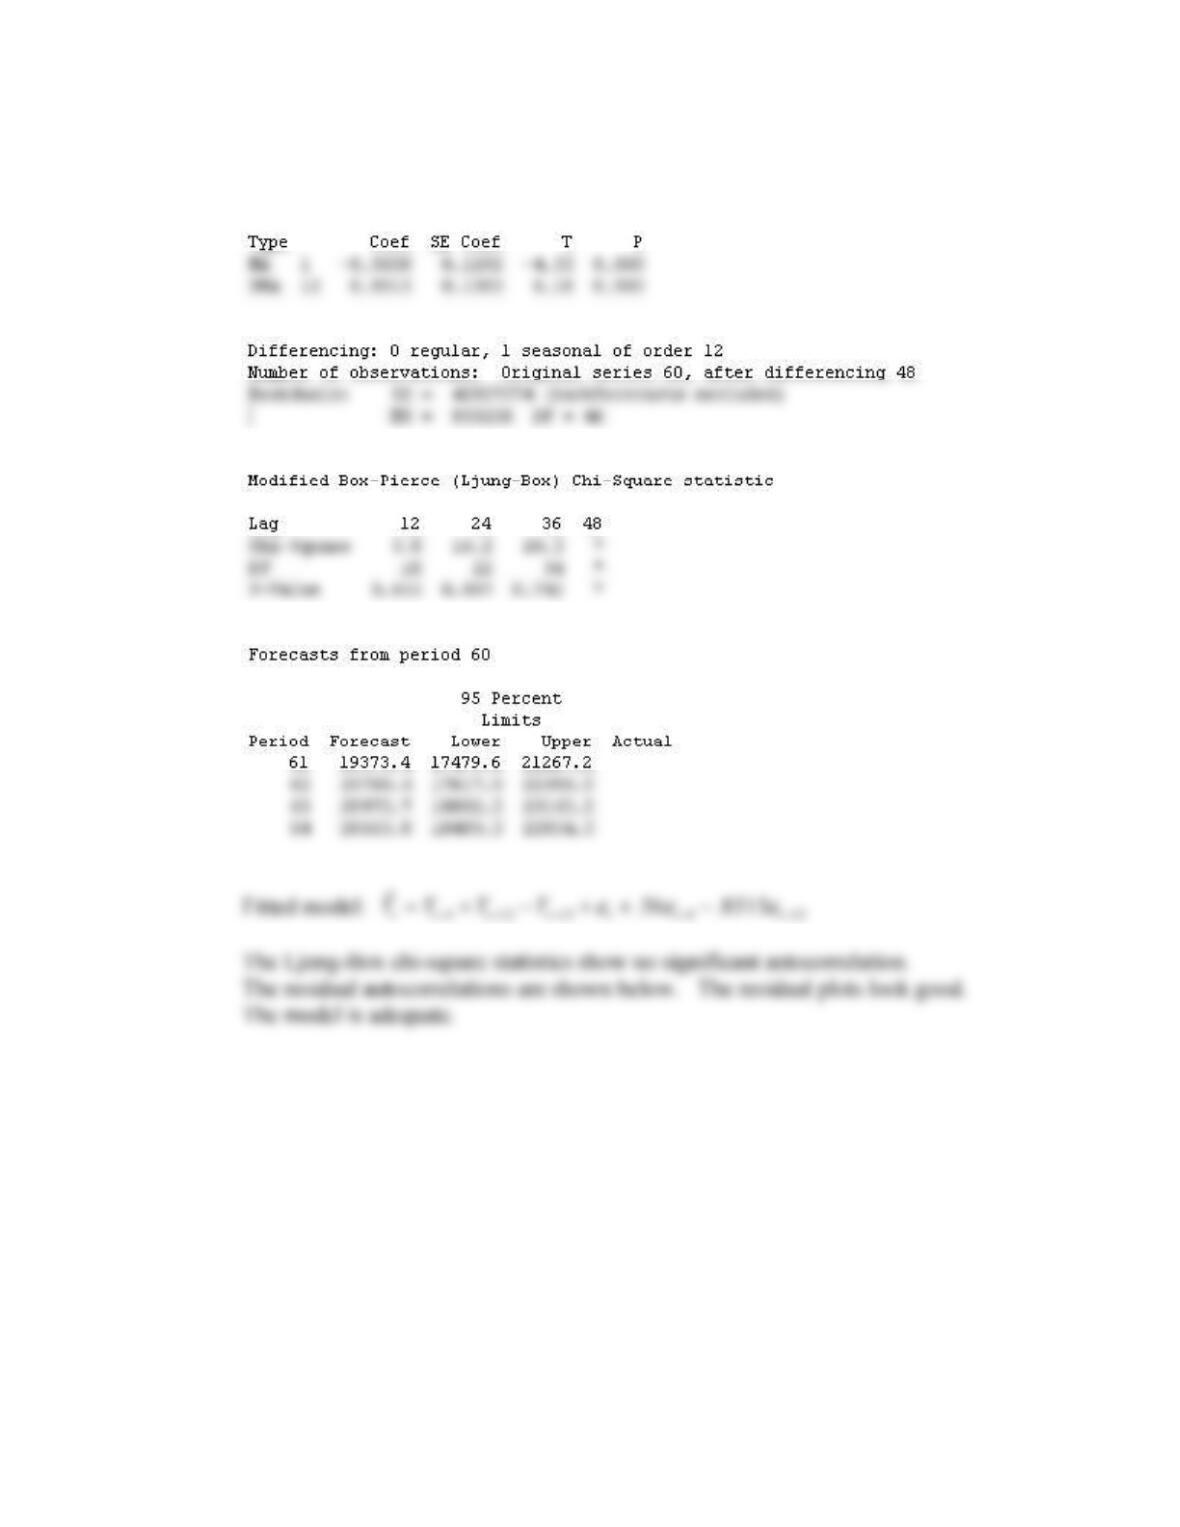
1. ARIMA(0,1,0)(0,1,1)12 model for Funding
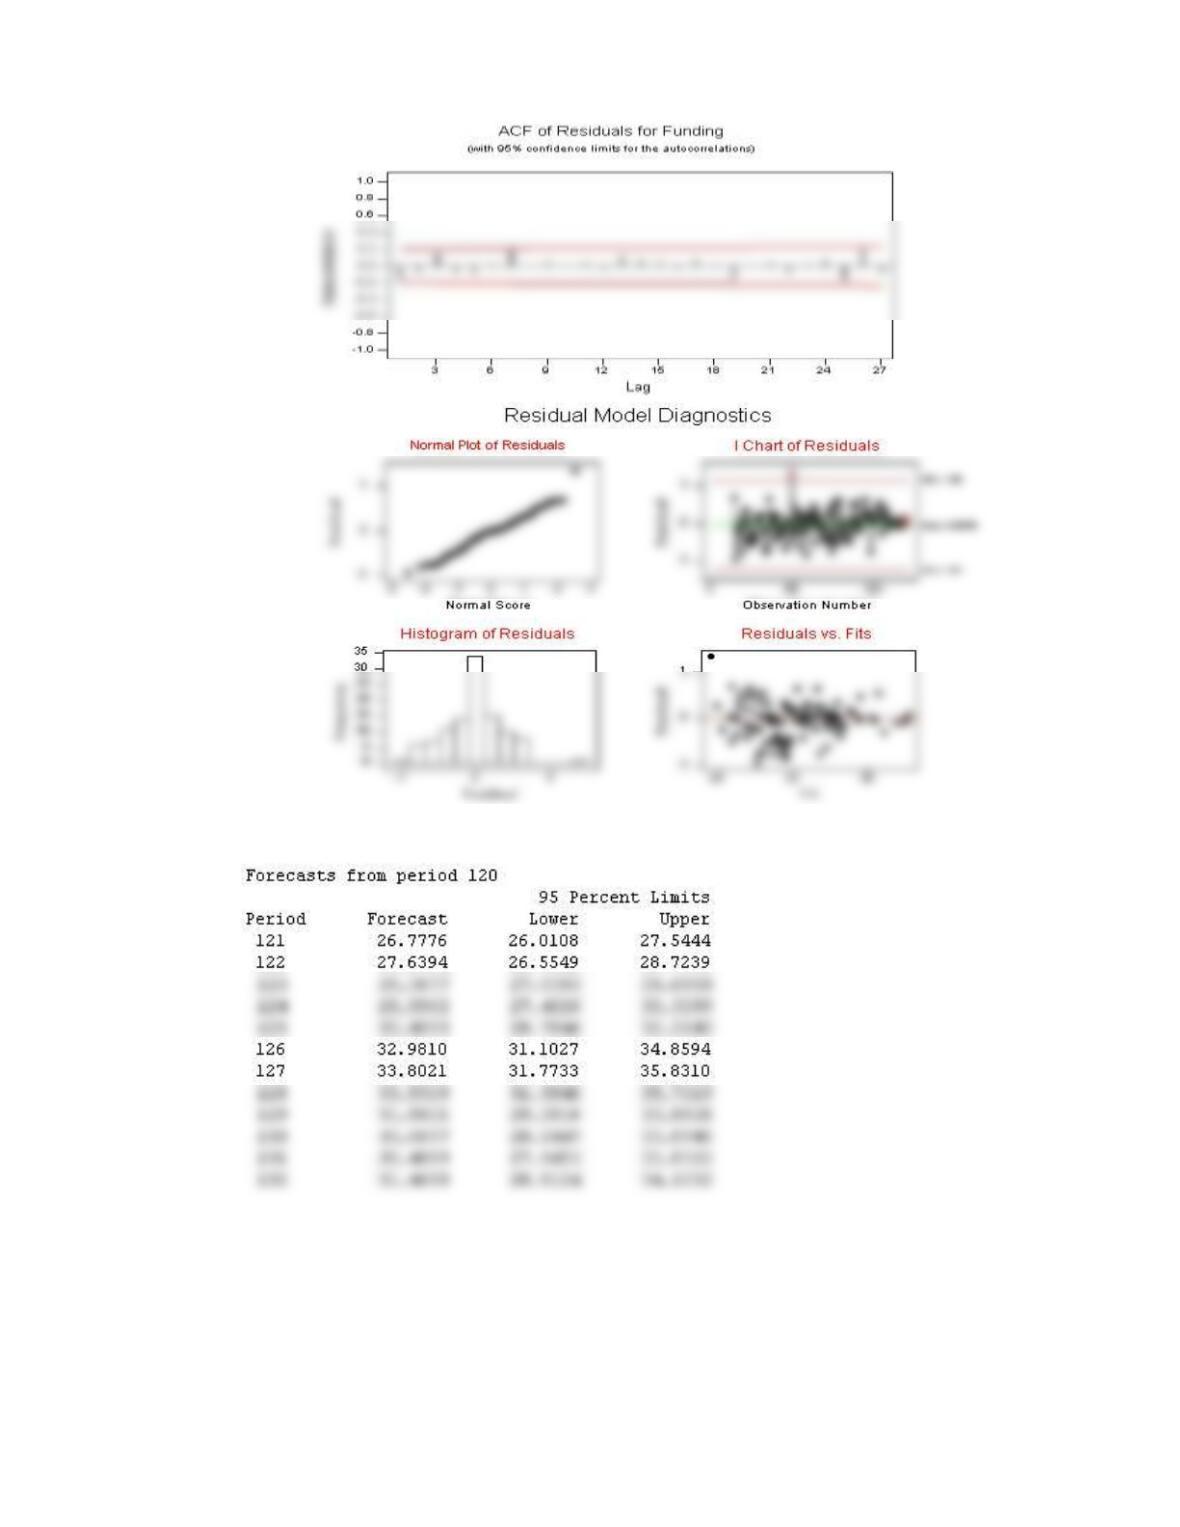
2. The model in part 1 is adequate. The Ljung-Box chi-square statistics show no
211
3. The forecasts follow.
212
CASE 9-7: AAA WASHINGTON
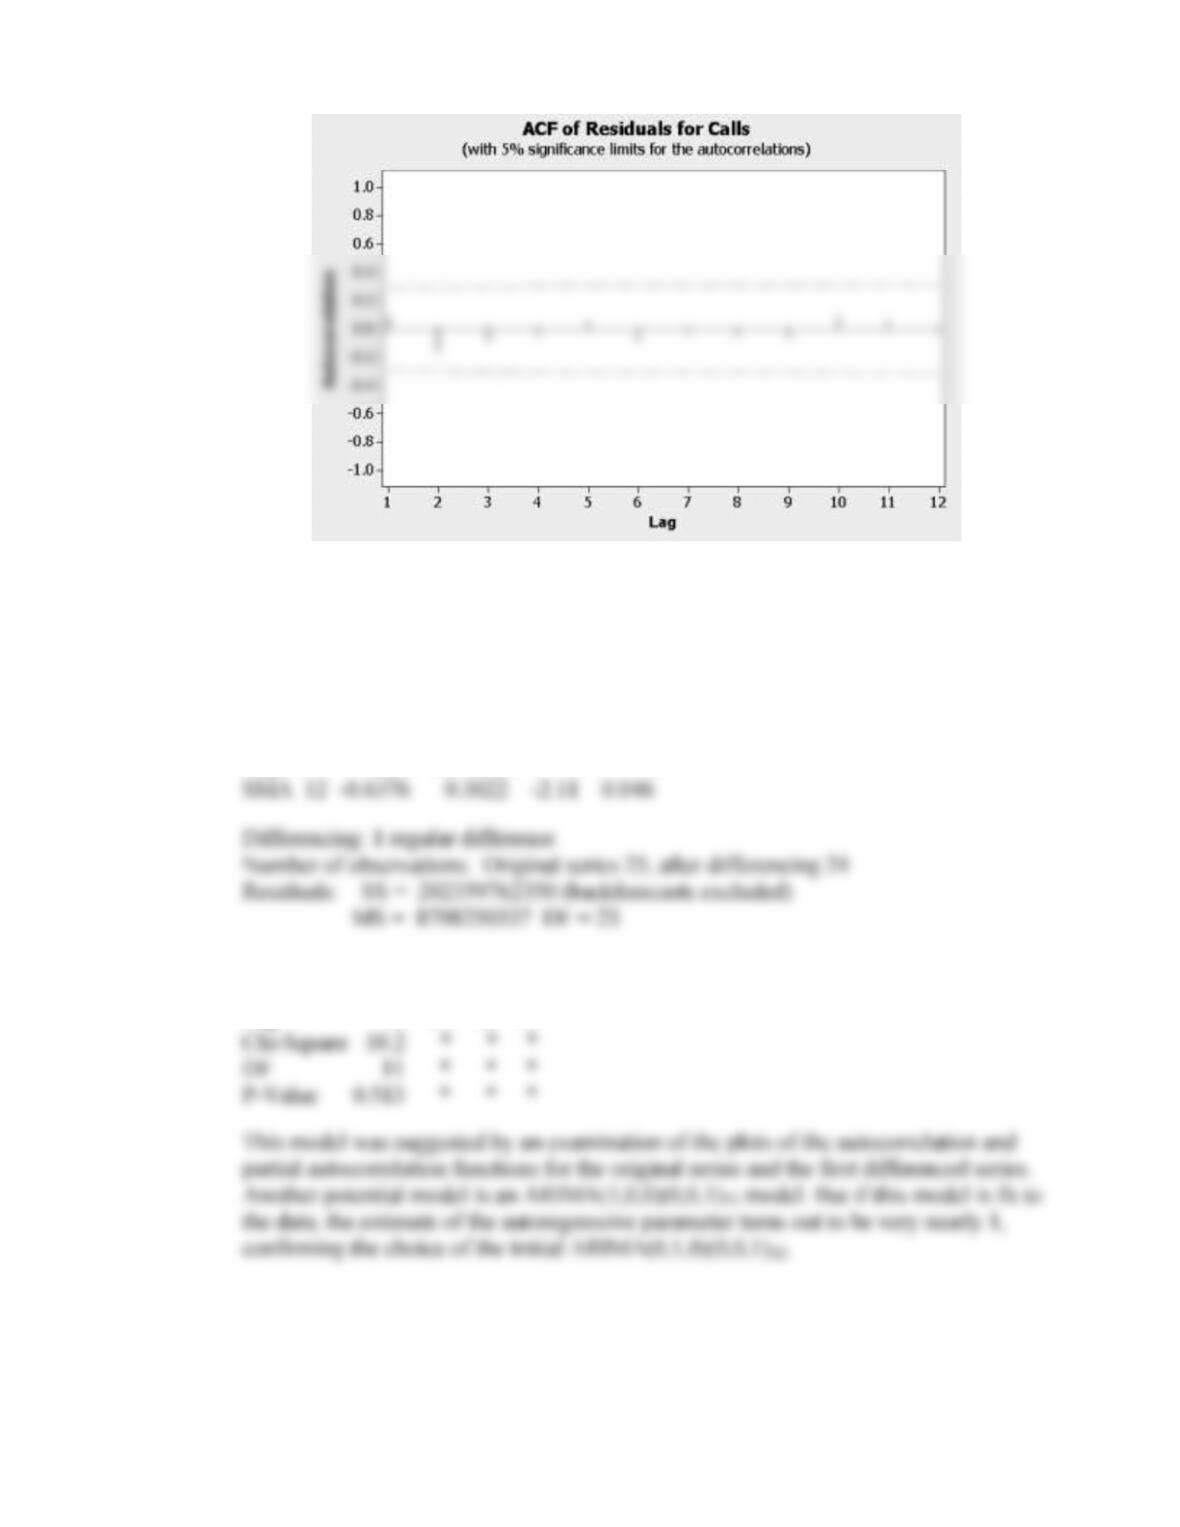
The results from fitting an ARIMA(0,0,1)(0,1,1)12 model and forecasts follow.
213
CASE 9-8: WEB RETAILER
1. Results from fitting an ARIMA(0,1,0)(0,0,1)12 model to the Contacts data follows.
Final Estimates of Parameters
Type Coef SE Coef T P
Modified Box-Pierce (Ljung-Box) Chi-Square statistic
Lag 12 24 36 48
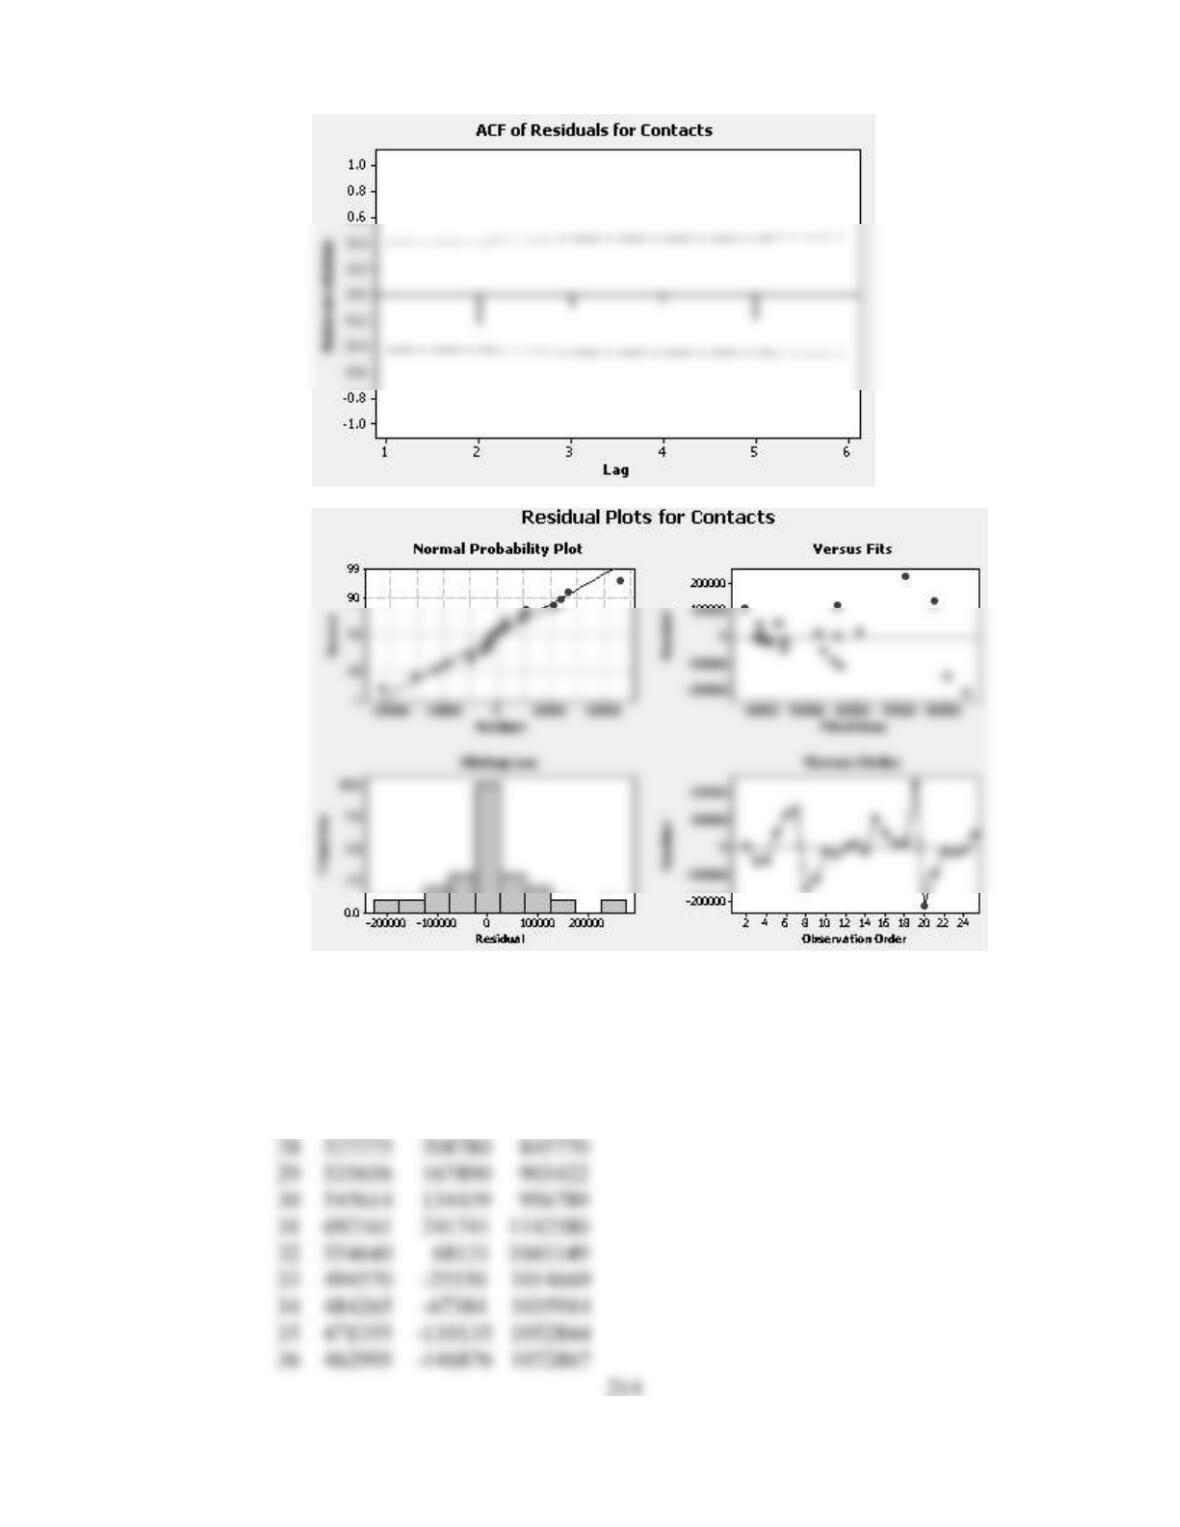
2. The model in part 1 is adequate. The is no residual autocorrelation and the residual plots
that follow look good.
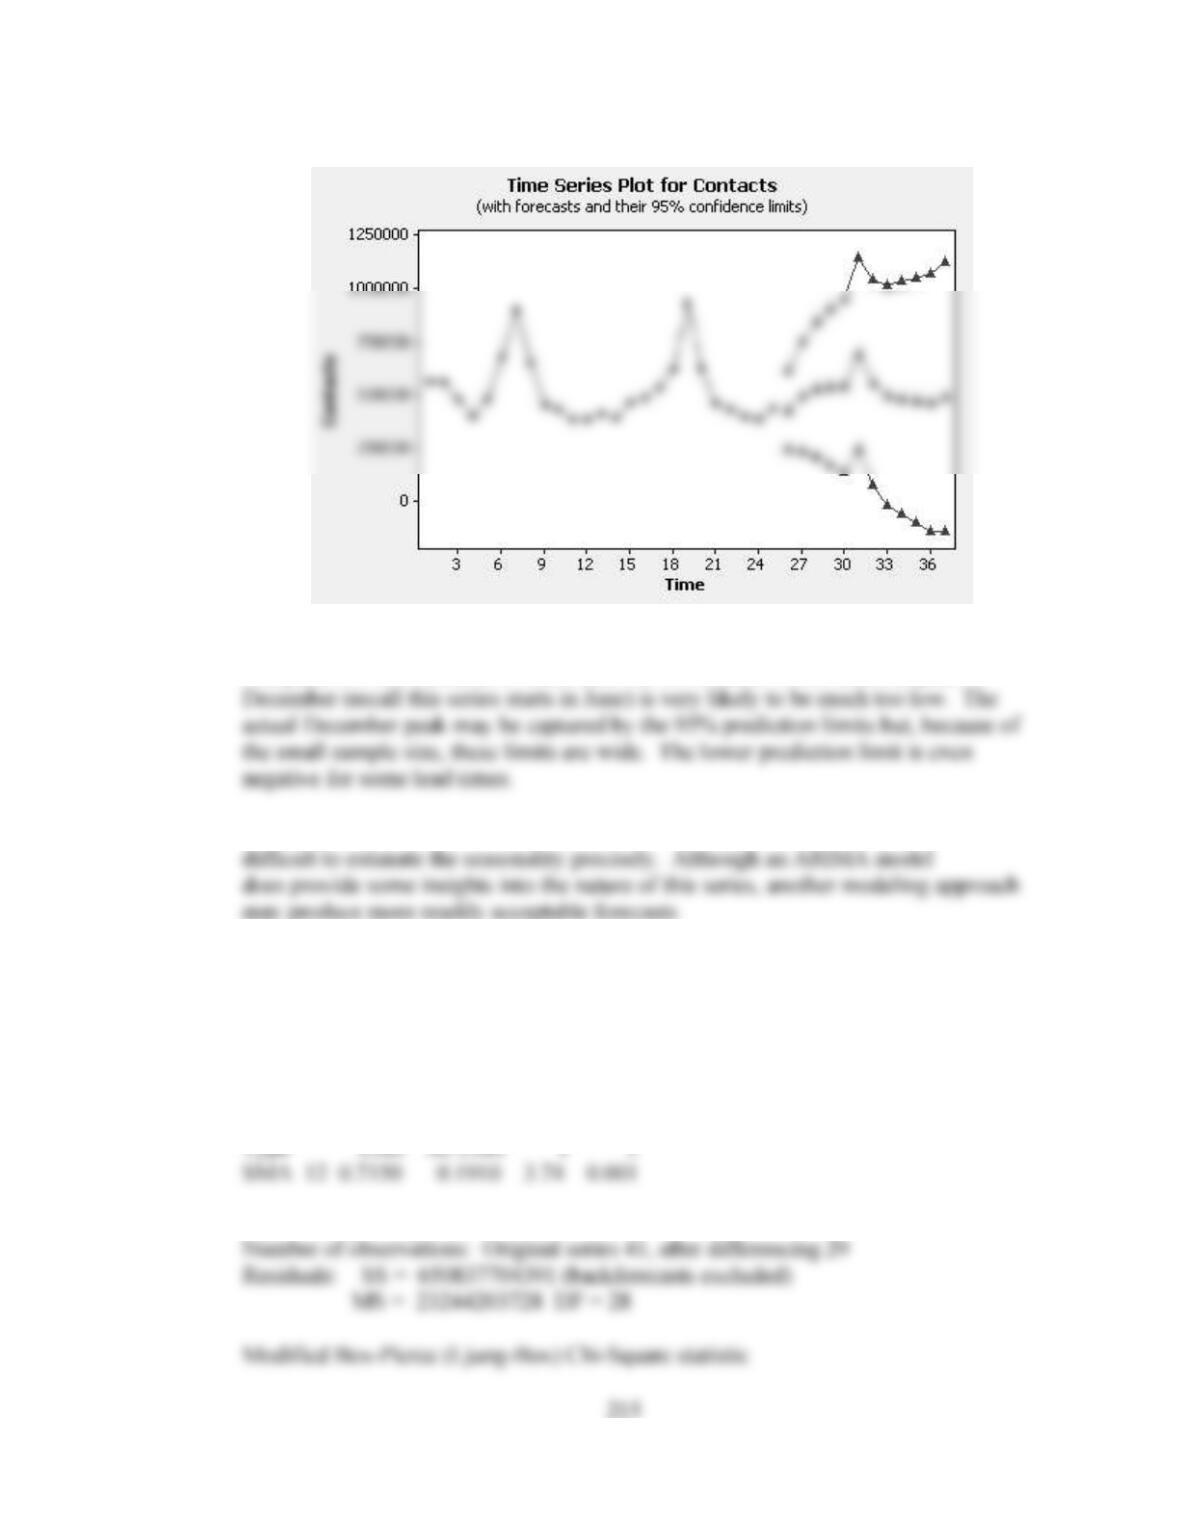
3. Forecasts from period 25
95% Limits
Period Forecast Lower Upper
26 426280 242397 610163
27 492809 232759 752859
37 491232 -145757 1128222
The pattern of the forecasts is reasonable but the forecast of the seasonal peak in
4. The sample size in this case is small. With only two years of monthly data, it is
CASE 9-9: SURTIDO COOKIES
1. Results from fitting an ARIMA(0,0,0,)(0,1,1)12 model to Surtido cookie sales follow.
Final Estimates of Parameters
Differencing: 0 regular, 1 seasonal of order 12
216
Lag 12 24 36 48
Cookie sales have a strong and quite consistent seasonal component but with
little or no growth. Following the usual pattern of looking at autocorrelations
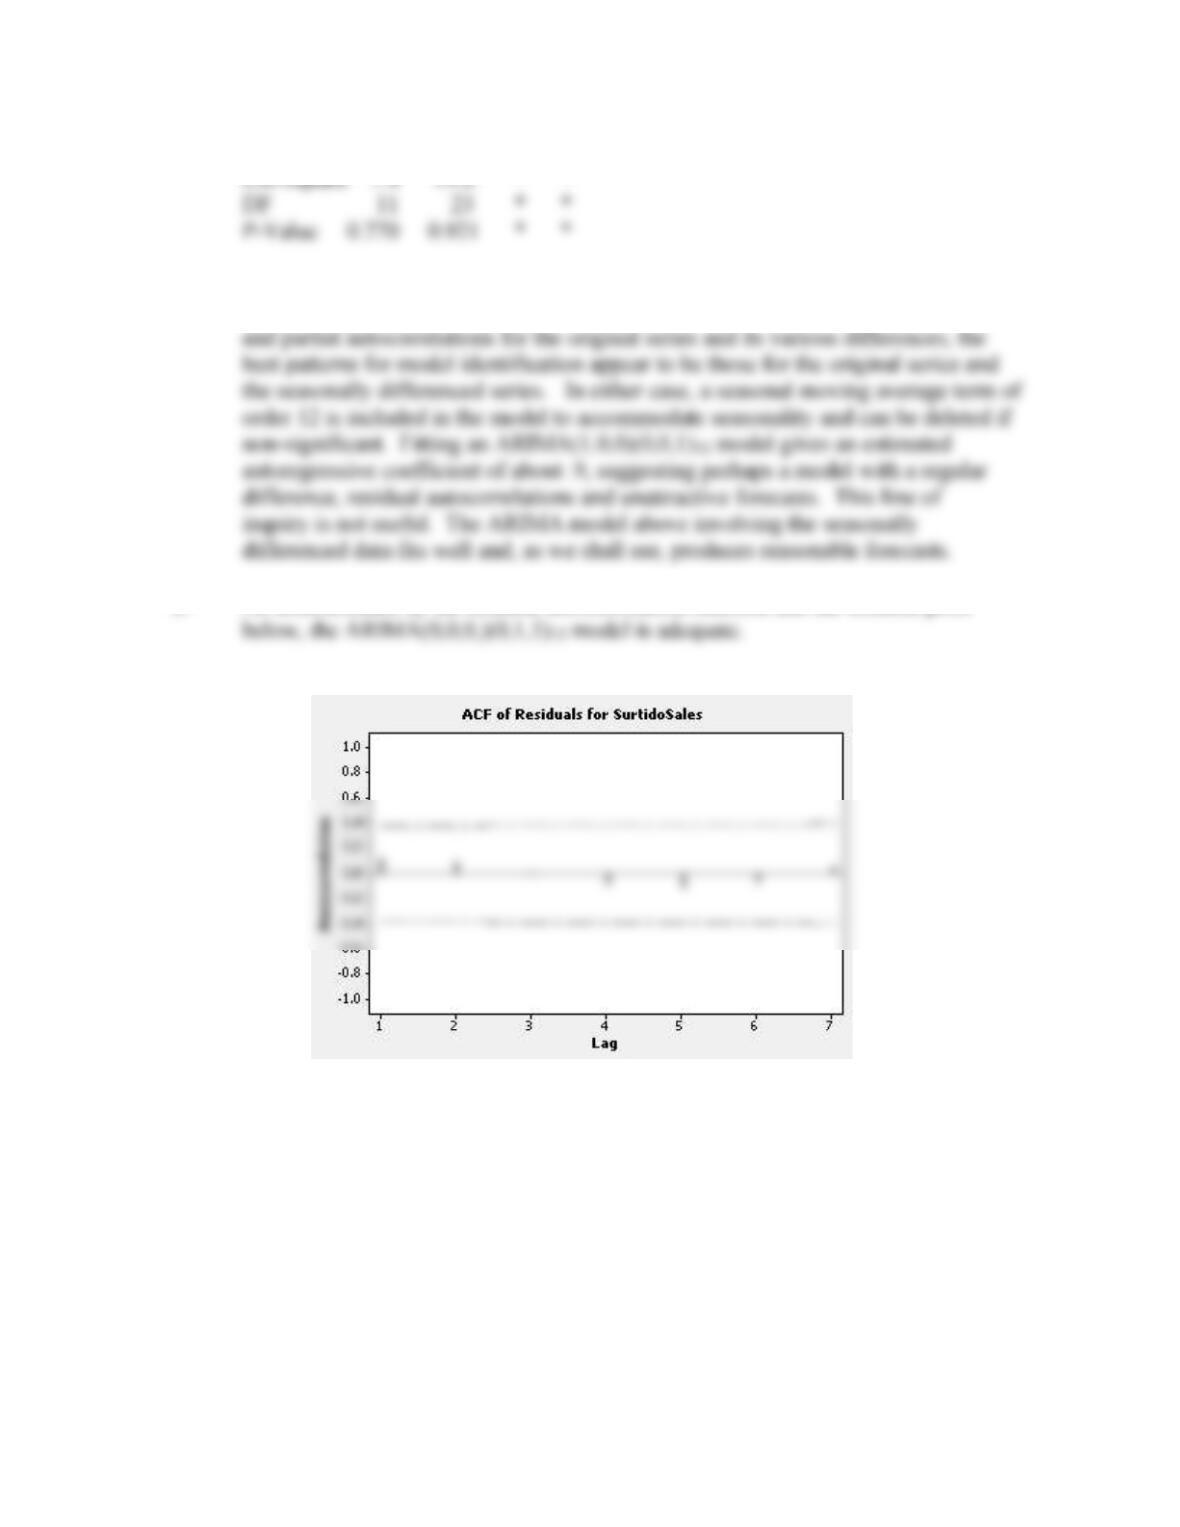
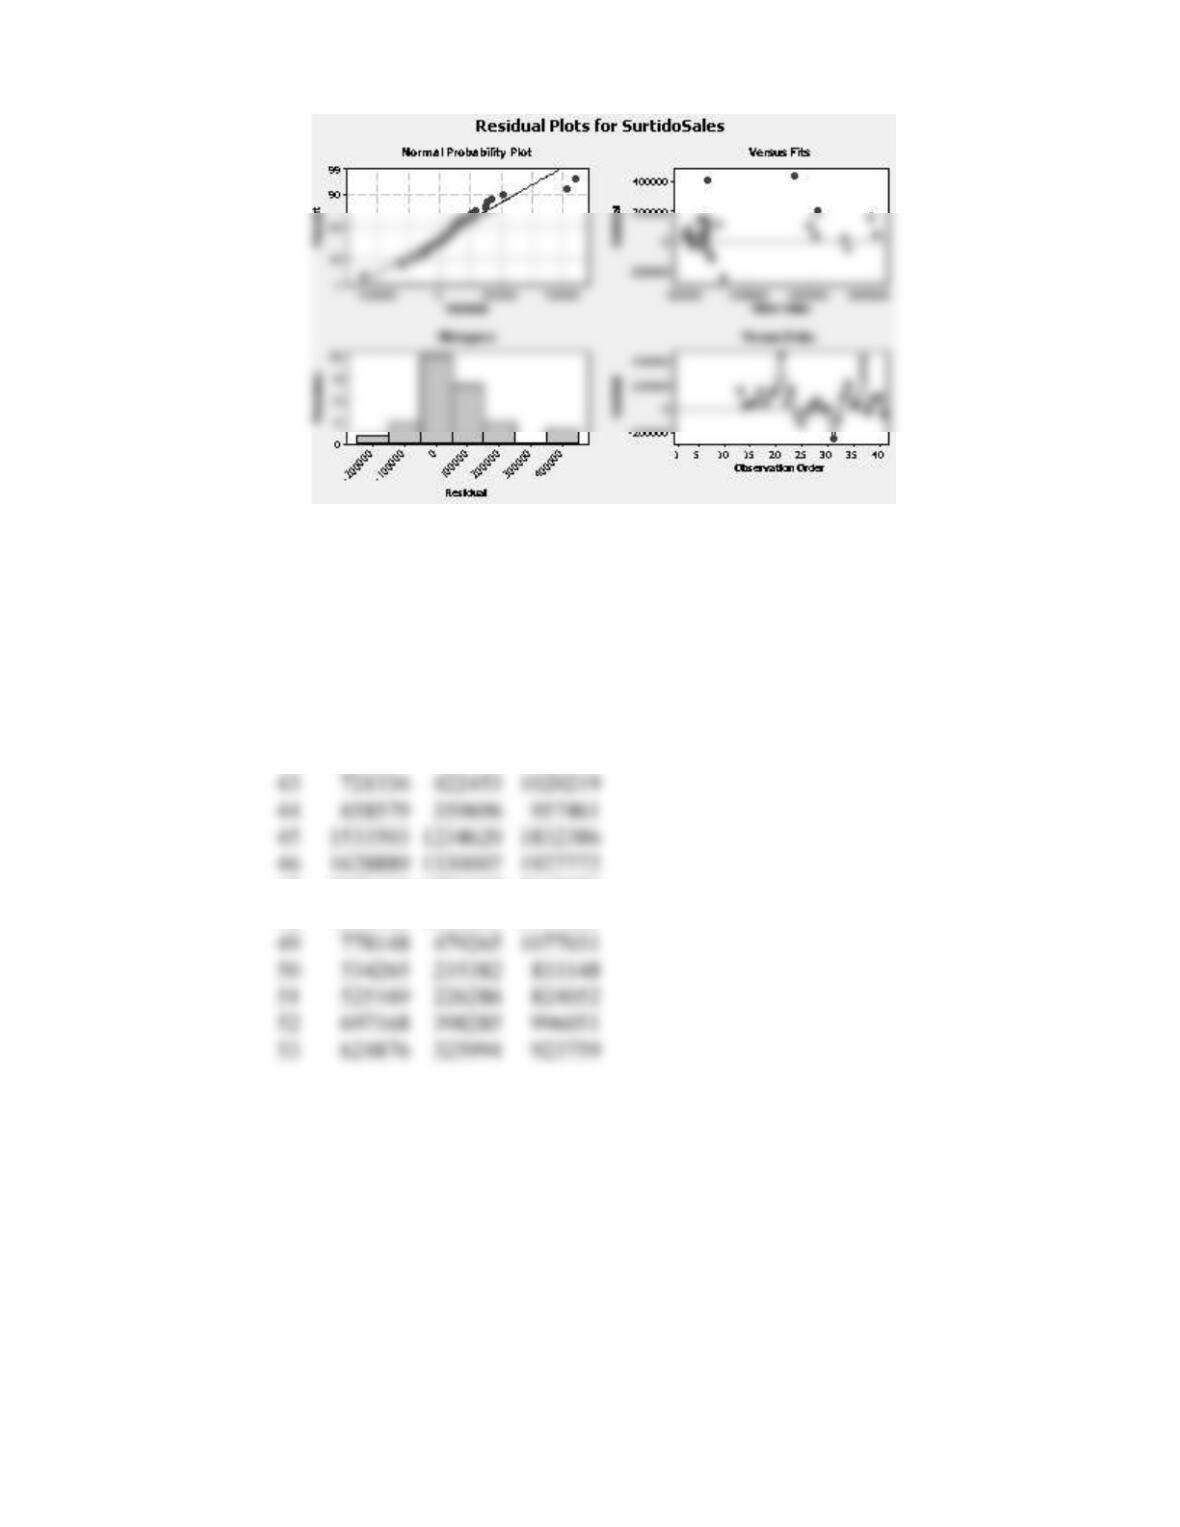
2. As demonstrated by the residual autocorrelation function and the residual plots
217
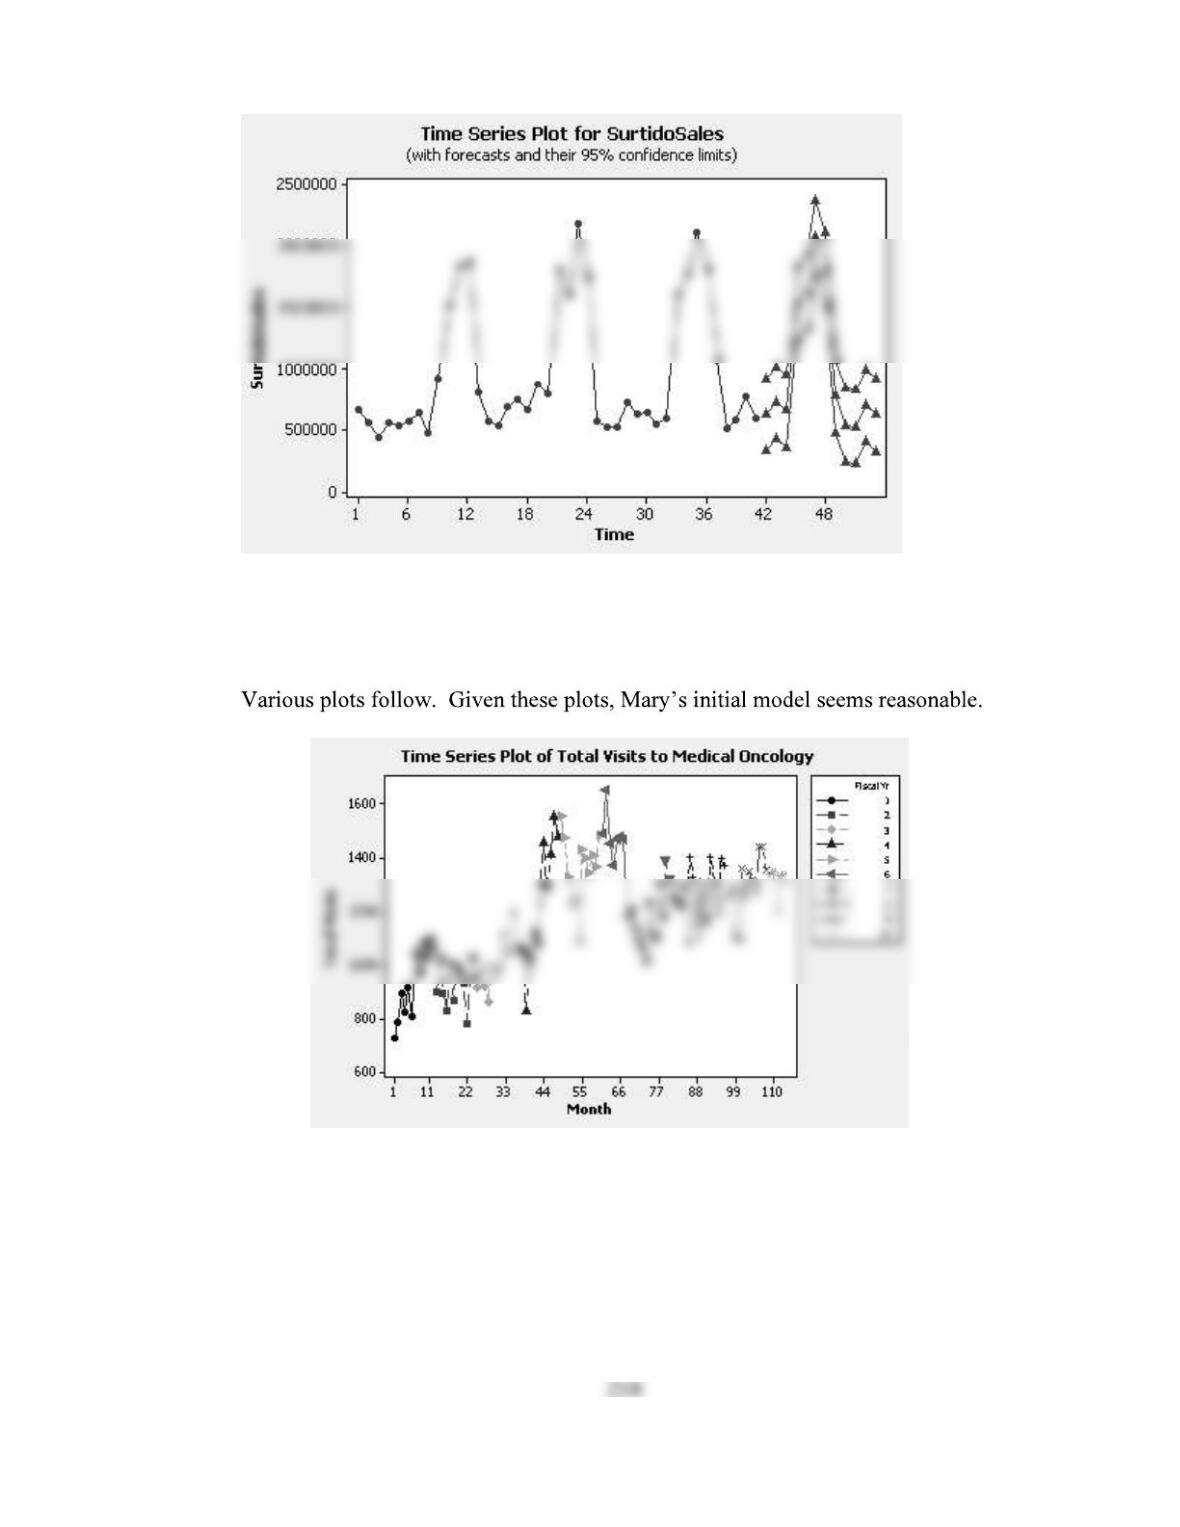
3. The forecasts for the next 12 months follow. Judging from the time series plot,
they seem very reasonable.
Forecasts from period 41
95% Limits
Period Forecast Lower Upper
42 627865 328983 926748
47 2070440 1771557 2369323
48 1805503 1506620 2104385
CASE 9-10: SOUTHWEST MEDICAL CENTER
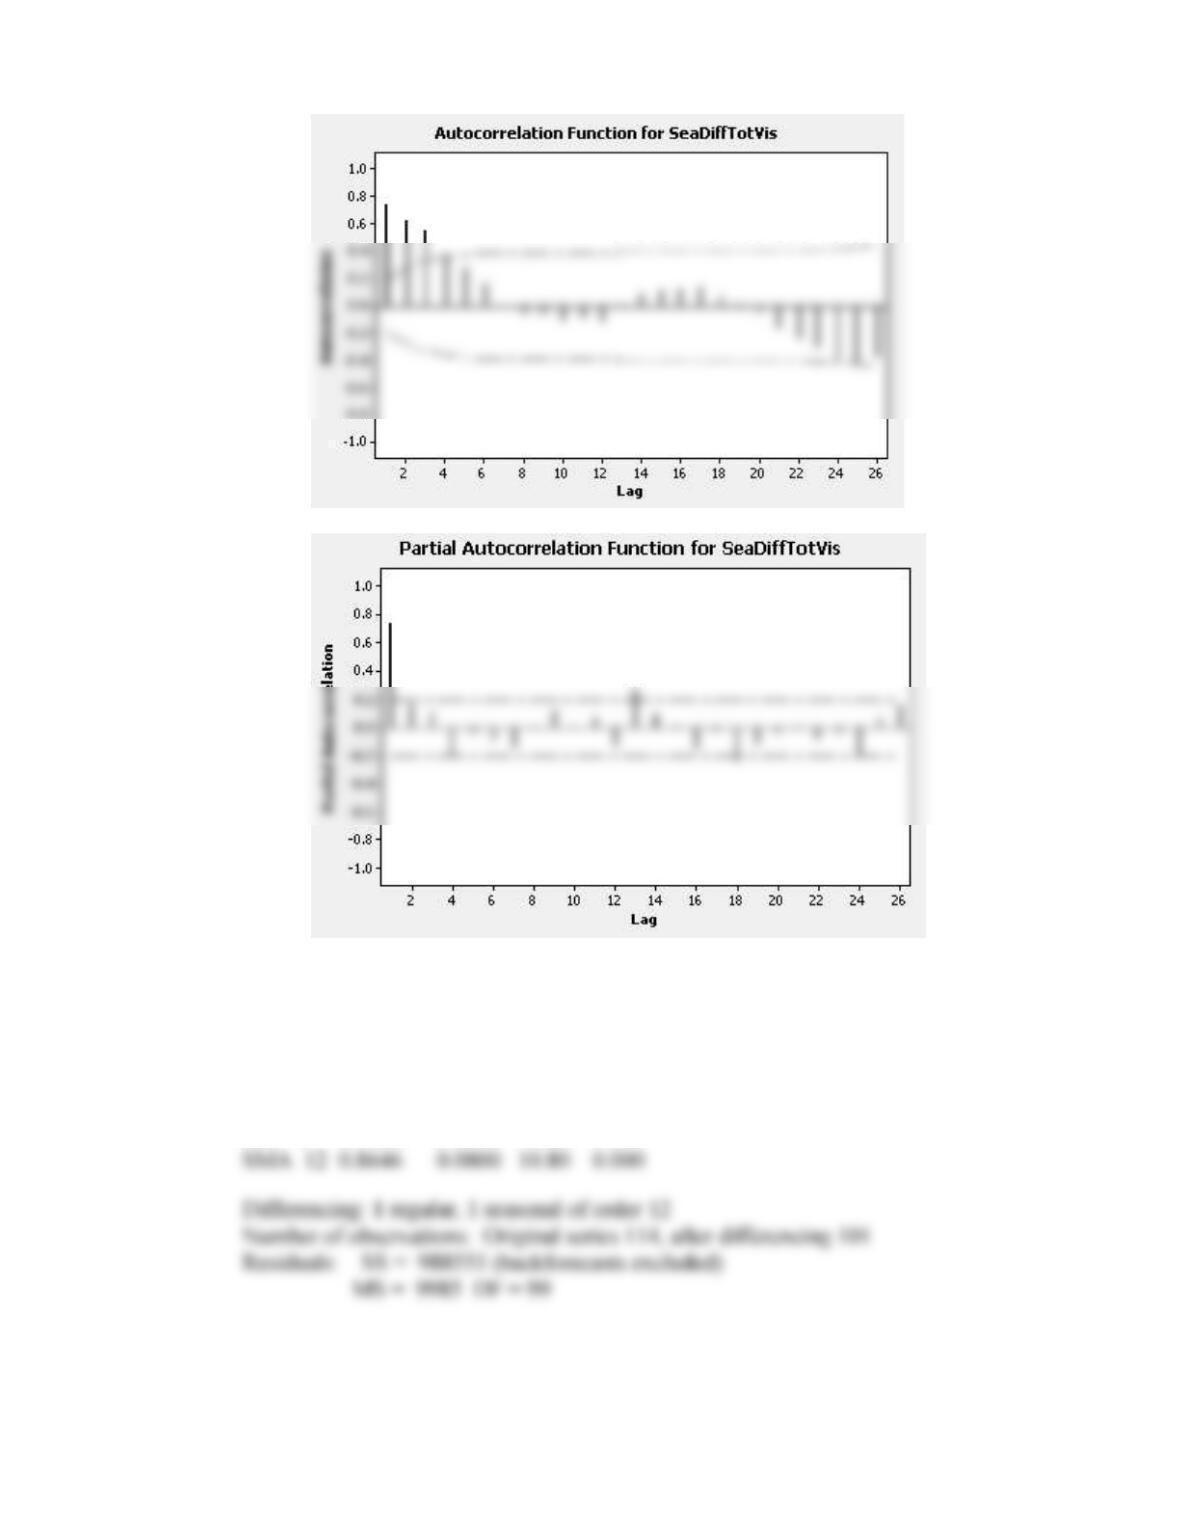
1.
220
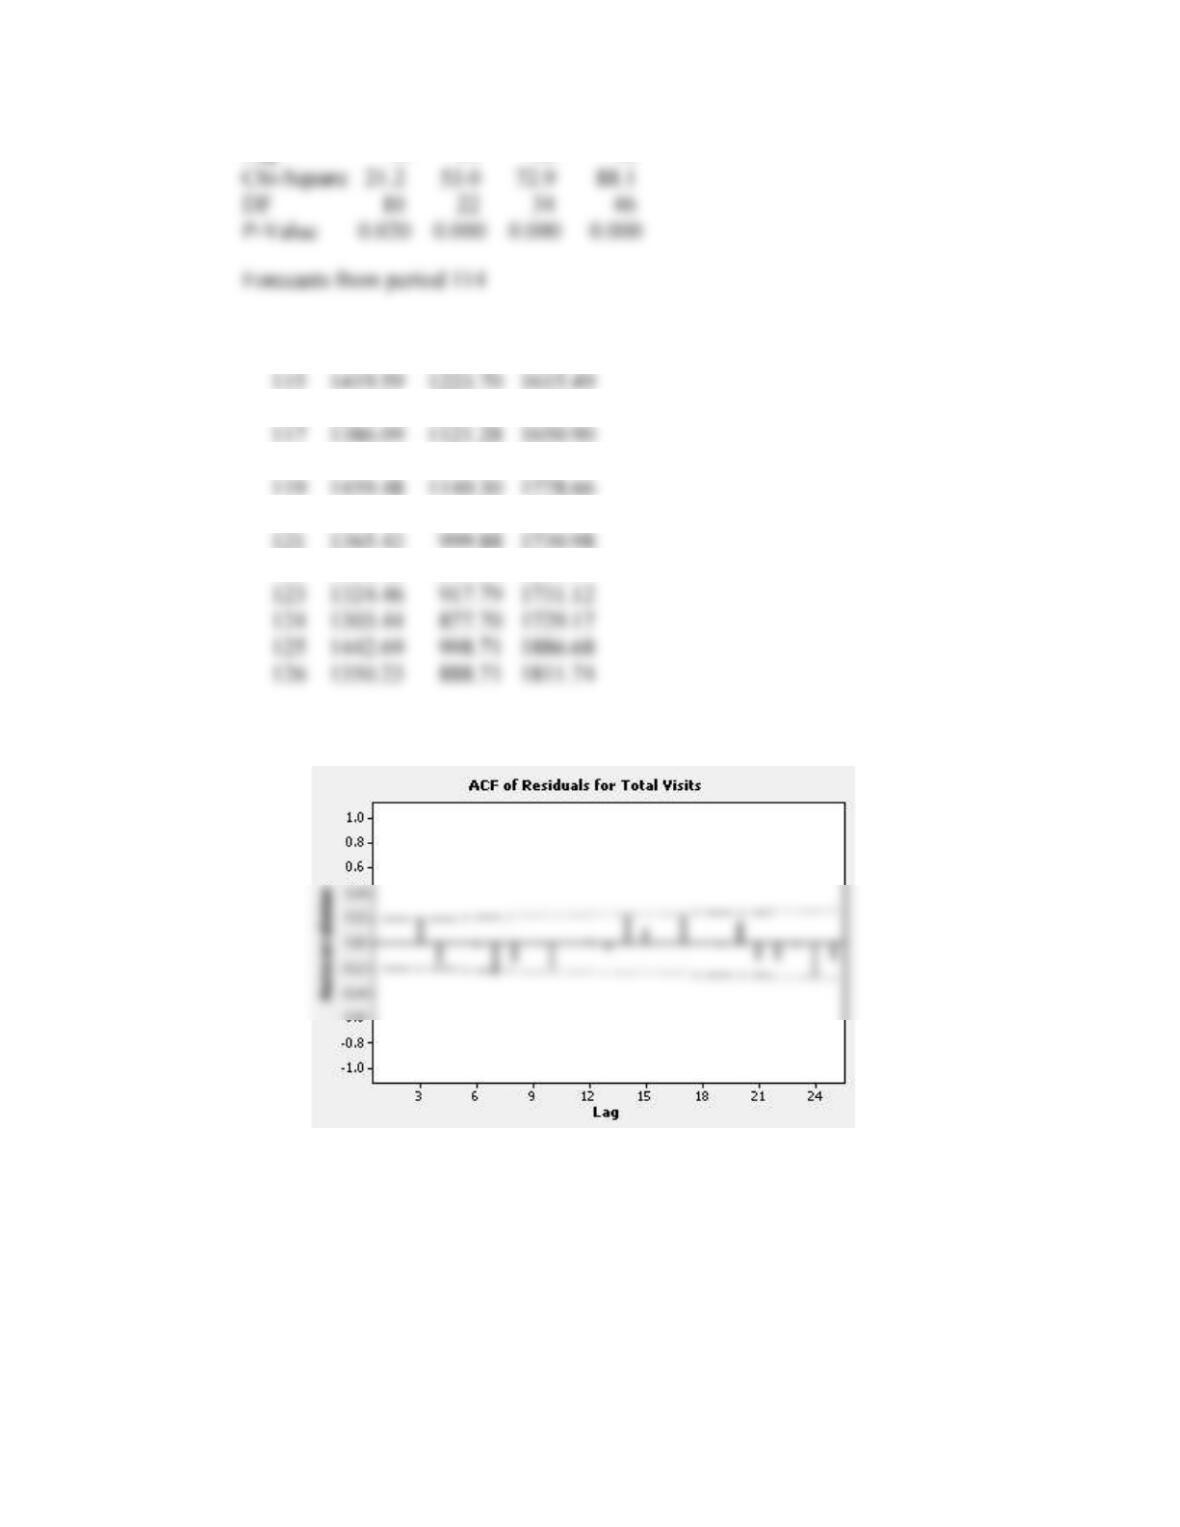
2. Results from fitting an ARIMA(0,1,1)(0,1,1)12 model follow along with a residual
analysis and forecasts for the next 12 months.
Final Estimates of Parameters
Type Coef SE Coef T P
MA 1 0.3568 0.0931 3.83 0.000
Modified Box-Pierce (Ljung-Box) Chi-Square statistic
221
Lag 12 24 36 48
95% Limits
Period Forecast Lower Upper
116 1438.07 1205.16 1670.99
118 1376.53 1083.27 1669.79
120 1431.27 1088.12 1774.41
122 1456.48 1069.83 1843.14
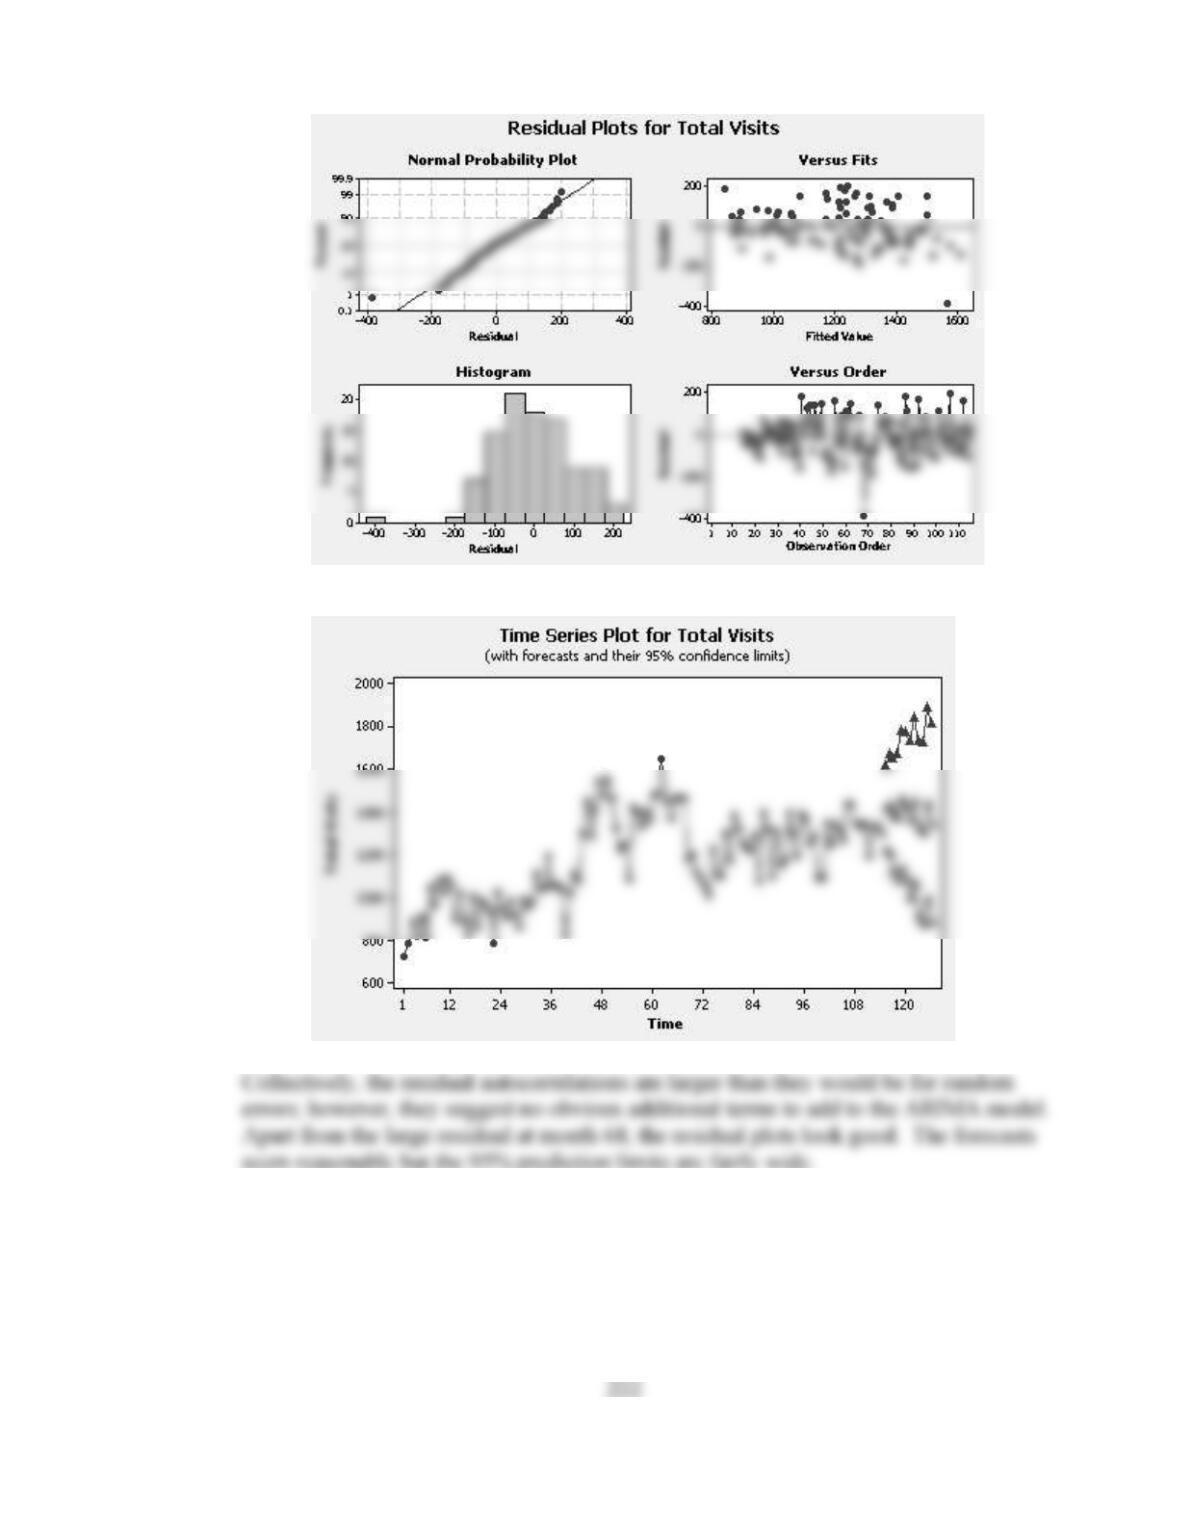
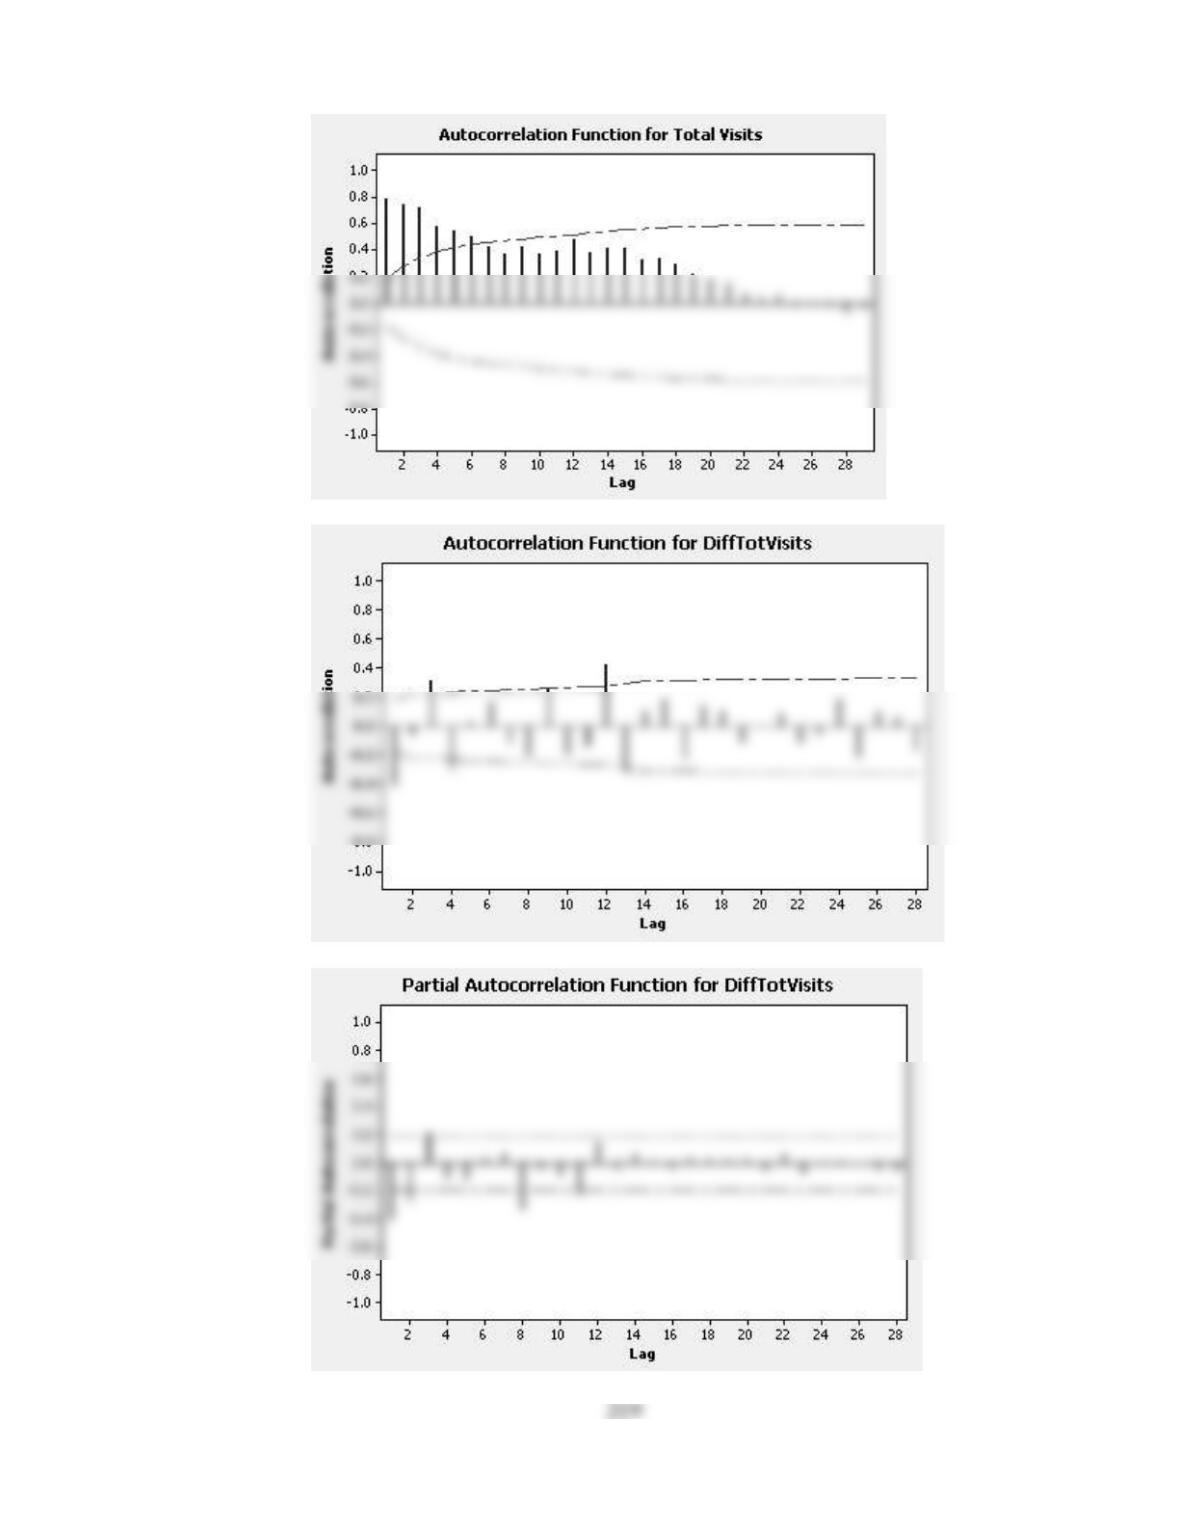
3. Total visits for fiscal years 4, 5 and 6 seem somewhat removed from the rest of the data.
Total visit for these fiscal years are, as a group, somewhat larger than the remaining
observations. Did something unusual happen during these years? Was total visits
defined differently? This particular feature makes modeling difficult.