In an effort to demonstrate how conservative they had been, the CEO indicated that potential revenue synergies
had not even been included in their financial models. However, he was convinced that there were significant upside
revenue opportunities. He argued that by testing alternative scenarios reflecting a myriad of outcomes that he was
confident that the likelihood of earning competitive financial returns on the investment was high.
When Hewlett-Packard bought E.D.S., it said E.D.S. would give it a way to compete with IBM in the services’
business, and the firm noted that the combined revenue of HP and EDS would be $38 billion. Four years later, HP
had services revenue of just $35.9 billion, mostly in low-margin outsourcing deals. Reflecting the extent of their
Mars Buys Wrigley in One Sweet Deal
Under considerable profit pressure from escalating commodity prices and eroding market share, Wrigley
Corporation, a U.S.-based leader in gum and confectionery products, faced increasing competition from Cadbury
Schweppes in the U.S. gum market. Wrigley had been losing market share to Cadbury since 2006. Mars
Corporation, a privately owned candy company with annual global sales of $22 billion, sensed an opportunity to
achieve sales, marketing, and distribution synergies by acquiring Wrigley Corporation.
On April 28, 2008, Mars announced that it had reached an agreement to merge with Wrigley Corporation for $23
billion in cash. Under the terms of the agreement, which were unanimously approved by the boards of the two firms,
shareholders of Wrigley would receive $80 in cash for each share of common stock outstanding, a 28 percent
premium to Wrigley’s closing share price of $62.45 on the announcement date. The merged firms in 2008 would
have a 14.4 percent share of the global confectionary market, annual revenue of $27 billion, and 64,000 employees
worldwide. The merger of the two family-controlled firms represents a strategic blow to competitor Cadbury
Schweppes’s efforts to continue as the market leader in the global confectionary market with its gum and chocolate
business. Prior to the announcement, Cadbury had a 10 percent worldwide market share.
As of the September 28, 2008 closing date, Wrigley became a separate stand-alone subsidiary of Mars, with $5.4
billion in sales. The deal is expected to help Wrigley augment its sales, marketing, and distribution capabilities. To
provide more focus to Mars’s brands in an effort to stimulate growth, Mars would in time transfer its global
nonchocolate confectionery sugar brands to Wrigley. Bill Wrigley Jr., who controls 37 percent of the firm’s
outstanding shares, remained the executive chairman of Wrigley. The Wrigley management team also remained in
place after closing.
Discussion Questions:
1. Why was market share in the confectionery business an important factor in Mars’ decision to acquire
Wrigley?
Answer: Firm’s having substantial market relative to their next largest competitor are likely to have lower
cost structures due to economies of scale and purchasing, as well as lower sales, general and administrative
2. It what way did the acquisition of Wrigley’s represent a strategic blow to Cadbury?
Answer: Not only did this acquisition topple Cadbury from its number one position in the confectionery
3. How might the additional product and geographic diversity achieved by combining Mars and Wrigley
benefit the combined firms?
4. Speculate as to the potential sources of synergy associated with the deal. Based on this speculation what
additional information would you want to know in order to determine the potential value of this synergy?
Answer: The product offerings of the two firms show little duplication. Therefore, there is significant
potential for cross-selling each firm’s products into the other’s customers. This would require training the
sales forces in each firm’s product offering. The cost of this training would need to be estimated and
deducted from cash flows generated by cross-selling.
5. Given the terms of the agreement, Wrigley shareholders would own what percent of the combined
companies? Explain your answer
Answer: Wrigley shareholders would not own any portion of the combined firms, as the purchase was an
Tribune Company Acquires the Times Mirror Corporation
in a Tale of Corporate Intrigue
Background: Oh, What Tangled Webs We Weave. .
.
CEO Mark Willes had reason to be optimistic about the future. Operating profits had grown at a double-digit rate,
and earnings per share had grown at a 55% annual rate between 1995 to 1999. Many shareholders appeared to be
satisfied. However, some were not. Although pleased with the improvement in profitability, they were concerned
about the long-term growth prospects of the firm. Reflecting this disenchantment, Times Mirror’s largest
shareholder, the Chandler family, was contemplating the sale of the company and along with it the crown jewel Los
Angeles Times. It had been assumed for years that the Chandler family trusts made a sale of Times Mirror out of the
question. The Chandler’s super voting stock (i.e., stock with multiple voting rights) allowed them to exert a
disproportionate influence on corporate decisions. The Chandler Trusts controlled more than two-thirds of voting
shares, although the family owned only about 28% of the total shares of the outstanding stock.
Transaction Terms: Tribune Shareholders Get Choice of Cash or Stock
The Tribune agreed to buy 48% of the outstanding Times Mirror stock, about 28 million shares, through a tender
offer. After completion of the tender offer, each remaining Times Mirror share would be exchanged for 2.5 shares of
Tribune stock. Under the terms of the transaction, Times Mirror shareholders could elect to receive $95 in cash or
Table 1. Times Mirror Transaction Terms
As of June 12, 2000 Transaction Value
Times Mirror Shares Outstanding @ 3/13/00 59,700,000
No. of Times Mirror Shares Exchanged for 2.3
Shares of Tribune Stock 27,238,253 $2,587,634,0351
No. of Times Mirror Shares Exchanged for Cash 10,648,318 $1,011,536,9682
Times Mirror Shares Outstanding after Tender Offer 21,813,429
No. of New Tribune Shares Issued for Remaining
Times Mirror Shares 54,533,5735 $2,072,275,7743
137,537,013.
Newspaper Advertising Revenues Continue to Shrink
Most U.S. newspapers are mired in the mature or declining phase of their product life cycle. For the past half-
century, newspapers have watched their portion of the advertising market shrink because of increased competition
from radio and television. By the early 1990s, all major media began taking a significant hit in their advertising
Times Mirror: A Largely Traditional Business Model
As essentially a traditional newspaper, Times Mirror publishes five metropolitan and two suburban daily
newspapers, a variety of magazines, and professional information such as flight maps for commercial airline pilots.
Tribune Company Profile: The Face of New Media?
Unlike the Times Mirror, Tribune has built its strategy around four business groups: broadcasting, publishing,
education, and interactive. The Tribune is also an equity investor in America Online and other leading internet
companies, underscoring the company’s commitment to new-media technologies. Applying leading edge new-media
Anticipated Synergy
Cost Savings: Opportunities Abound
Cost savings are expected because of the closing of selected foreign and domestic news bureaus, a reduction in the
Equity Value of Offer $5,671,446,777
Premium 102%
cost of newsprint through greater volume purchases, the closing of the Times Mirror corporate headquarters, and
elimination of corporate staff. Such savings are expected to reach $200 million per year (Table 2).
Revenue: Great Potential . . . But Is It Achievable?
The combined companies will have a major presence in 18 of the nation’s top 30 U.S. advertising markets, including
New York, Los Angeles, and Chicago. The combined companies provide unprecedented opportunities for
advertisers to reach major market consumers in any media form—broadcast, newspapers, or interactive. In addition,
Integration Challenges: Cultural Warfare?
Based on the current, traditional culture found at the Los Angeles Times and other Times Mirror properties,
integration following the merger was likely to be slow and painful. Concerns among journalists about spreading
their talents thin across three or four media—print, television, online, and radio—in the course of a day’s work
Financial Analysis
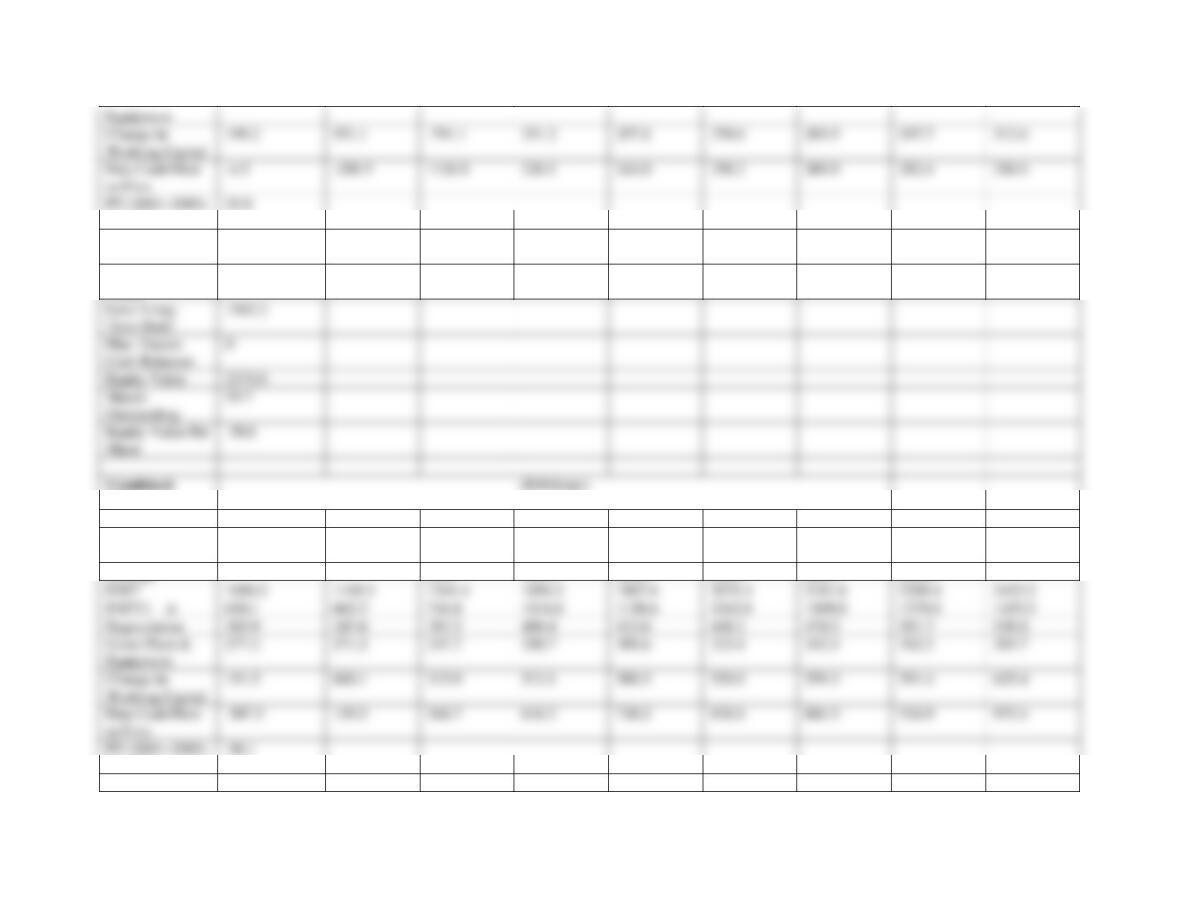
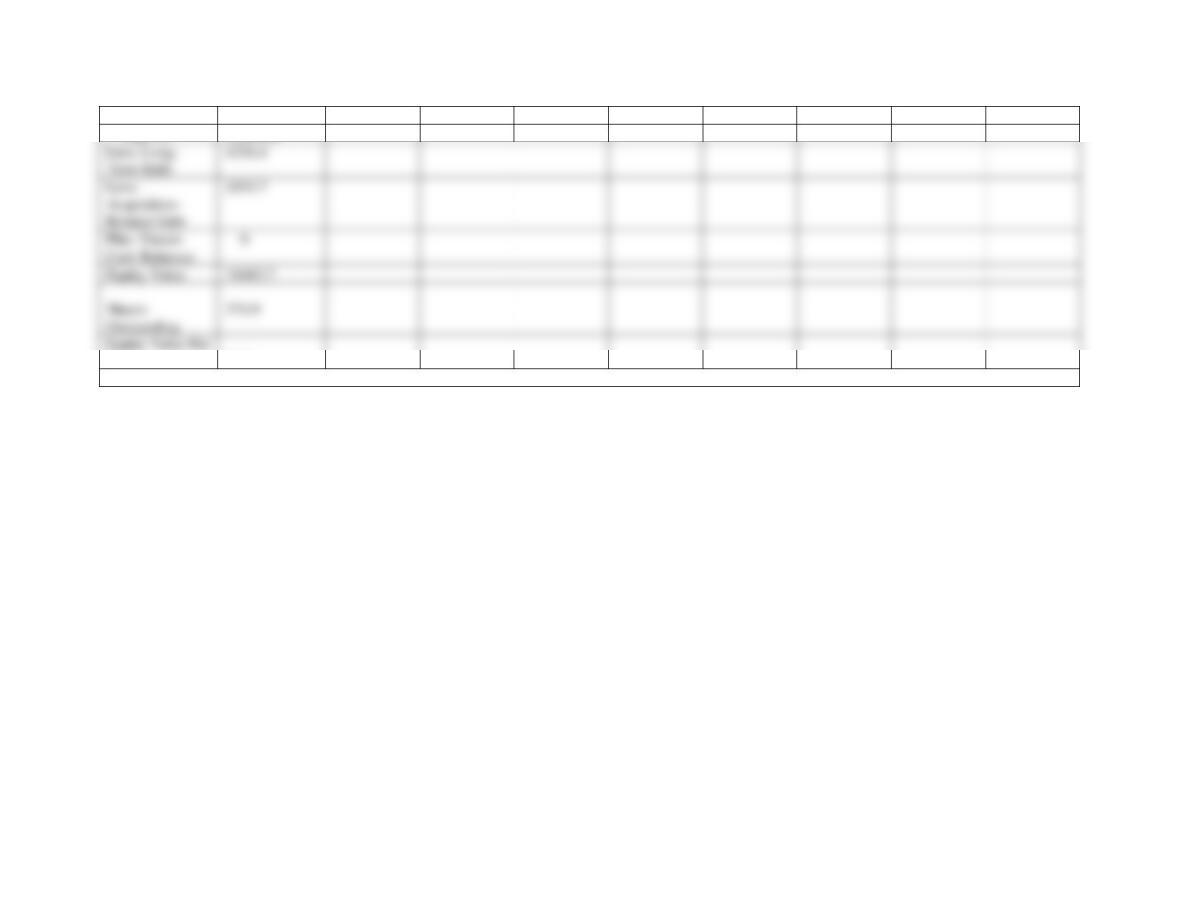
The present values of the Tribune, Times Mirror, and the combined firms are $8.5 billion, $2.4 billion, and $16.5
billion, respectively; the estimated present value of synergy is $5.6 billion (Table 3). This assumes that pretax cost
Table 2. Annual Merger-Related Cost Savings
Source of Value Annual Savings
Bureau Closings1 $73,000,000
Newsprint Savings2 $93,000,000
Other Office Closings (e.g., Corporate Office in Los Angeles)3 $34,000,000
Total Annual Savings $200,000,000
1Assumes Tribune will close overlapping bureaus in United States (9) and most of the Times Mirror’s foreign
bureaus (21 abroad).
2As a result of bulk purchasing and more favorable terms with different suppliers, 15% of the newsprint expense of
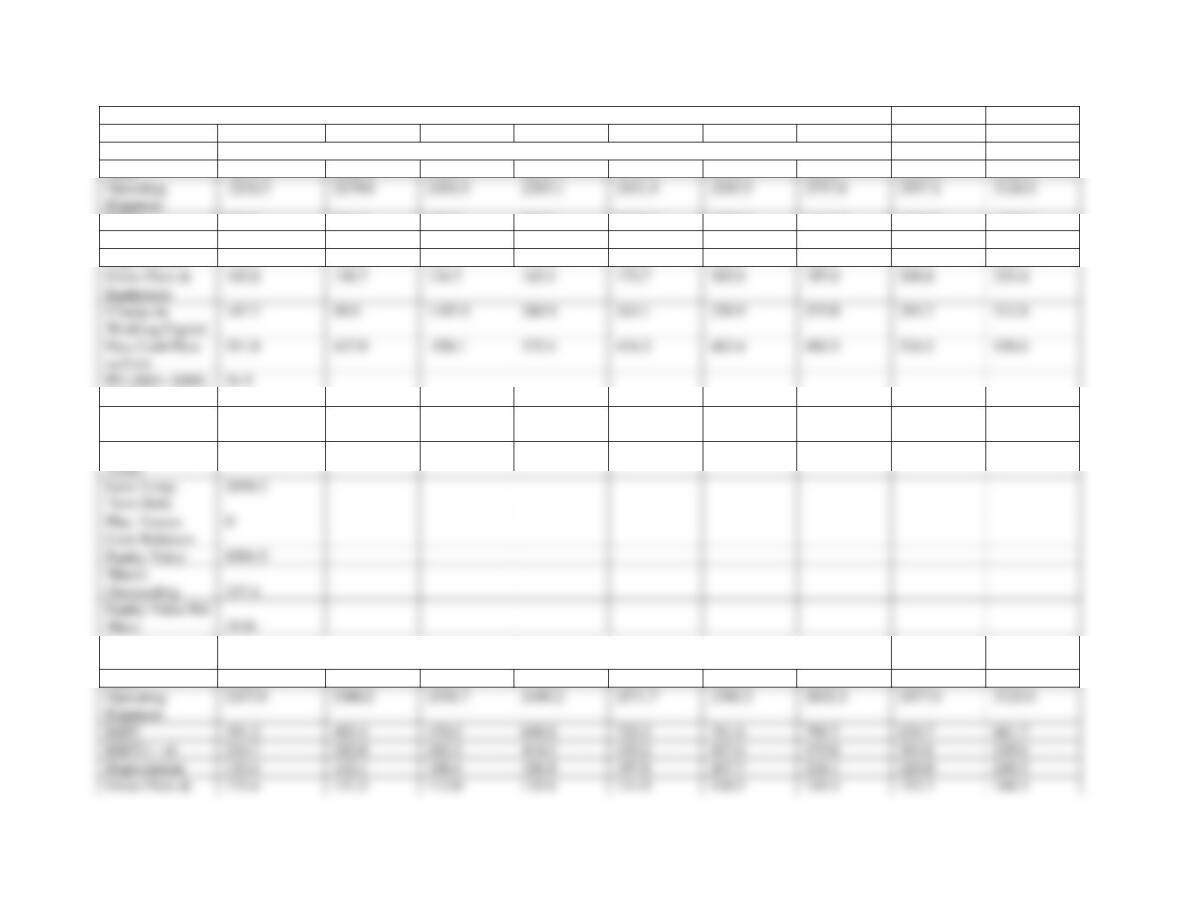
Table 3. Merger Evaluation
1997
1998
1999
2000
2001
2002
2003
2004
2005
Tribune
($ Millions)
Sales
2891.5
2980.9
3221.9
3261.5
3473.5
3699.3
3939.7
4195.8
4468.5
EBIT
559.0
701.9
770.9
978.5
1042.0
1109.8
1181.9
1258.7
1340.6
EBIT(1 – t)
395.4
421.1
462.5
587.1
625.2
665.9
709.2
755.2
804.3
Depreciation
172.5
195.5
221.1
212.0
225.8
240.5
256.1
272.7
290.5
Gross Plant &
Equipment
103.8
139.7
134.7
163.1
173.7
185.0
197.0
209.8
223.4
Change in
Working Capital
147.7
49.0
1107.0
260.9
243.1
258.9
275.8
293.7
312.8
Free Cash Flow
to Firm
511.8
427.9
-558.1
375.1
434.2
462.4
492.5
558.6
PV (2001–2005)
51.5
@8.5
PV (Terminal
Value) @8.5
11144.2
Less: Long-
Term Debt
2694.2
Plus: Excess
Cash Balances
0
Equity Value
8501.5
Shares
Outstanding
237.4
Equity Value Per
Share
35.81
Total Present
11195.7
Times Mirror
($Millions)
Sales
2728.2
2783.9
3029.2
3140.0
3297.0
3461.9
3634.9
3816.7
4007.5
Operating
Expenses
2337.0
2380.5
2558.7
2449.2
2571.7
2700.2
2835.3
2977.0
3125.9
EBIT
391.2
403.4
470.5
690.8
725.3
761.6
799.7
839.7
881.7
EBIT(1 – t)
234.7
242.0
282.3
414.5
435.2
457.0
479.8
503.8
529.0
Depreciation
133.4
152.1
166.4
188.4
197.8
207.7
218.1
229.0
240.5
Operating
Expenses
2232.5
2279.0
2451.0
2283.1
2431.4
2589.5
2757.8
2937.1
3128.0
@ 9.5%
PV (Terminal
Value) @ 9.5%
3937.2
Total Present
Value
3963.0
Less: Long-
1562.2
Plus: Excess
Cash Balances
0
Equity Value
2375.0
Shares
Outstanding
59.7
Equity Value Per
Share
39.8
Firms
Sales
5619.7
5764.8
6251.1
6401.5
6770.5
7161.1
7574.7
8012.5
8476.1
Operating
Expenses
4569.5
4659.5
5009.7
4732.3
5003.1
5289.7
5593.1
5914.1
6253.8
Synergy
25.0
100.0
200.0
200.0
200.0
200.0
EBIT
1050.2
1105.3
1241.4
1694.3
1867.4
2071.4
2181.6
2298.4
2422.2
EBIT(1 – t)
630.1
663.2
744.8
1016.6
1120.4
1242.8
1309.0
1379.0
1453.3
Depreciation
305.9
347.6
387.5
400.4
423.6
448.2
474.2
501.7
530.9
Gross Plant &
Equipment
277.2
271.2
247.7
288.7
305.6
323.4
342.4
362.5
383.7
Change in
Working Capital
151.5
600.1
315.9
512.1
500.3
529.0
559.3
591.4
625.4
Free Cash Flow
to Firm
507.3
139.5
568.7
616.2
738.2
838.6
881.5
926.9
975.1
@ 9.5%
PV (Terminal
22805.6
Equipment
Free Cash Flow
to Firm
-4.5
-288.5
1126.8
226.1
244.0
256.2
269.0
282.4
296.6
PV (2001–2005)
25.8
Value) @ 9.5%
Total PV
22893.8
Share
43.9
1Book values for long-term debt may be used if the coupon rate on the debt approximates competitive market rates.
Equity Value
16443.7
Outstanding
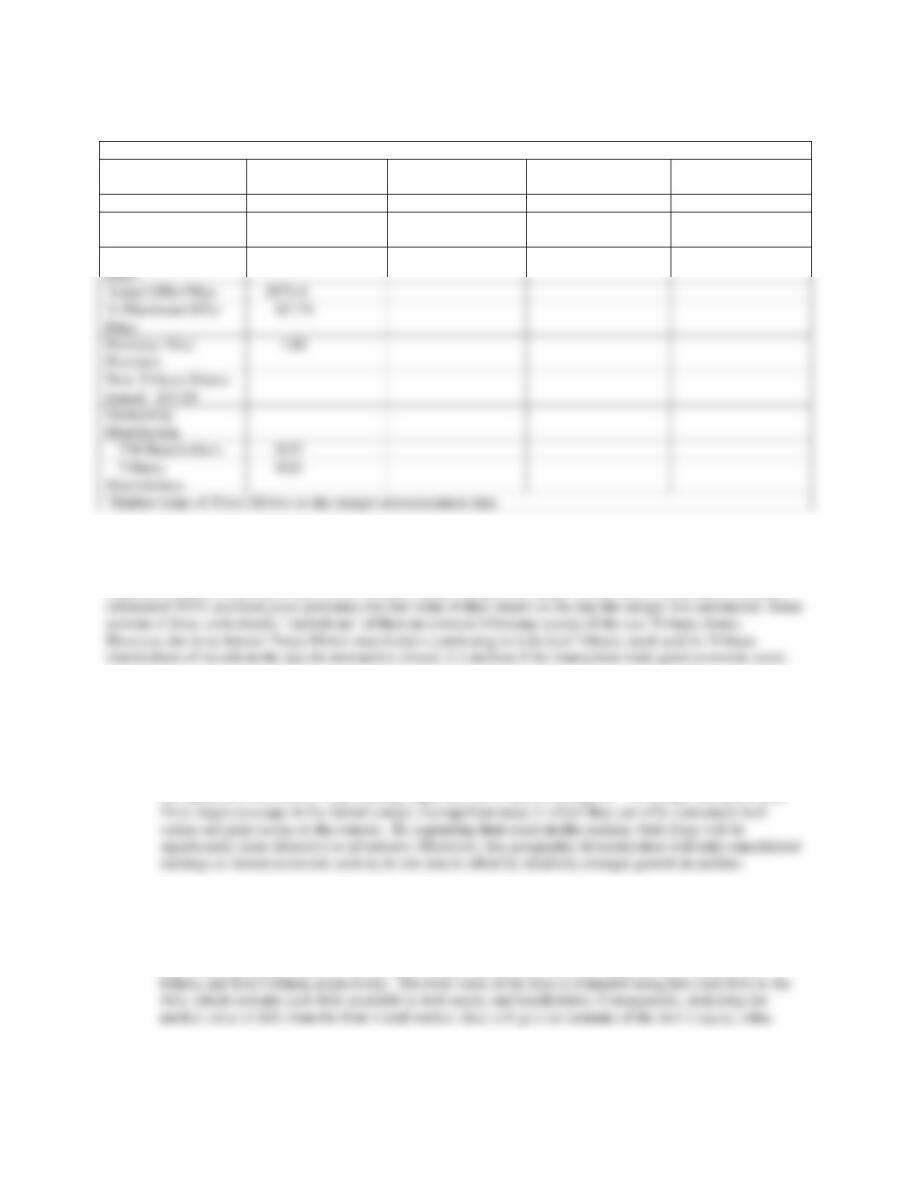
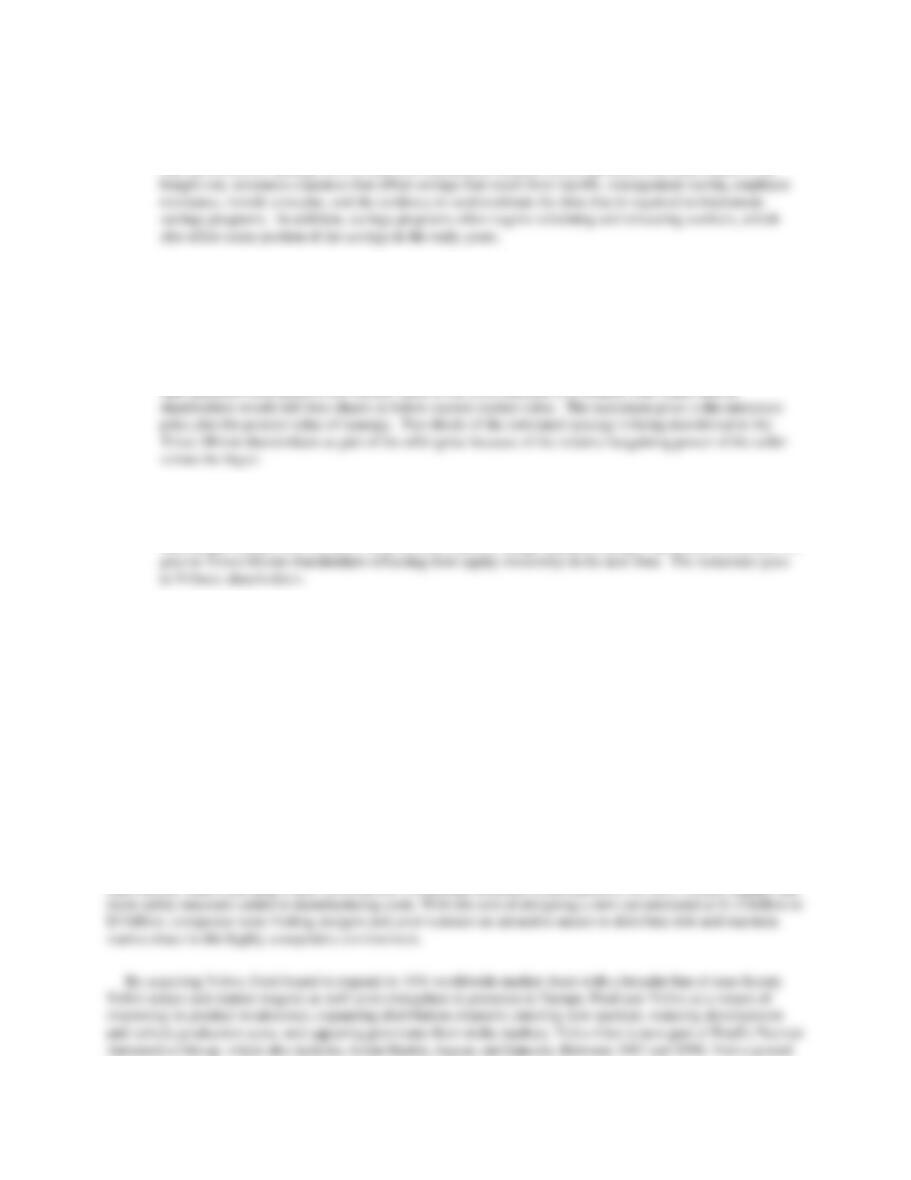
Table 4. Offer Price Determination
Tribune
Times Mirror
Combined Incl.
Synergy
Value of Synergy
Equity Valuations
8501.5
2375.0
16443.7
5567.3
Minimum Offer
Price1
2805.9
Maximum Offer
8373.2
Epilogue
Only time will tell if actual returns to shareholders in the combined Tribune and Times Mirror company exceed the
expected financial returns provided in the valuation models in this case study. Times Mirror shareholders earned a
Discussion Questions:
1. In your judgment, did it make good strategic sense to combine the Tribune and Times Mirror?
corporations? Why? / Why not?
Yes, the combination of the two firms offers substantial cost savings in closing overlapping news bureaus
and substantial economies in purchasing major cost items such as newsprint. The merger also gives both
2. Using the Merger Evaluation table given in the case, determine the estimated equity values of Tribune,
Times Mirror and the combined firms. Why is long-term debt deducted from the total present value
estimates in order to obtain equity value?
The estimated equity values for the Tribune, Times Mirror, and combined firms are $8.5 billion, $2.4
Actual Offer Price
5671.4
% Maximum Offer
Price
67.7%
Purchase Price
1.02
New Tribune Shares
Issued 137.50
Ownership
Distribution
TM Shareholders
0.37
Tribune
0.63
3. Despite the merger having closed in mid-2000, the full effects of synergy are not expected until 2002.
Why? What factors could account for the delay?
The full effects of synergy are not realized immediately because of bureau leases that must expire or be
4. The estimated equity value for the Times Mirror Corporation on the day the merger was announced was
about $2.8 billion. Moreover, as shown in the offer price evaluation table, the equity value estimated using
discounted cash flow analysis is given has $2.4 billion. Why is the minimum offer price shown as $2.8
billion rather than the lower $2.4 billion figure? How is the maximum offer price determined in the Offer
Price Evaluation Table? How much of the estimated synergy value generated by combining the two
businesses is being transferred to the Times Mirror shareholders? Why?
The minimum offer price is the market value of the firm, because it is unlikely that Times Mirror
5. Does the Times Mirror-Tribune Corporation merger create value? If so, how much? What percentage of
this value goes to Times Mirror shareholders and what percentage to Tribune shareholders? Why?
The merger creates $4.6 billion in value between the pre-merger and post-merger valuations, of which 37%
Ford Acquires Volvo’s Passenger Car Operations
This case illustrates how the dynamically changing worldwide automotive market is spurring a move toward
consolidation among automotive manufacturers. The Volvo financials used in the valuation are for illustration
only— they include revenue and costs for all of the firm’s product lines. For purposes of exposition, we shall
assume that Ford’s acquisition strategy with respect to Volvo was to acquire all of Volvo’s operations and later to
divest all but the passenger car and possibly the truck operations. Note that synergy in this business case is
determined by valuing projected cash flows generated by combining the Ford and Volvo businesses rather than by
subtracting the standalone values for the Ford and Volvo passenger car operations from their combined value
including the effects of synergy. This was done because of the difficulty in obtaining sufficient data on the Ford
passenger car operations.
Background
By the late 1990s, excess global automotive production capacity totaled 20 million vehicles, and three-fourths of the
auto manufacturers worldwide were losing money. Consumers continued to demand more technological
innovations, while expecting to pay lower prices. Continuing mandates from regulators for new, cleaner engines and
operating profits amounting to 3.7% of sales. Excluding the passenger car group, operating margins would have
been 5.3%. To stay competitive, Volvo would have to introduce a variety of new passenger cars over the next
decade. Volvo viewed the capital expenditures required to develop new cars as overwhelming for a company its
size.
Historical and Projected Data
The initial review of Volvo’s historical data suggests that cash flow is highly volatile. However, by removing
nonrecurring events, it is apparent that Volvo’s cash flow is steadily trending downward from its high in 1997. Table
9-10 displays a common-sized, normalized income statement, balance sheet, and cash-flow statement for Volvo,
including both the historical period from 1993 through 1999 and a forecast period from 2000 through 2004.
Although Volvo has managed to stabilize its cost of goods sold as a percentage of net sales, operating expenses as a
percentage of net revenue have escalated in recent years. Operating margins have been declining since 1996. To
regain market share in the passenger car market, Volvo would have to increase substantially its capital outlays. The

<A>Table 9-10. Volvo Common-Size Normalized Income Statement, Balance Sheet, and Cash-Flow Statement (Percentage of Net Sales)<A>
1993 1994 1995 1996 1997 1998 1999 2000 2001 2002 2003 2004
Income Statement
Net Sales 1.000 1.000 1.000 1.000 1.000 1.000 1.000 1.000 1.000 1.000 1.000 1.000
Cost of Goods Sold .772 .738 .749 .777 .757 .757 .757 .757 .757 .757 .757 .757
Operation Expense .167 .101 .120 .077 .119 .133 .132 .131 .129 .128 .127 .126
Depreciation .034 .033 .033 .034 .029 .038 .038 .039 .040 .040 .041 .042
EBIT .027 .128 .098 .112 .088 .073 .073 .074 .074 .074 .075 .075
Interest on Debt .050 .023 .022 .021 .015 .023 .023 .022 .021 .021 .020 .020
Selected Valuation Cash-Flow Items
EBIT (1 – t) .022 .150 .126 .126 .105 .093 .094 .094 .095 .095 .096 .096
Capital Expenditures .031 .027 .033 .053 .054 .061 .069 .078 .088 .099 .112 .126
Working Capital .025 .077 .068 .049 .000 .017 .020 .020 .020 .020 .020 .020
Free Cash Flow .047 .079 .053 .059 .088 .087 .044 .036 .027 .017 .005 (.008)
Determining the Initial Offer Price
Volvo’s estimated value on a standalone basis is $15 billion. The present value of anticipated synergy is $1.1 billion, suggesting that
the purchase price for Volvo should lie within a range of $15 million to about $16 billion. Although potential synergies appear to be
substantial, savings due to synergies will be phased in gradually between 2000 and 2004. The absence of other current bidders for the
Determining the Appropriate Financing Structure
Ford had $23 billion in cash and marketable securities on hand at the end of 1998 (Naughton, 1999). This amount of cash is well in
excess of its normal cash operating requirements. The opportunity cost associated with this excess cash is equal to Ford’s cost of
capital, which is estimated to be 11.5%—about three times the prevailing interest on short-term marketable securities at that time. By
Epilogue
Seven months after the megamerger between Chrysler and Daimler-Benz in 1998, Ford Motor Company announced that it was
acquiring only Volvo’s passenger-car operations. Ford acquired Volvo’s passenger car operations on March 29, 1999, for $6.45
billion. At $16,000 per production unit, Ford’s offer price was considered generous when compared with the $13,400 per vehicle that
Discussion Questions and Answers:
1. What is the purpose of the common-size financial statements developed for Volvo (see Table 8-8 in the textbook)? What
insights does this table provide about the historical trend in Volvo’s historical performance? Based on past performance,
how realistic do you think the projections are for 2000-2004?
Answer: The common size financial statements for Volvo reveal the historical relationship between key operating variables
and sales. They revealed the deterioration in the firm’s long-term operating efficiency and the subsequent decline in
2. Ford anticipates substantial synergies from acquiring Volvo. What are these potential synergies? As a consultant hired to
value Volvo, what additional information would you need to estimate the value of potential synergy from each of these areas?
Answer: By acquiring Volvo, Ford hoped to expand its global market share with a broader product offering as well as to
strengthen its presence in Europe. Specifically, Ford saw Volvo as a means of improving its product weakness in luxury
29
3. How was the initial offer price determined according to this case study? Do you find the logic underlying the initial offer
price compelling? Explain your answer.
Answer: The initial offer price for Volvo was determined by adding about one-fourth of the projected net synergy generated
4. What was the composition of the purchase price? Why was this composition selected according to this case study?
Answer: The proposed purchase price was an all-cash offer. At the time, Ford’s cash balances were substantially in excess