E9-14 (continued)
E9-15 (AICPA adapted solution)
Ending inventory converted to base-year prices = $660,000 x 110
100 = $600,000
E9-16
1. Current year:
Income statement: Income is correct because the errors in Purchases and
Ending Inventory offset each other.
E9-16 (continued)
1. (continued)
2. Current year:
Income statement: Income is overstated because Purchases are understated
Succeeding year:
Income statement: No effect in the succeeding year if the purchase is not
3. Current year:
Income statement: Income is overstated because Cost of Goods Sold is
Succeeding year:
Income statement: Income is understated because Beginning Inventory is
9-23
E9-17 (AICPA adapted solution)
Net income before adjustments $20,000
Adjustments
9-24
SOLUTIONS TO PROBLEMS
P9-1
1.
Item
Cost
Replacement
NRV
NRV
Less Markup
Lower of
Cost or Market
1
5
$10.00
25.00
$ 9.10a
25.50
$ 9.20
25.30a
$ 7.20
20.30
$ 9.10
25.00
aDesignated as market
2. a. If lower of cost or market is applied to individual items
Item Units Valuation Total
b. If lower of cost or market is applied to whole inventory
Item Units Cost Market
1 500 $ 5,000 $ 4,550
2 400 3,200 3,120
3 300 4,500 4,050
3. Net Lower
Realizable of Cost
Case Cost Value or Market
9-25
P9-2
1. 2010
a. Income Summary 50,000
Inventory 50,000
To close beginning inventory.
2011
a. Income Summary 64,000
Inventory 64,000
To close beginning inventory.
2012
a. Income Summary 71,000
Inventory 71,000
To close beginning inventory.
9-26
P9-2 (continued)
2. 2010
Loss Due to Market Valuation 4,000
Allowance to Reduce Inventory to Market 4,000
3. 2010
a. Income Summary 50,000
2011
a. Income Summary 60,000
2012
a. Income Summary 70,000
Inventory 70,000
P9-2 (continued)
4. 2010
Cost of Goods Sold 4,000
P9-3
1. The decline in the value of inventory below cost is ignored in interim financial
P9-4
1. a.
2010
Income Summary 125,000
Inventory 125,000
To close beginning inventory.
P9-4 (continued)
1. a. (continued)
Inventory 135,000
Income Summary 135,000
b.
2010
Income Summary 125,000
Inventory 125,000
To close beginning inventory.
P9-4 (continued)
2. a. Income Statement
2010 2011
Beginning inventory $125,000 $130,000
Purchases 100,000 110,000
Balance Sheet
b. Income Statement
2010 2011
P9-5
Work in process, January 1, 2010 $ 25,000
Add: Production costs 70,000
Gross profit as a percent of net sales:
38%
$100,000
38,000$ =
P9-6
Beginning inventory $ 38,000
P9-7
1. Inventory, July 1, 2010 $ 53,600
Purchases (less $6,000 in transit) 362,000
Less: Purchases returns (11,200)
9-31
P9-7 (continued)
Cost of goods salvaged = $4,700 x (1 – 0.40)
2. When a company uses the periodic inventory method, it is estimating the
ending inventory and cost of goods sold in its interim financial reports (unless it
took a physical inventory). Therefore, you might be concerned about the
P9-8
LRT COMPANY
Computation of Value of Inventory Lost
February 17, 2010
Sales $ 50,000
P9-8 (continued)
P9-9 (AICPA adapted solution)
PADWAY CORPORATION
Computation of Value of Work-in-Process Inventory Lost
June 30, 2010
Sales $340,000
Less: Gross profit (25%) (85,000)
P9-10
1. Cost Retail
Purchases $140,000 $190,000
Beginning inventory 29,000 45,000
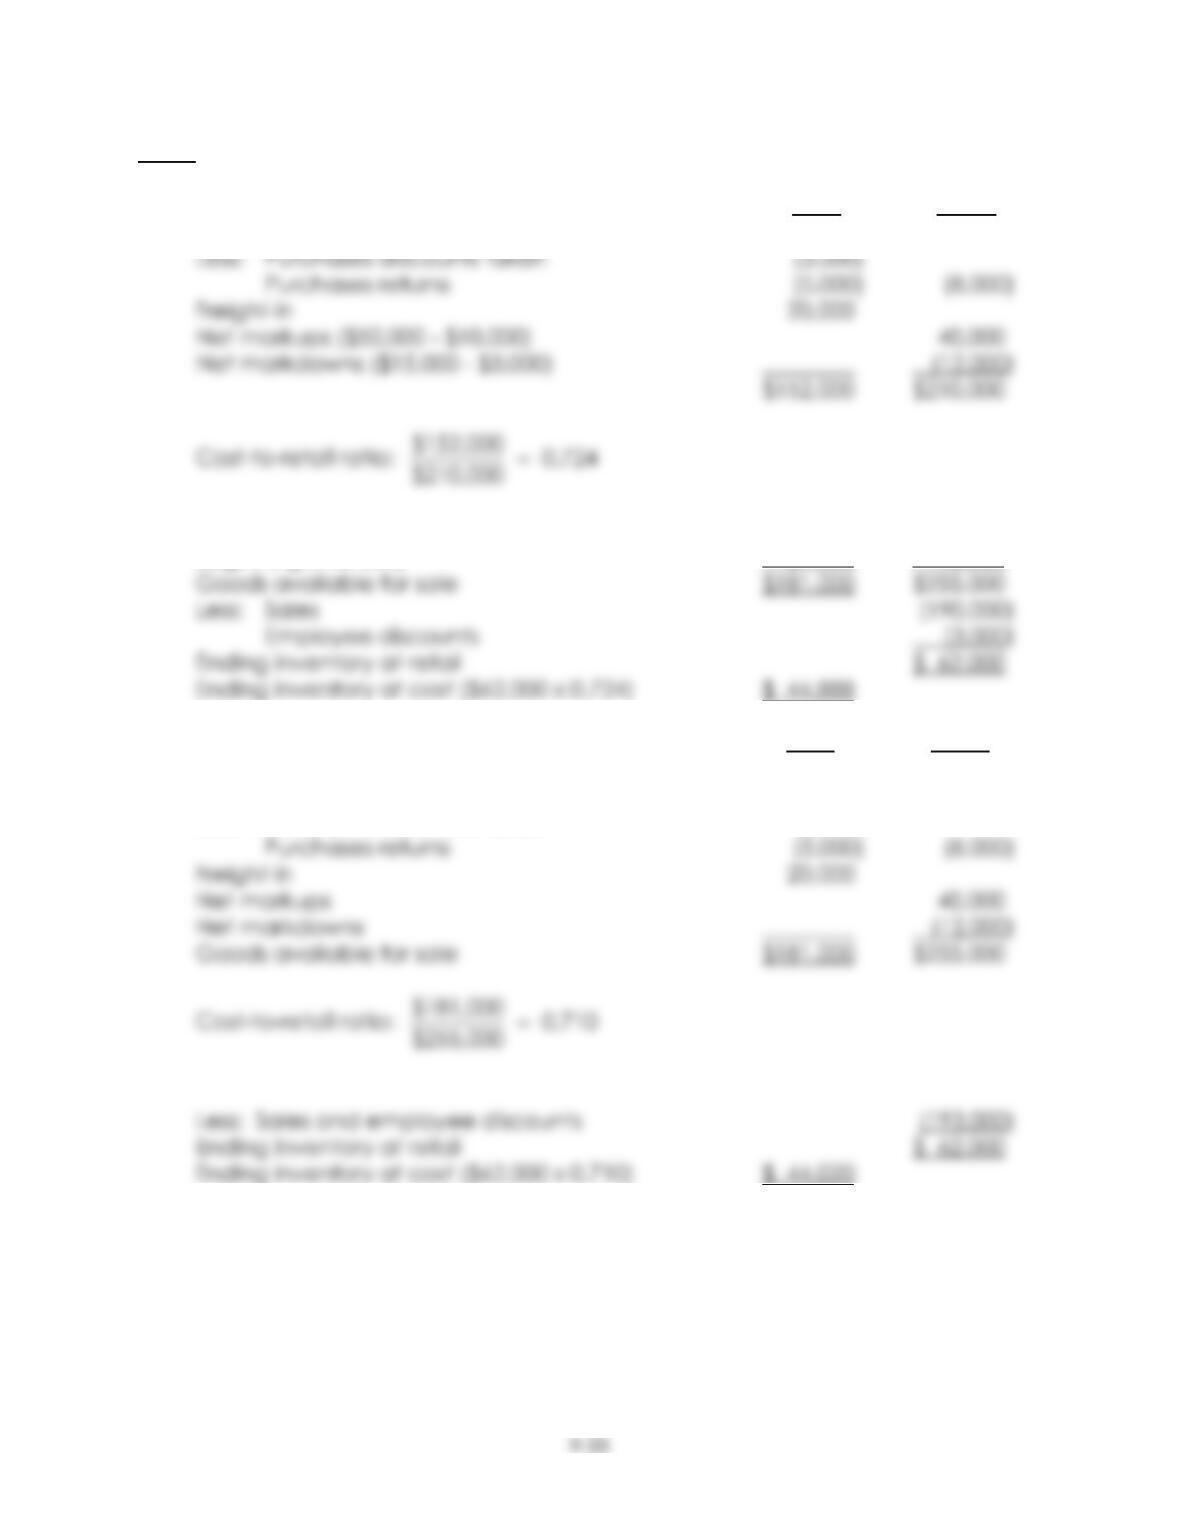
2. Cost Retail
Beginning inventory $ 29,000 $ 45,000
Purchases 140,000 190,000
Less: Purchases discounts taken (3,000)
P9-10 (continued)
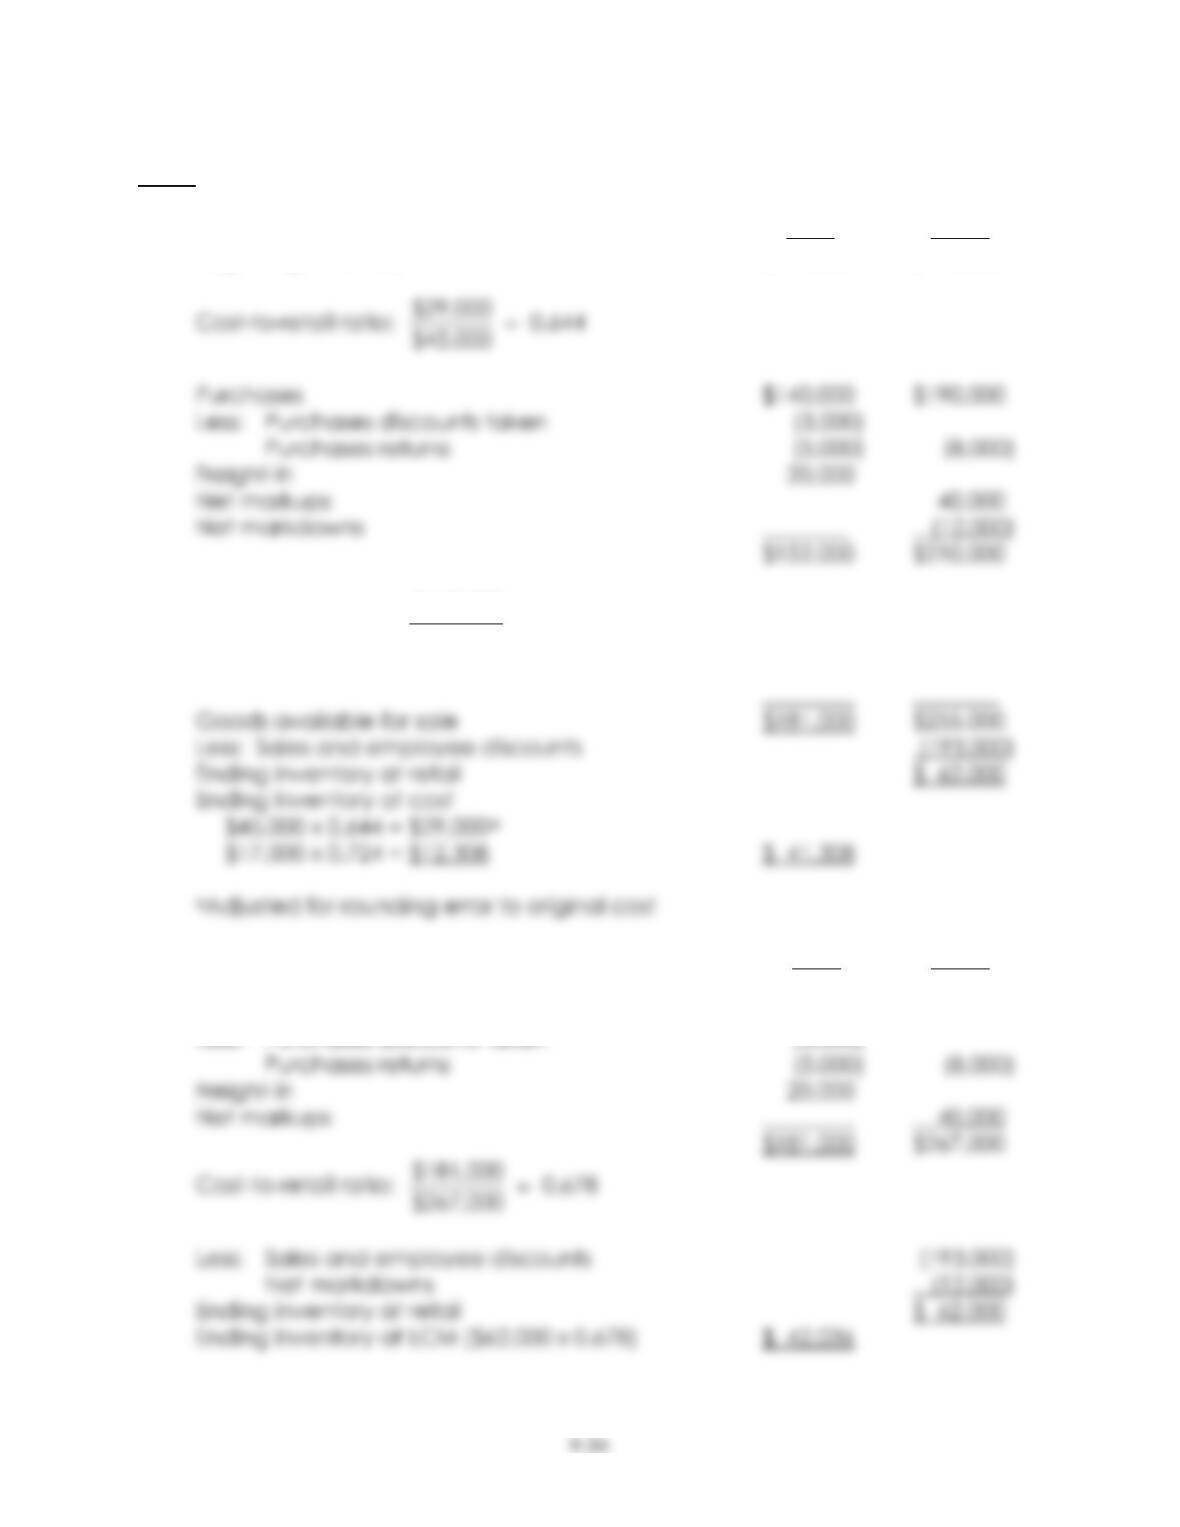
3. Cost Retail
Beginning inventory $ 29,000 $ 45,000
Cost-to-retail ratio: 0.724
$210,000
$152,000 =
4. Cost Retail
Beginning inventory $ 29,000 $ 45,000
Purchases 140,000 190,000
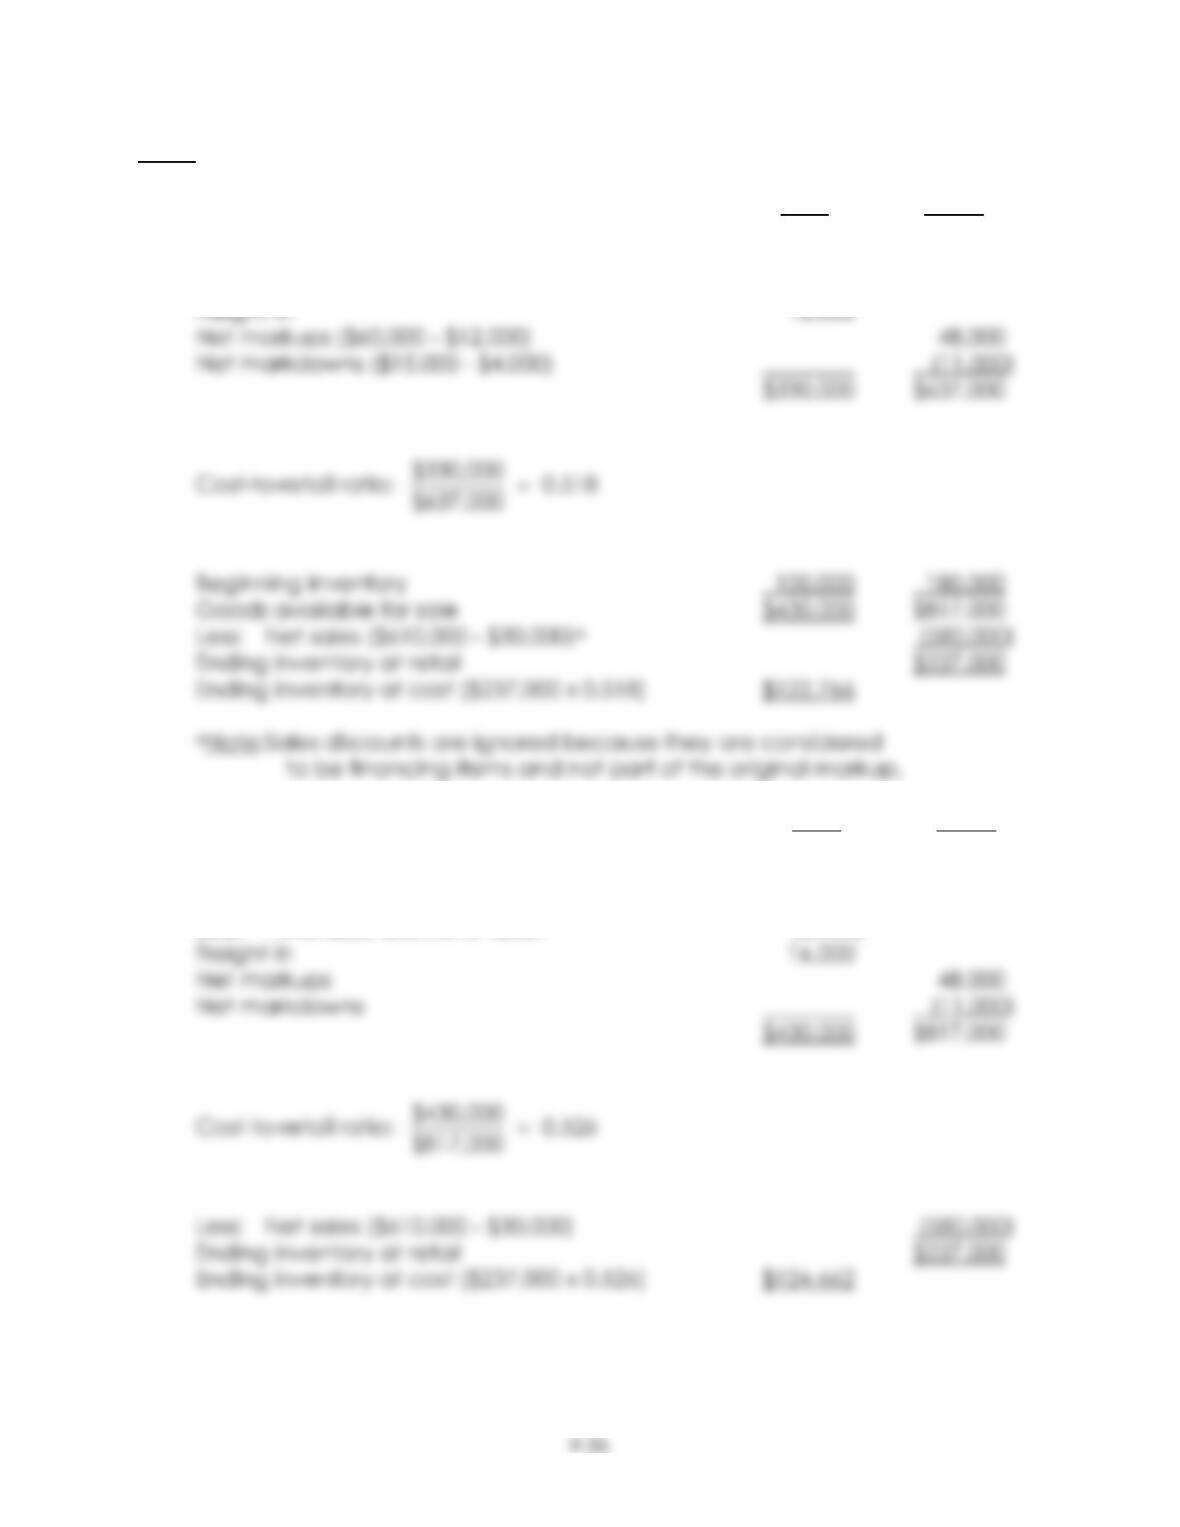
P9-11
1. Cost Retail
Purchases $320,000 $600,000
Less: Purchases discounts taken (6,000)
2. Cost Retail
Beginning inventory $100,000 $180,000
Purchases 320,000 600,000
Less: Purchases discounts taken (6,000)
P9-11 (continued)
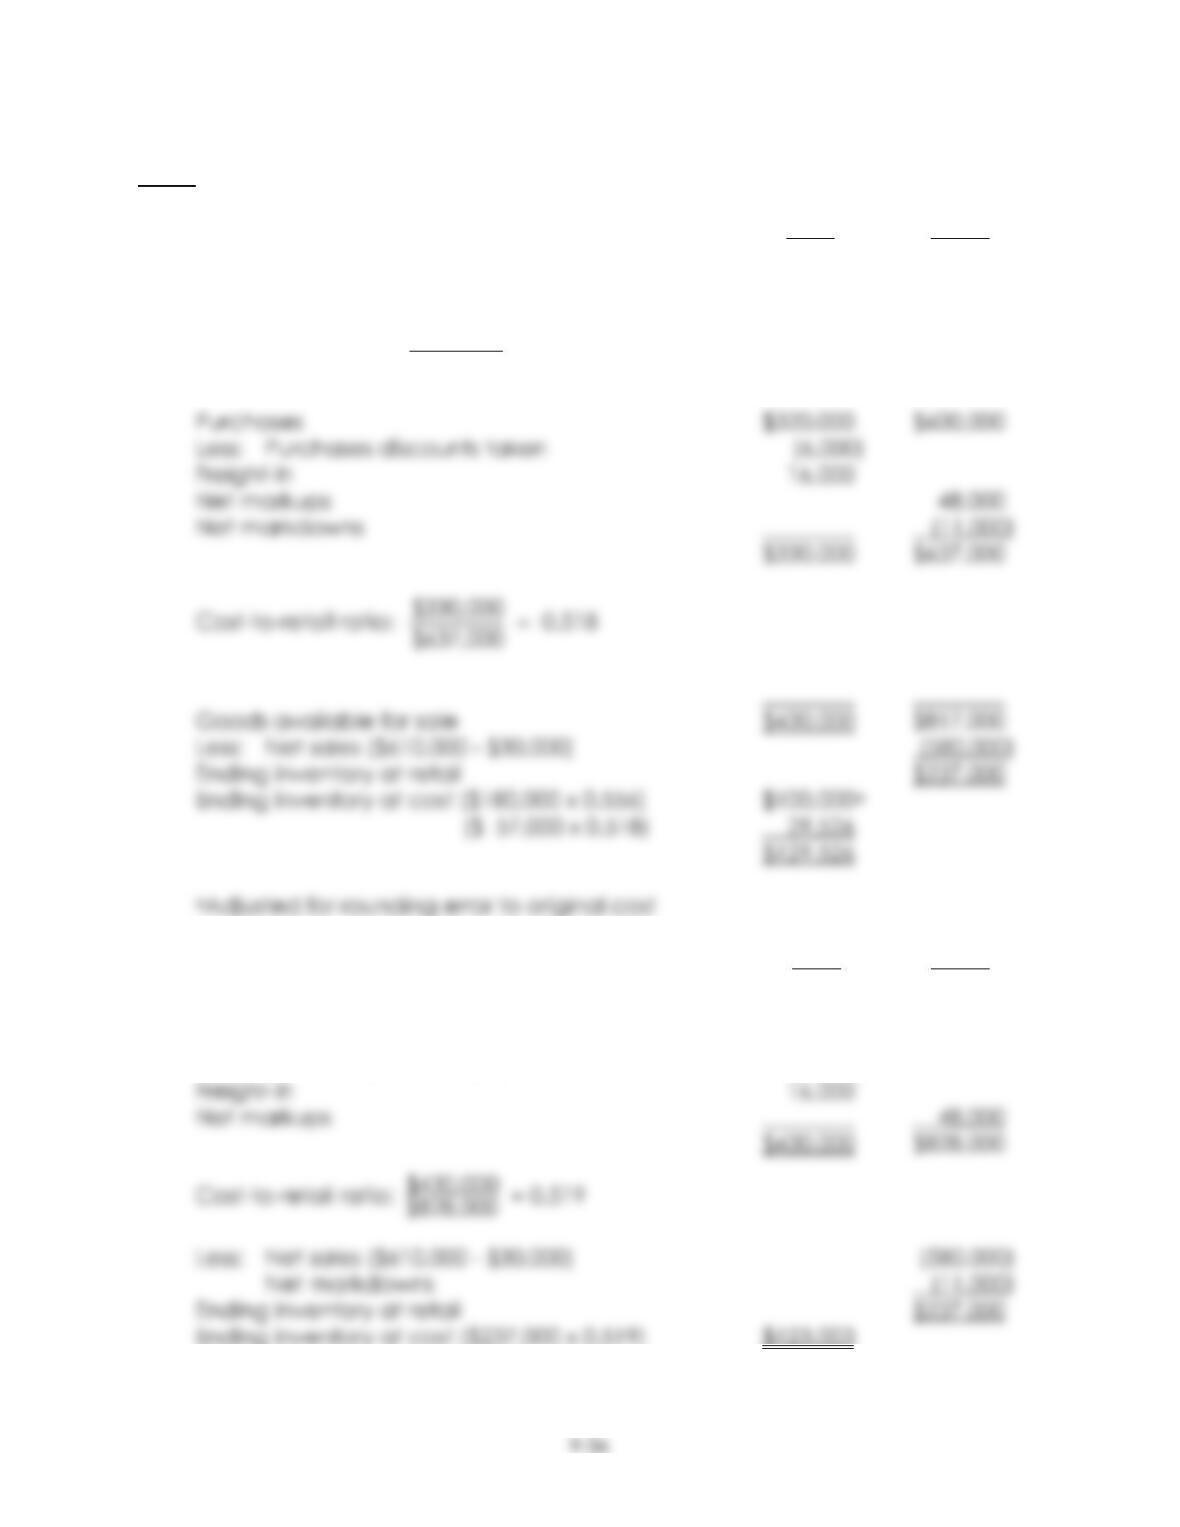
3. Cost Retail
Beginning inventory $100,000 $180,000
Cost-to-retail ratio: 0.556
$180,000
$100,000 =
4. Cost Retail
Beginning inventory $100,000 $180,000
Purchases 320,000 600,000
Less: Purchases discounts taken (6,000)