CHAPTER 8
SOLUTIONS TO B EXERCISES
E8-1B (15–20 minutes)
Items 6, 7, 8, 9, 11, 13, 14, 17, and 18 would be reported as inventory in the
financial statements.
The following items would not be reported as inventory:
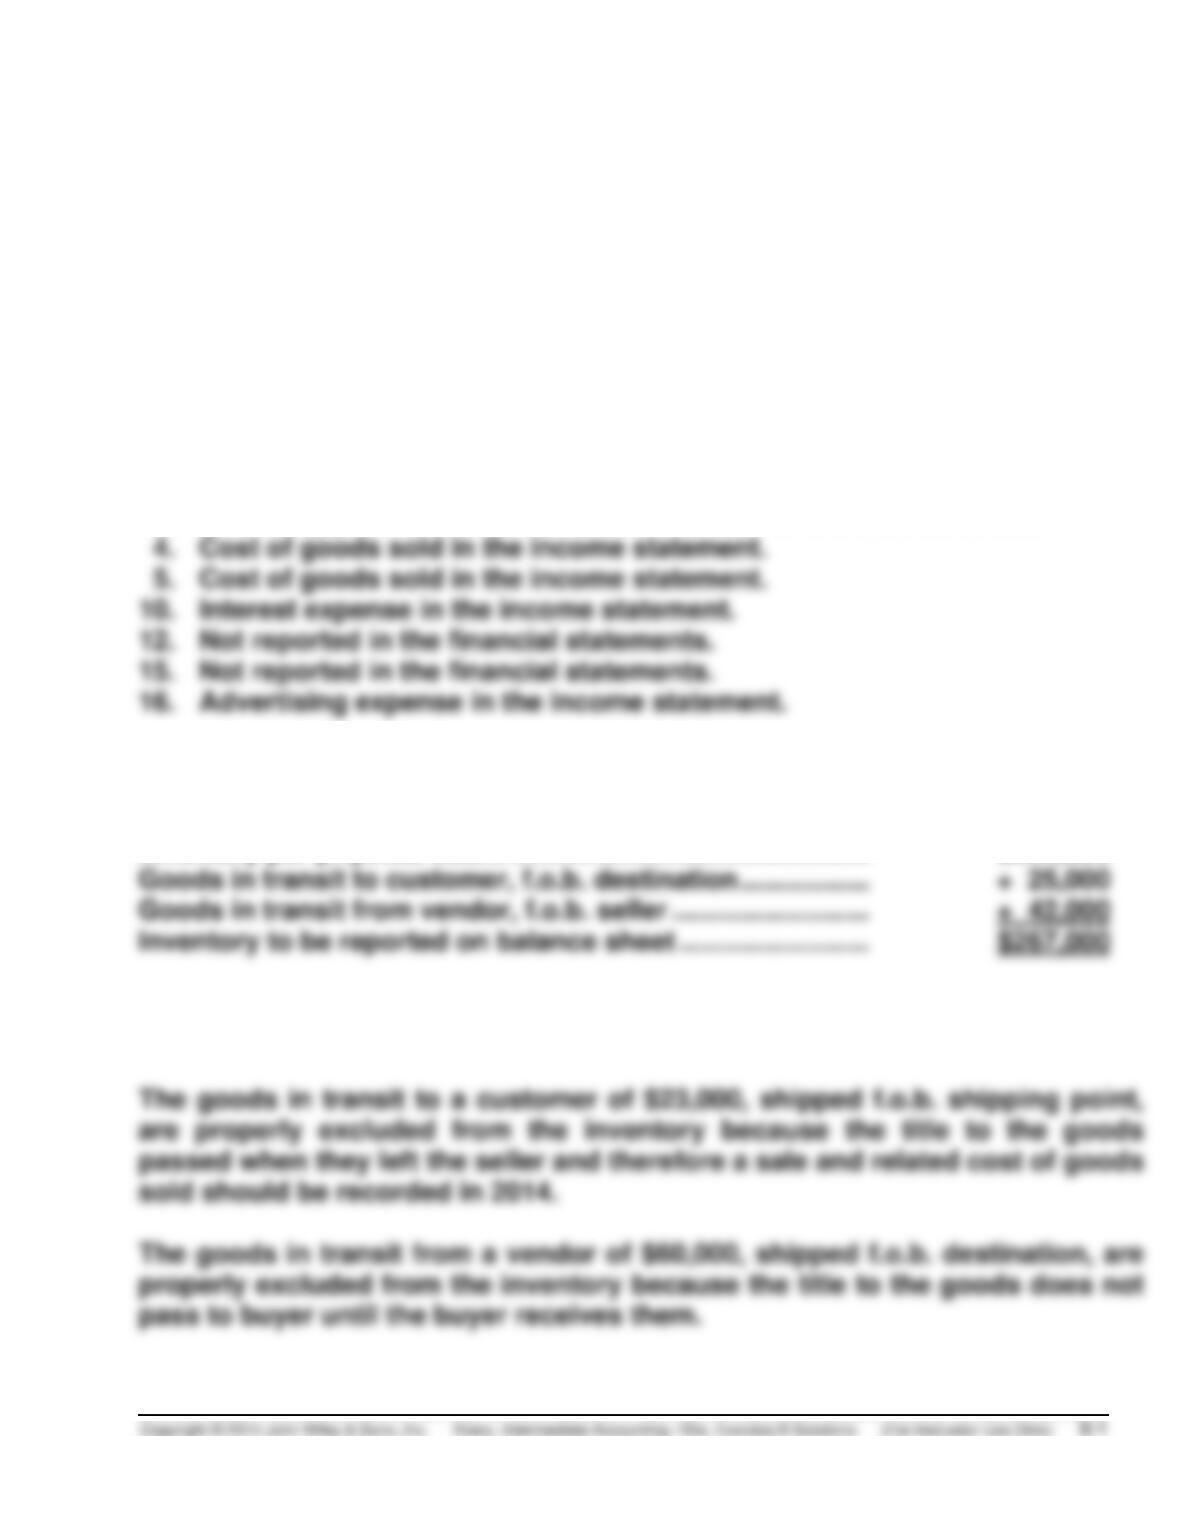
1. Cost of goods sold in the income statement.
2. Short-term investments in the current asset section of the balance sheet.
3. Office supplies in the current assets section of the balance sheet.
E8-2B (10–15 minutes)
Inventory per physical count ………………………………………..
$200,000
Goods in transit to customer, f.o.b. destination ……………..
+ 25,000
The consigned goods of $20,000 are not owned by the company and were
properly excluded.
E8-3B (10–15 minutes)
1. Include. Merchandise passes to customer only when it is shipped.
2. Do not include. Title did not pass until January 3.
E8-4B (10–15 minutes)
1.
Raw Materials Inventory ………………………………………….
40,500
Accounts Payable …………………………………………..
40,500
2.
Raw Materials Inventory ………………………………………….
140,000
Accounts Payable …………………………………………..
140,000
3.
No adjustment necessary.
4.
Accounts Payable …………………………………………………..
38,000
Raw Materials Inventory ………………………………….
38,000
5.
Raw Materials Inventory ………………………………………….
95,000
Accounts Payable …………………………………………..
95,000
E8-5B (15–20 minutes)
(a)
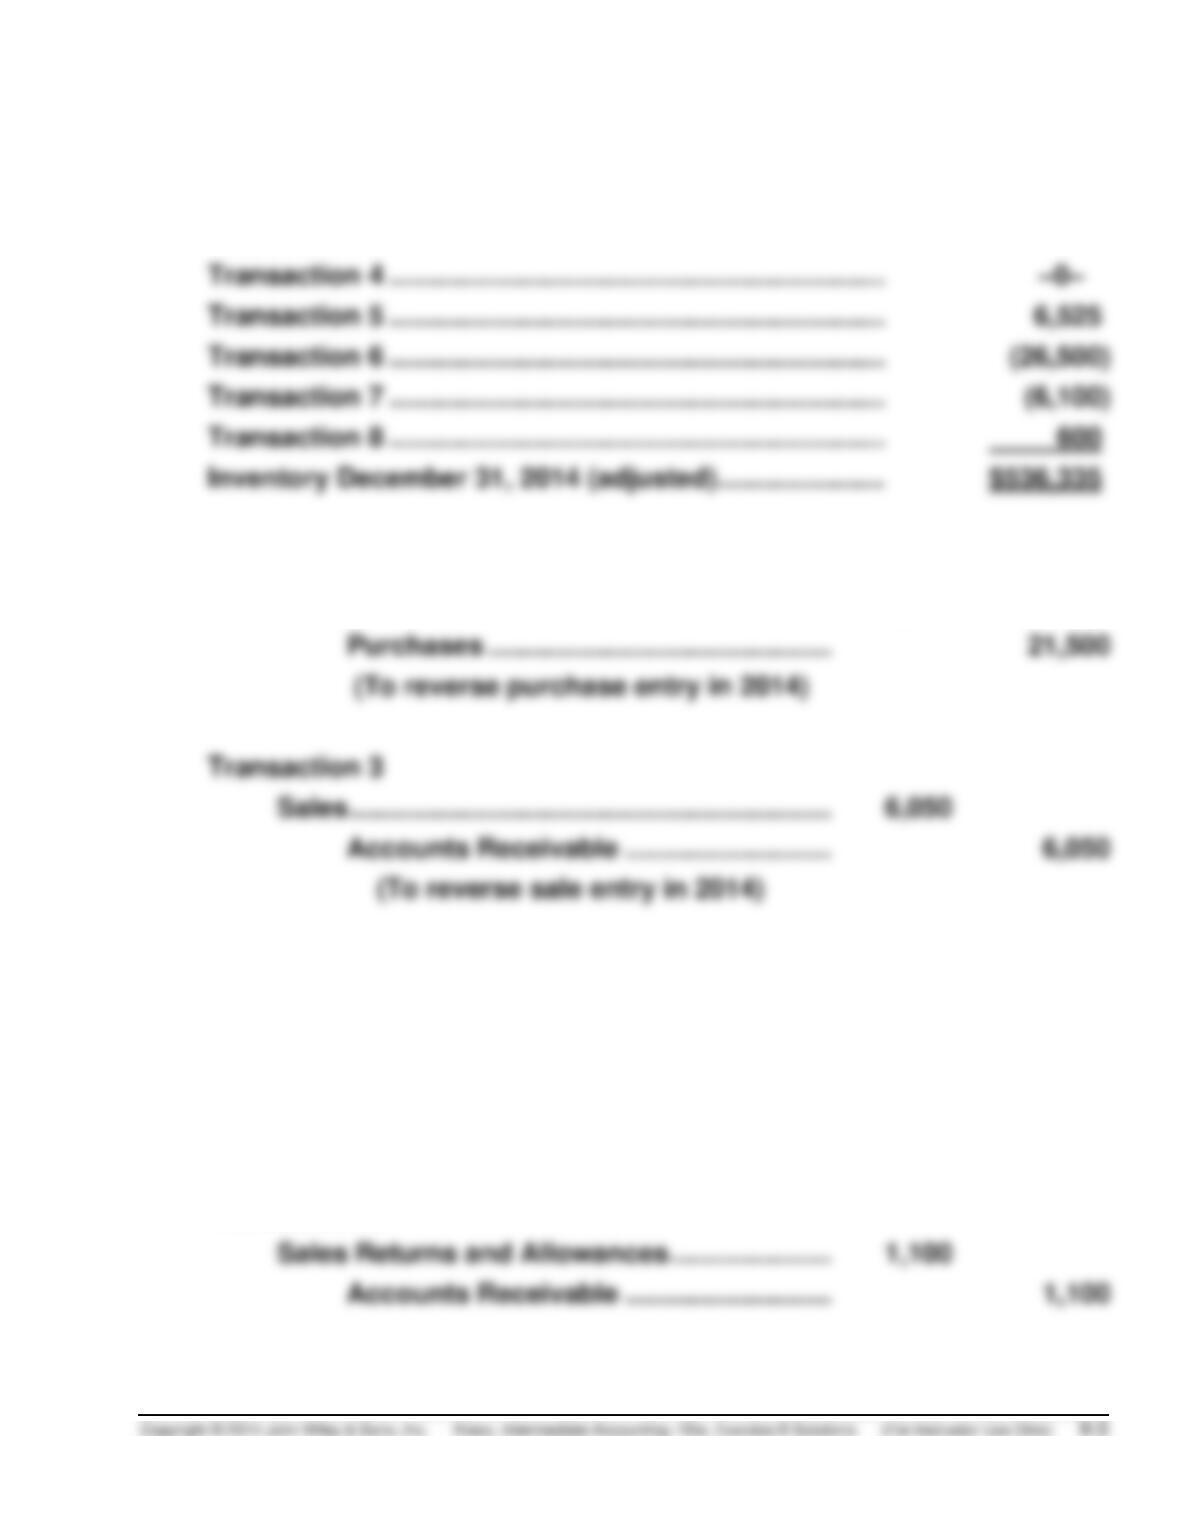
Inventory December 31, 2014 (unadjusted) ……………..
$561,810
Transaction 2 ………………………………………………………..
–0–
Transaction 3 ………………………………………………………..
–0–
Transaction 4 ………………………………………………………..
–0–
Transaction 5 ………………………………………………………..
Transaction 6 ………………………………………………………..
Transaction 7 ………………………………………………………..
Transaction 8 ………………………………………………………..
600
(b)
Transaction 2
Accounts Payable ……………………………………
21,500
Purchases ………………………………………………………..
21,500
(To reverse purchase entry in 2014)
Transaction 3
Sales …………………………..………………………….
Accounts Receivable ………………………………………..
(To reverse sale entry in 2014)
Transaction 4
Purchases ………………………………………………
12,610
Accounts Payable ……………………………………………..
12,610
(To record purchase of
merchandise in 2014)
Transaction 8
Sales Returns and Allowances …………………
Accounts Receivable ………………………
E8-6B (10–20 minutes)
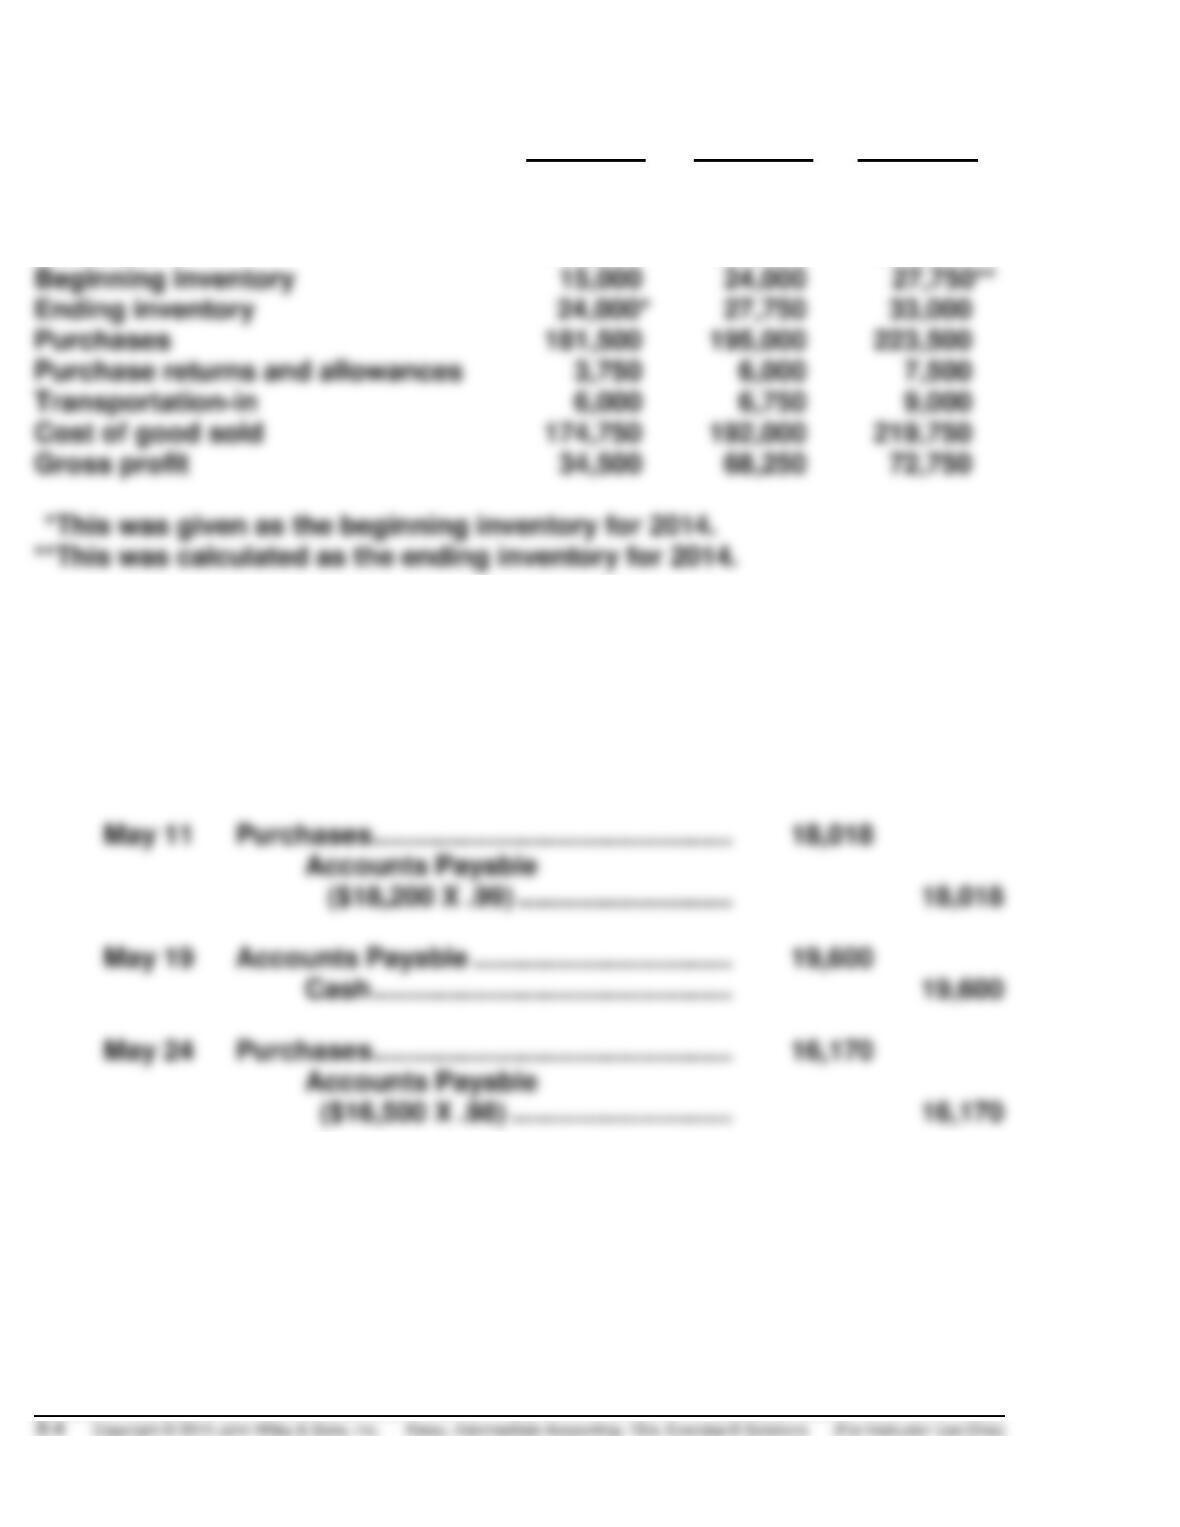
2013
2014
2015
Sales
$217,500
$270,000
$307,500
Sales returns
8,250
9,750
15,000
Net sales
209,250
260,250
292,500
Beginning inventory
Ending inventory
33,000
Purchases
181,500
195,000
223,500
Purchase returns and allowances
3,750
6,000
6,000
6,750
Cost of good sold
174,750
192,000
219,750
Gross profit
72,750
E8-7B (10–15 minutes)
(a)
May 10
Purchases ………………………………………………………………
19,600
Accounts Payable
($20,000 X .98) ……………………………………………..
19,600
May 11
Purchases ………………………………………………………………
18,018
Accounts Payable
($18,200 X .99) ……………………………………………..
May 19
Accounts Payable …………………………………………………..
Cash ………………………………………………………………
May 24
Purchases ………………………………………………………………
Accounts Payable
(b)
May 31
Purchase Discounts Lost ………………………………………..
182
Accounts Payable
($18,200 X .01) ……………………………………………..
182
(Discount lost on purchase
of May 11, $18,200, terms
1/15, n/30)
E8-8B (10 minutes)
(a)
Feb. 1
Inventory ($21,600 x (1 – 5%)) …………………………………..
20,520
Accounts Payable …………………………………………..
20,520
Feb. 4
Accounts Payable ($5,000 x (1 – 5%)) ……………………….
Inventory ………………………………………………………..
Feb. 13
Accounts Payable ($20,520 – $4,750) ………………………..
15,770
Inventory (2% X $15,770) …………………………………
Cash ………………………………………………………………
15,455
(b)
Feb. 1
Purchases ………………………………………………………………
20,520
Accounts Payable …………………………………………..
20,520
Feb. 4
Accounts Payable……………………………………………………
Feb. 13
Accounts Payable……………………………………………………
15,770
Purchase Discounts ………………………….. $7,470)
Cash ………………………………………………………………
15,455
(c)
Purchase price (list) …………………………………..
$21,600
Less: Trade discount ($21,600 x 5%)
1,080
Less: Cash discount (20,520 X 2%) …………….
E8-9B (15–25 minutes)
(a)
Jan. 4
Accounts Receivable ………………………………………………
3,840
Sales (240 X $16) …………………………..………………..
3,840
Accounts Payable……………………………………………
5,400
Jan. 13
Accounts Receivable ………………………………………………
6,300
Jan. 20
Purchases (480 X $14) ……………………………………………..
6,720
Accounts Payable……………………………………………
6,720
E8-9B (Continued)
Jan. 27
Accounts Receivable ………………………………………………
5,400
Sales (300 X $18) …………………………………………….
5,400
Jan. 31
Inventory ($14 X 330) ………………………………………………
Cost of Goods Sold …………………………………………………
Purchases ($5,400 + $6,720) …………………………….
Inventory (300 X $10) ………………………………………
(c)
Jan. 4
Accounts Receivable ………………………………………………
3,840
Sales ………………………………………………………………..
3,840
Cost of Goods Sold …………………………………………………
2,400
Inventory (240 X $10) …………………………………………
2,400
Jan. 11
Inventory ………………………………………………………………..
5,400
Accounts Payable ……………………………………………..
5,400
Jan. 13
Accounts Receivable ………………………………………………
6,300
Sales ………………………………………………………………..
6,300
Cost of Goods Sold …………………………………………………
4,200
Inventory [(60 X $10) + (300 X $12)] ………………………..
4,200
Jan. 20
Inventory ………………………………………………………………..
6,720
Accounts Payable ……………………………………………..
6,720
Jan. 27
Accounts Receivable ………………………………………………
5,400
Sales ………………………………………………………………..
5,400
Cost of Goods Sold …………………………………………………
3,900
Inventory [(150 X $12) + (150 X $14)] ………………………
3,900
(d) Sales ………………………………………………………………… $15,540
Cost of goods sold
($2,400 + $4,200 + $3,900) ……………………………… 10,500
Gross profit ………………………………………………………. $ 5,040
E8-10B (10–15 minutes)
2014
2015
1.
Working capital
Understated
No effect
Current ratio
Understated
No effect
Retained earnings
No effect
Net income
2.
Working capital
Overstated
No effect
Current ratio
Overstated
No effect
Retained earnings
No effect
Net income
Overstated
3.
Working capital
No effect
No effect
Current ratio
Overstated
No effect
Retained earnings
No effect
Net income
No effect
No effect
E8-11B (10–15 minutes)
(a)
$638,000
=
1.66 to 1
$384,000
(c)
Event
Effect of Error
Adjust Income
Increase
(Decrease)
1.
Overstatement of purchases
Decreases net income
$10,000
and inventory (no effect on
Decreases net income
$11,000
E8-12B (15–20 minutes)
Errors in Inventories
Year
Net
Income
Per Books
Add
Overstate-
ment Jan. 1
Deduct
Understate-
ment Jan. 1
Deduct
Overstate-
ment Dec. 31
Add
Understate-
ment Dec. 31
Corrected
Net Income
2010
$ 50,000
$8,000
$ 58,000
2013
65,000
59,000
E8-13B (15–20 minutes)
(a)
Cost of Goods Sold
Ending Inventory
1.
LIFO
750 @ $3 =
$2,250
450 @ $1 =
$ 450
750 @ $2 =
450 @ $2 =
900
$3,750
FIFO
450 @ $1 =
$ 450
750 @ $3 =
1,050 @ $2 =
150 @ $2 =
300
$2,550
(b)
LIFO
150 @ $1 =
$ 150
450 @ $2 =
900
300 @ $3 =
900
$1,950
($2.70 X 450)
Cost of goods sold
Gross profit (FIFO)
$1,260
and inventory value.
E8-13B (Continued)
(d) FIFO inventory is based on current costs. Therefore, older costs are
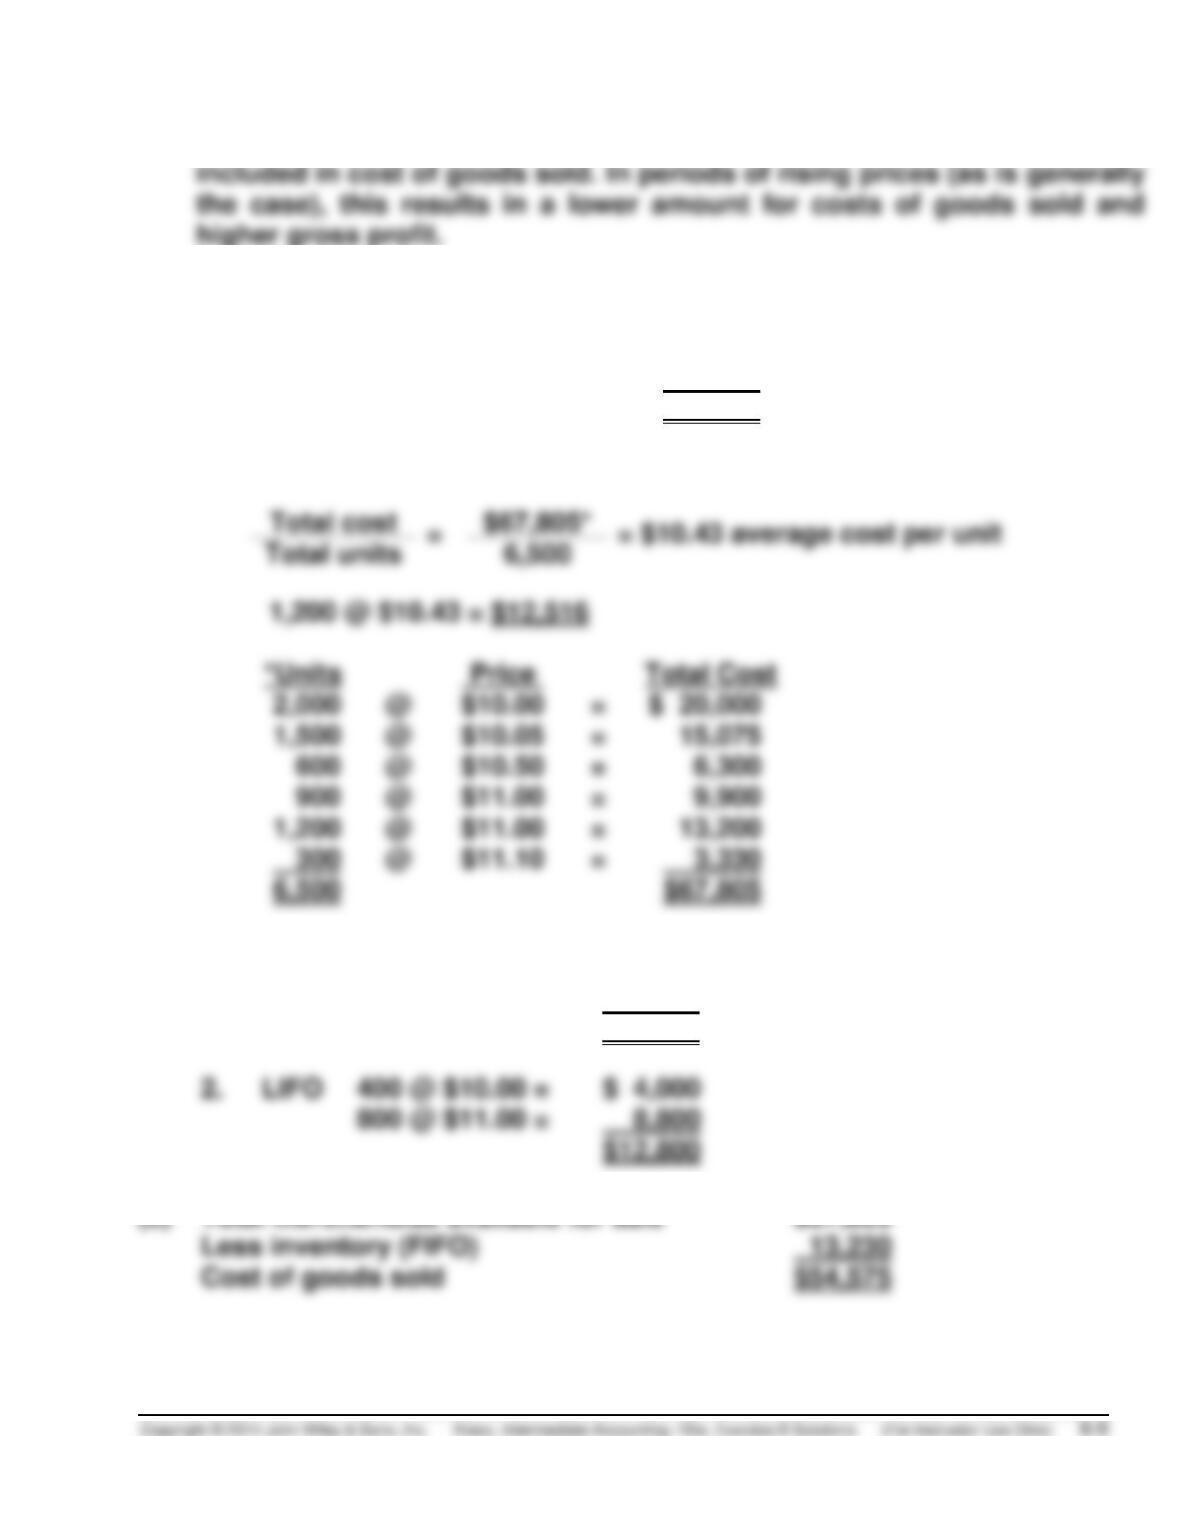
E8-14B (20–25 minutes)
(a)
1.
LIFO
1,200 @ $10.00 =
$12,000
$12,000
2.
Average cost
1,200 @ $10.43 = $12,516
3,330
$67,805
(b)
1.
FIFO
300 @ $11.10 =
$ 3,330
900 @ $11.00 =
9,900
$13,230
2.
LIFO
400 @ $10.00 =
$ 4,000
$12,800
(c)
Total merchandise available for sale
Less inventory (FIFO)
(d)
FIFO.
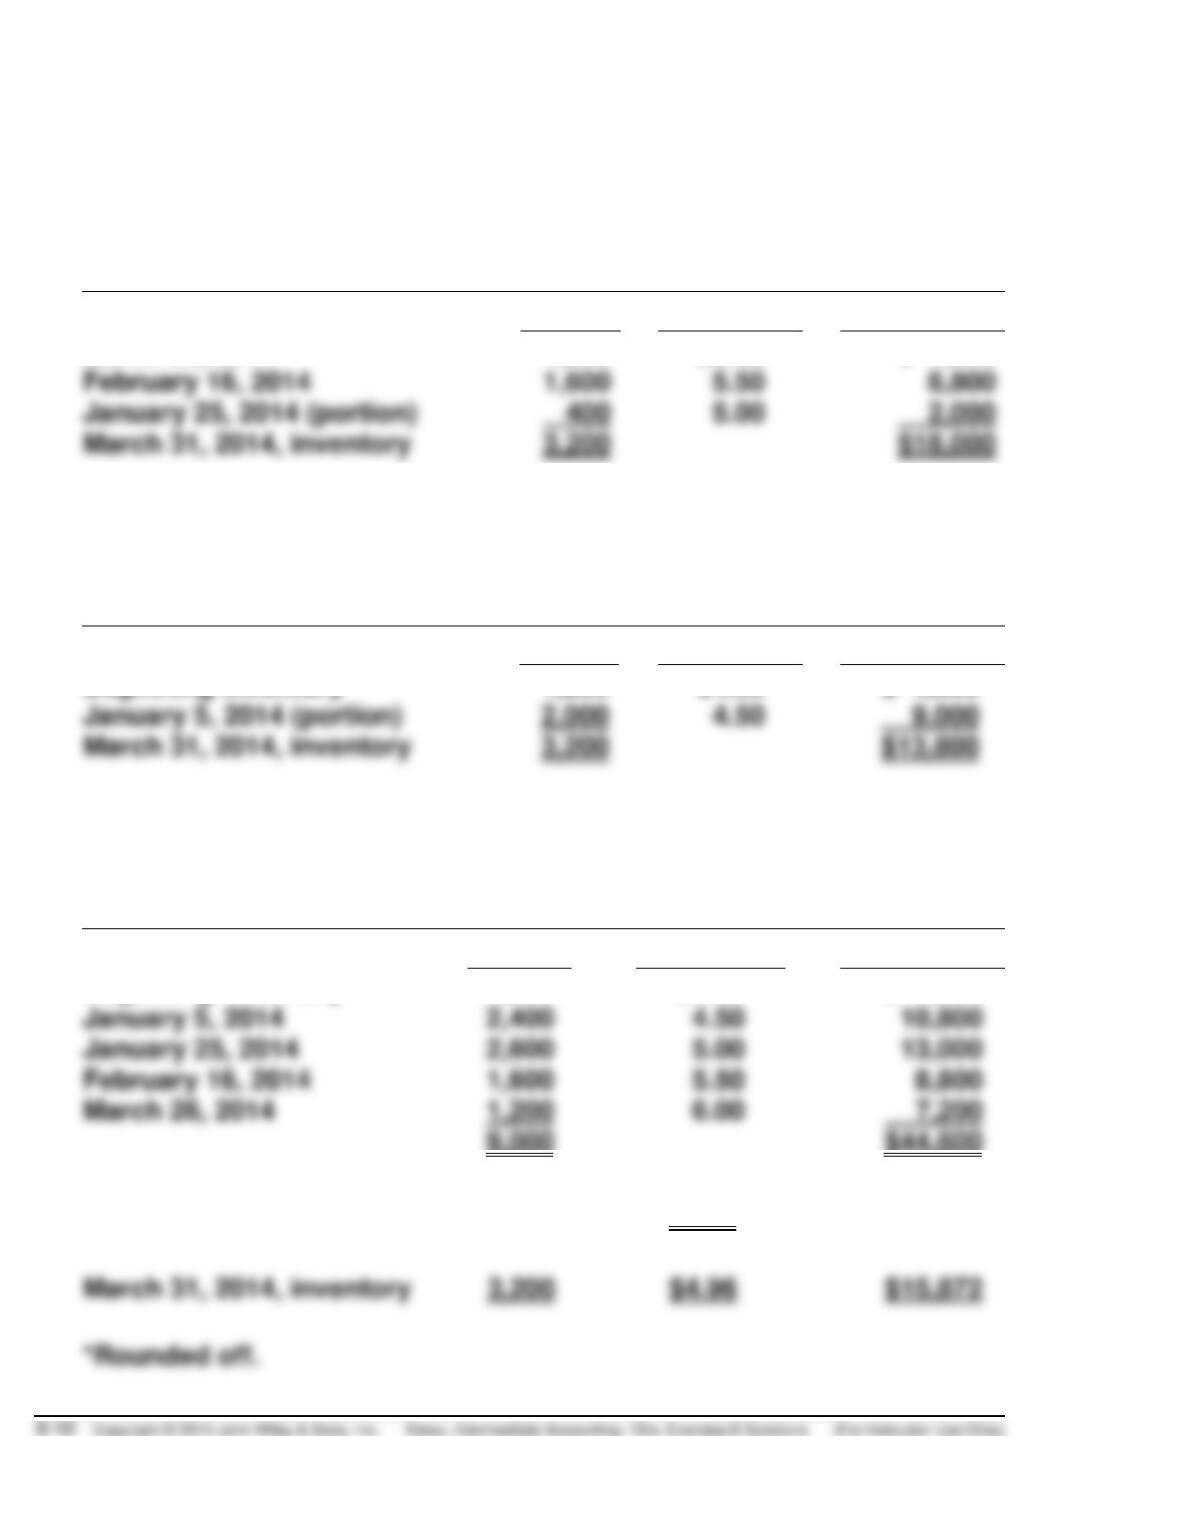
E8-15B (15–20 minutes)
(a) SAWYER COMPANY
Computation of Inventory For Product
BAP Under FIFO Inventory Method
March 31, 2014
Units
Unit Cost
Total Cost
March 26, 2014
1,200
$6.00
$ 7,200
February 16, 2014
January 25, 2014 (portion)
400
2,000
March 31, 2014, inventory
(b) SAWYER COMPANY
Computation of Inventory For Product
BAP Under LIFO Inventory Method
March 31, 2014
Units
Unit Cost
Total Cost
Beginning inventory
1,200
$4.00
$ 4,800
January 5, 2014 (portion)
March 31, 2014, inventory
(c) SAWYER COMPANY
Computation of Inventory For Product
BAP Under Weighted-Average Inventory Method
March 31, 2014
Units
Unit Cost
Total Cost
Beginning inventory
1,200
$4.00
$ 4,800
January 5, 2014
January 25, 2014
2,600
February 16, 2014
March 26, 2014
Weighted-average cost
($44,600 ÷ 9,000)
$4.96*
March 31, 2014, inventory
$4.96
E8-16B (15–20 minutes)
(a)
1.
3,100 units available for sale – 2,500 units sold = 600 units in the
ending inventory.
300 @ $9.05 =
$2,715
200 @ 9.10 =
sale = $8.79 weighted-average unit cost.
cost.
(b)
1.
cost the ending inventory.
LIFO will yield the lowest gross profit because this method will yield
the highest cost of goods sold figure in the situation presented.
2.
are the lower costs.
LIFO will yield the lowest ending inventory because LIFO uses the
E8-17B (10–15 minutes)
(a)
1.
600 @ $15 =
$ 9,000
240 @ $12 =
2,880
$11,880
600 @ $10 =
240 @ $12 =
E8-17B (Continued)
(b)
1.
FIFO
$11,800 [same as (a)]
2.
LIFO
150 @ $10 =
$ 1,500
600 @ $15 =
9,000
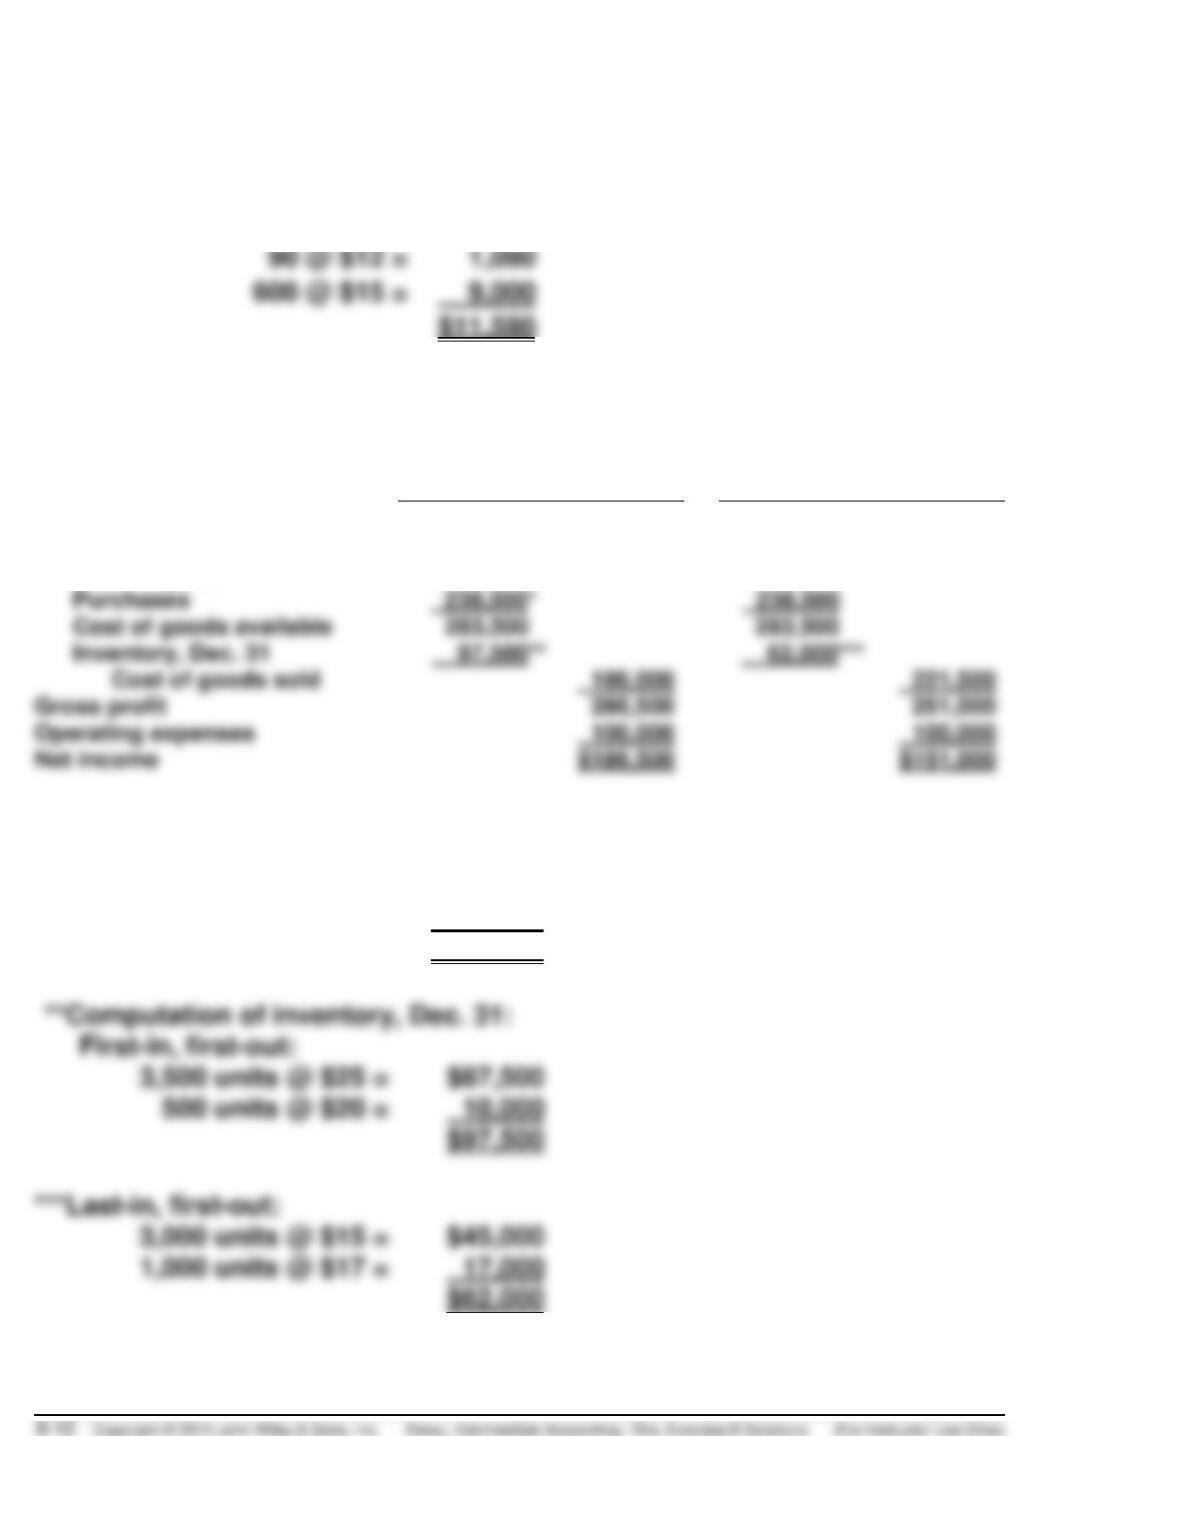
E8-18B (15–20 minutes)
First-in, first-out
Last-in, first-out
Sales
$472,500
$472,500
Cost of goods sold:
Inventory, Jan. 1
$ 45,000
$ 45,000
Purchases
Cost of goods available
Inventory, Dec. 31
Cost of goods sold
Gross profit
Operating expenses
*Purchases
3,000 @ $17 =
$ 51,000
5,000 @ $20 =
100,000
3,500 @ $25 =
87,500
$238,500
First-in, first-out:
3,500 units @ $25 =
500 units @ $20 =
***Last-in, first-out:
3,000 units @ $15 =
1,000 units @ $17 =
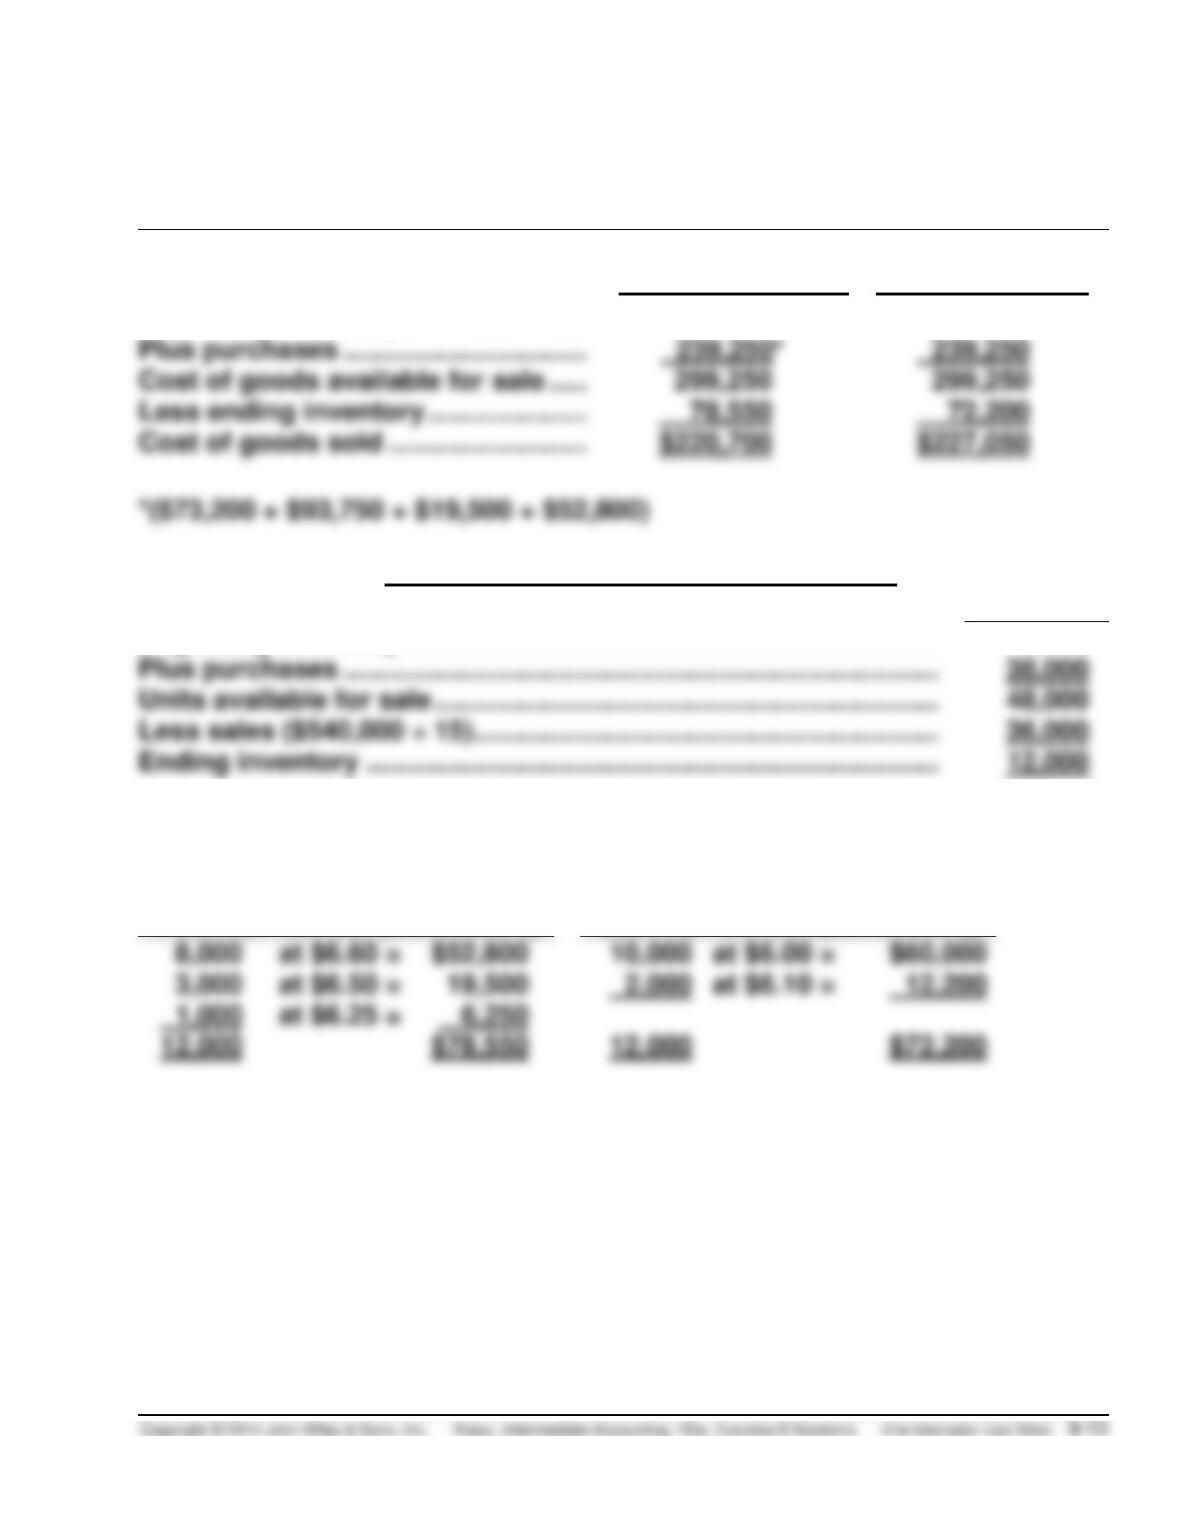
E8-19B (20–25 minutes)
CONSTANCE CORPORATION
Schedules of Cost of Goods Sold
For the First Quarter Ended July 31, 2014
Schedule 1
First-in, First-out
Schedule 2
Last-in, First-out
Beginning inventory ……………………
$ 60,000
$ 60,000
Cost of goods available for sale …..
Schedules Computing Ending Inventory
Units
Beginning inventory …………………………………………………………….
10,000
Plus purchases ……………………………………………………………………
38,000
Units available for sale …………………………………………………………
Less sales ($540,000 ÷ 15) …………………………………………………….
36,000
The unit computation is the same for both assumptions, but the cost assigned
to the units of ending inventory are different.
First-in, First-out (Schedule 1)
Last-in, First-out (Schedule 2)
at $6.60 =
at $6.00 =
at $6.50 =
at $6.10 =
at $6.25 =
E8-20B (10–15 minutes)
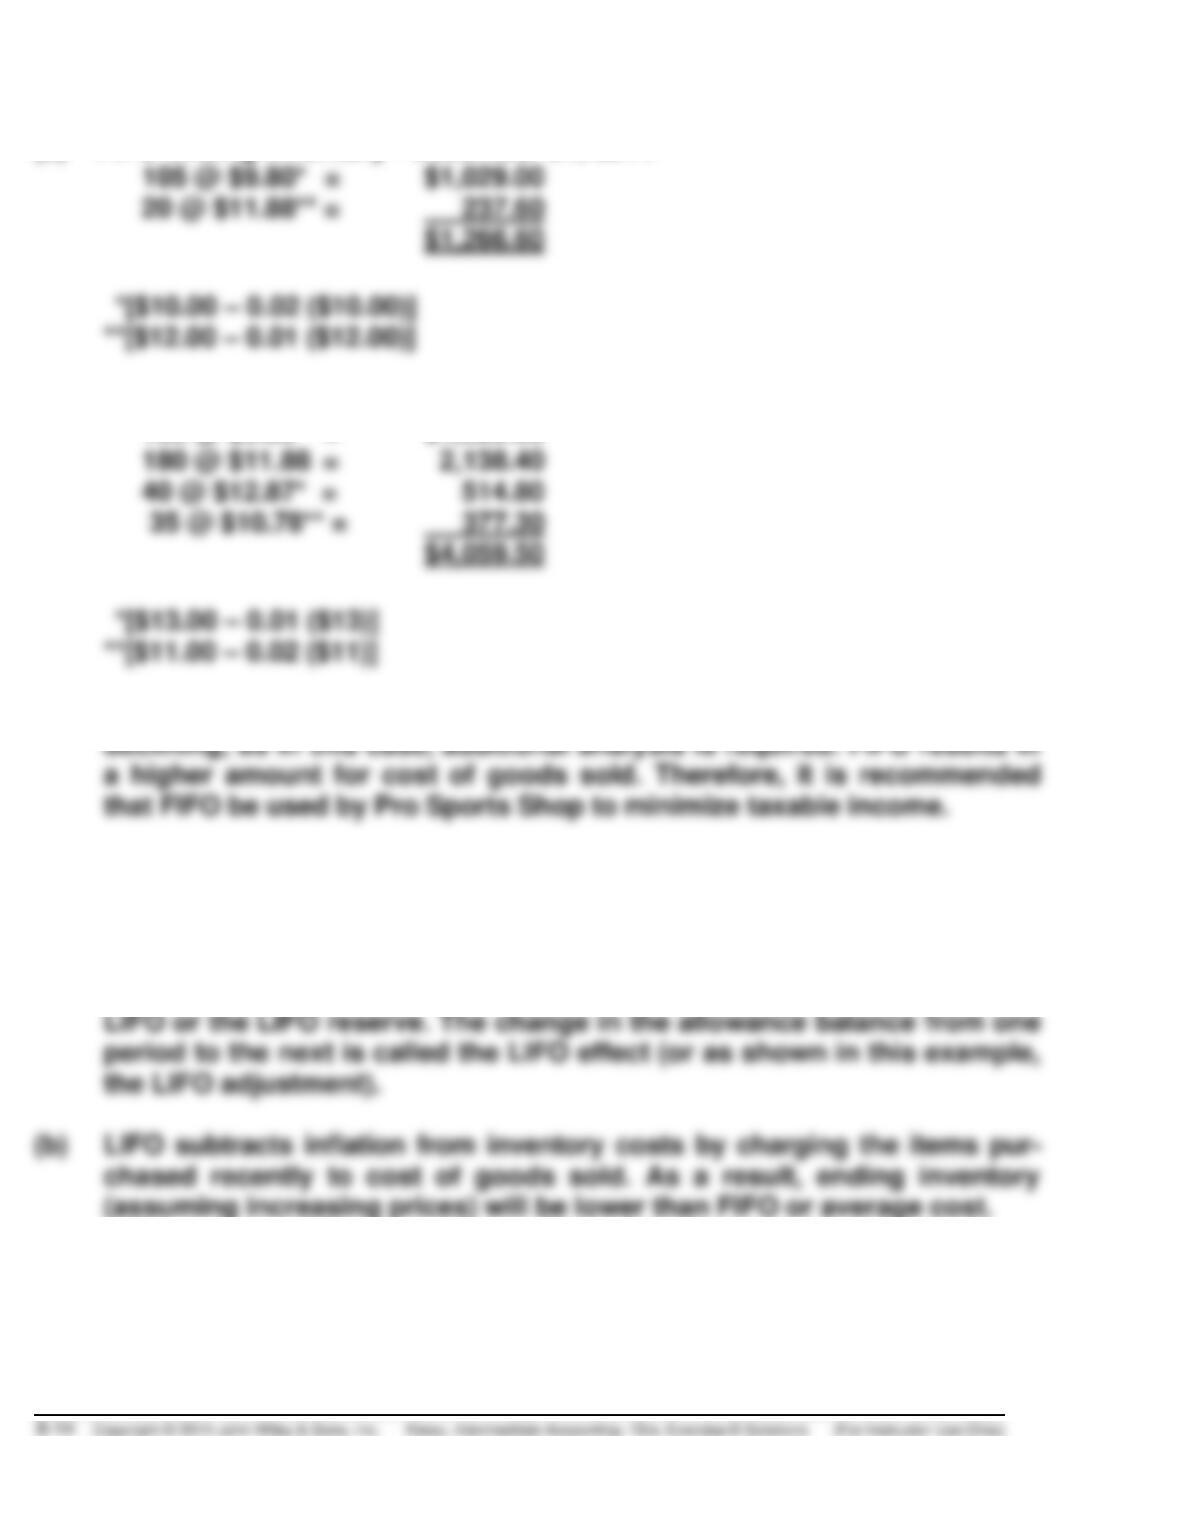
(a)
FIFO Ending Inventory – December 31, 2014
105 @ $9.80* =
$1,029.00
20 @ $11.88** =
(b)
LIFO Cost of Goods Sold—2014
105 @ $9.80 =
$1,029.00
180 @ $11.88 =
40 @ $12.87* =
35 @ $10.78** =
377.30
(c) FIFO matches older costs with revenue. When prices are increasing then
E8-21B (10–15 minutes)
(a) The difference between the inventory used for internal reporting pur–
poses and LIFO is referred to as the Allowance to Reduce Inventory to
E8-21B (Continued)
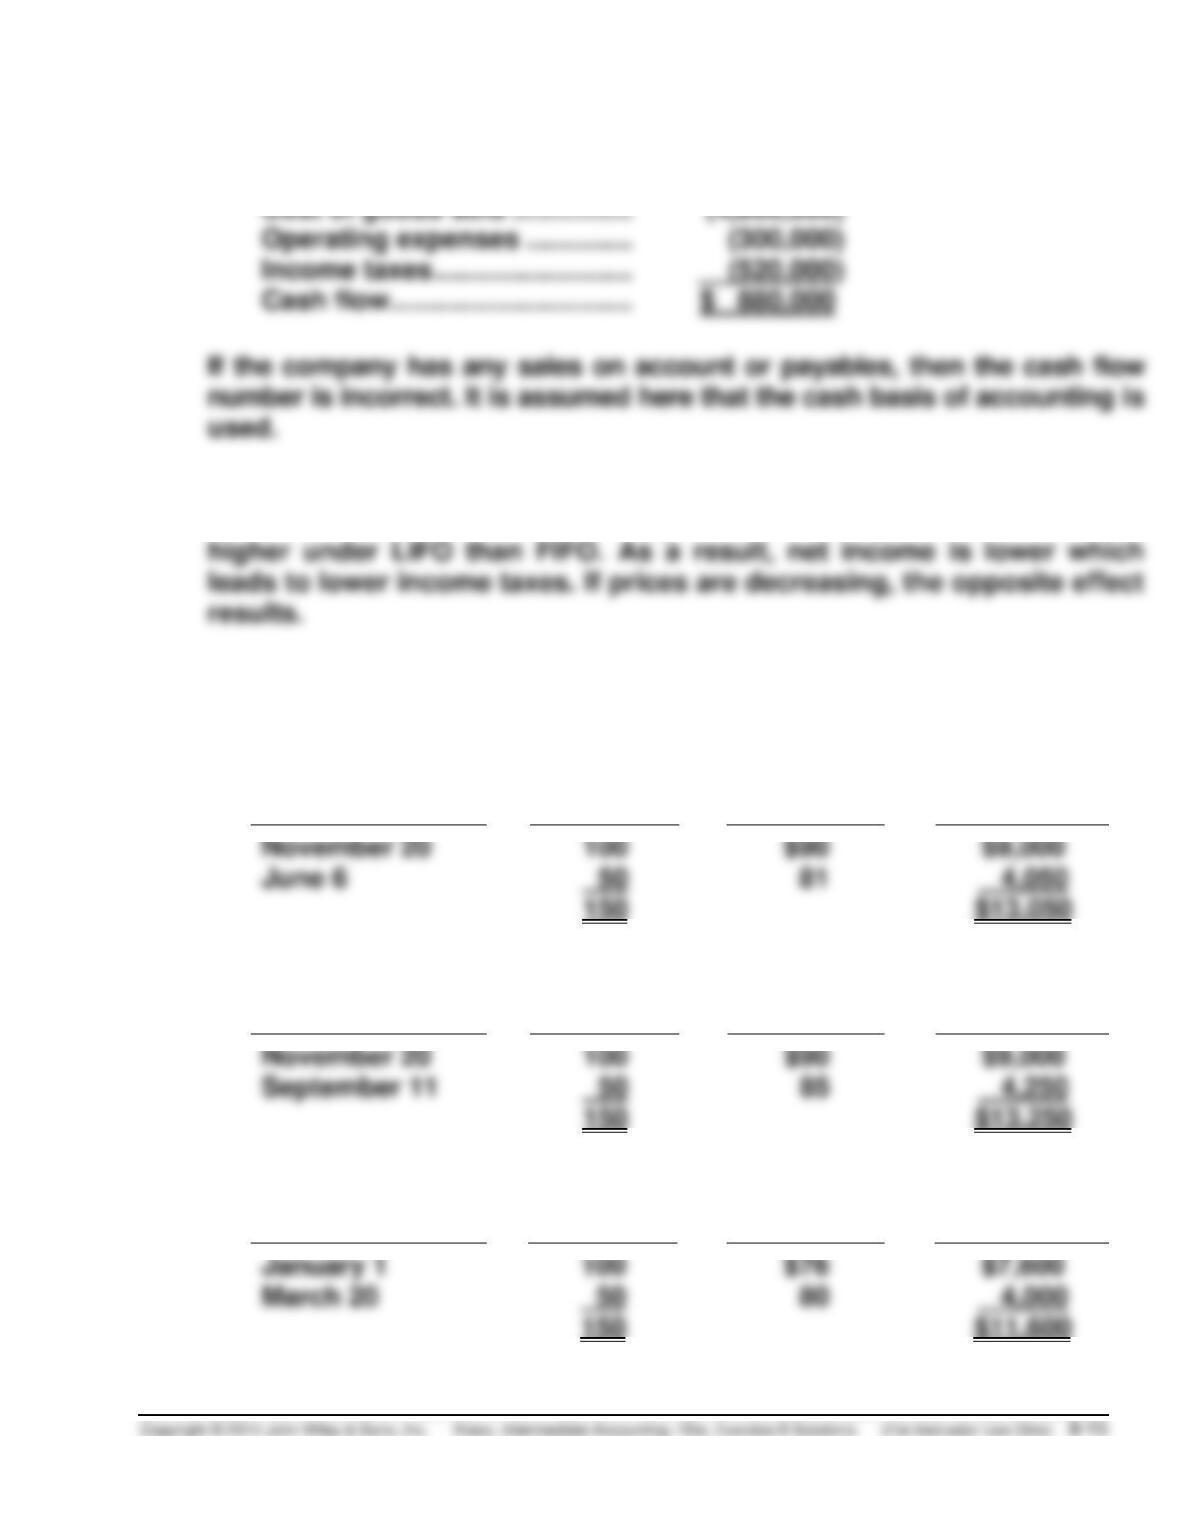
(c) Cash flow was computed as follows:
Revenue …………………………...
$6,500,000
Cost of goods sold …………….
Operating expenses …………..
Income taxes ……………………..
(d) The company has extra cash because its taxes are less. The reason
taxes are lower is because cost of goods sold (in a period of inflation) is
E8-22B (25–30 minutes)
(a)
1.
Ending inventory—Specific Identification
Date
No. Units
Unit Cost
Total Cost
November 20
June 6
2.
Ending inventory—FIFO
Date
No. Units
Unit Cost
Total Cost
November 20
September 11
3.
Ending inventory—LIFO
Date
No. Units
Unit Cost
Total Cost
March 20
E8-22B (Continued)
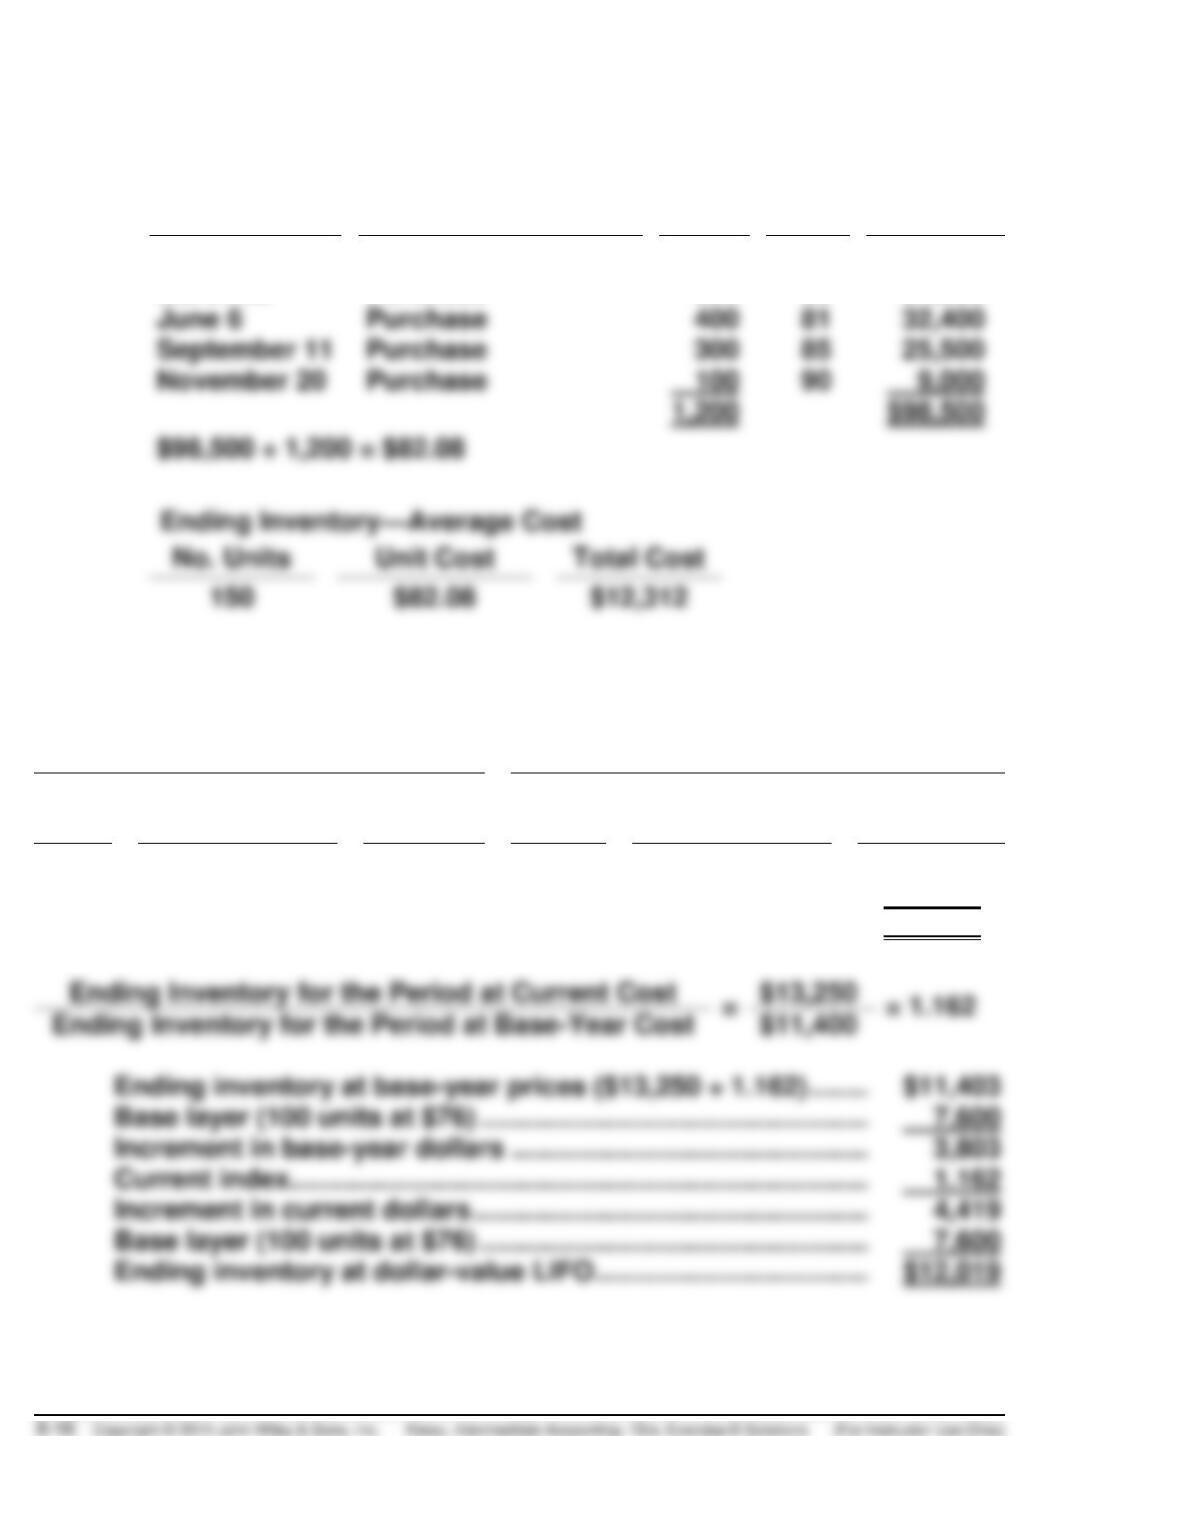
4.
Ending inventory—Average Cost
Date
Explanation
No.
Units
Unit
Cost
Total
Cost
January 1
Beginning inventory
100
$76
$ 7,600
March 20
Purchase
300
80
24,000
November 20
Purchase
100
90
9,000
(b) Double Extension Method
Base-Year Costs
Current Costs
Units
Base-Year
Cost Per Unit
Total
Units
Current-Year
Cost Per Unit
Total
150
$76
$11,400
100
$90
$9,000
50
$85
4,250
$13,250
Ending Inventory for the Period at Current Cost
Ending inventory at base-year prices ($13,250 ÷ 1.162) ………..
Current index…………………………………………………………………….
Ending inventory at dollar-value LIFO …………………………………
E8-23B (5–10 minutes)
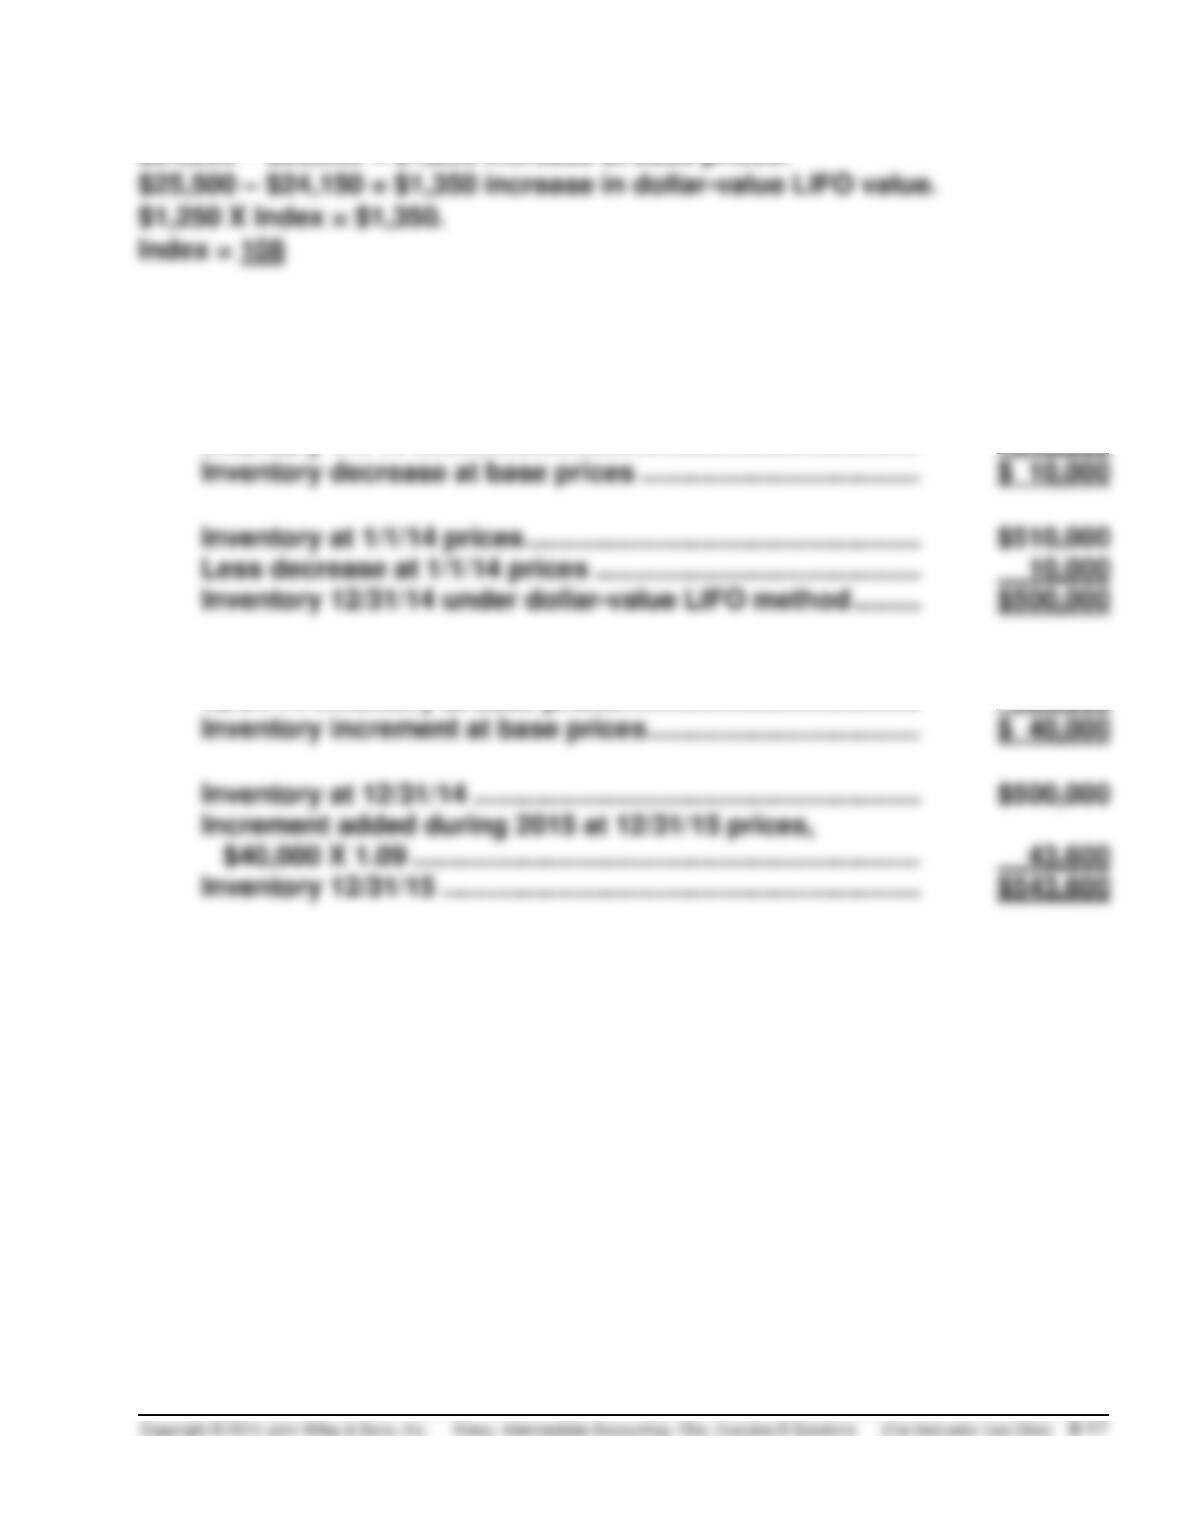
$24,250 – $23,000 = $1,250 increase at base prices.
E8-24B (15–20 minutes)
(a)
12/31/14 inventory at 1/1/14 prices, $530,000 ÷ 1.06 ……………..
$500,000
Inventory 1/1/14 ………………………………………………………………..
510,000
Inventory at 1/1/14 prices …………………………………………………..
$510,000
Less decrease at 1/1/14 prices …………………………………………..
10,000
(b)
12/31/15 inventory at base prices, $588,600 ÷ 1.09 ………………
$540,000
12/31/14 inventory at base prices ……………………………………….
500,000
$40,000 X 1.09 ………………………………………………………………..
43,600
E8-25B (20–25 minutes)
Ending Inventory—Dollar-value LIFO:
2013
$180,000
2014
$180,000 @ 1.00 =
$180,000
30,000 @ 1.05 =
31,500
$211,500
2015
$180,000 @ 1.00 =
$180,000
10,000 @ 1.05 =
10,500
$190,500
2016
$180,000 @ 1.00 =
$180,000
10,000 @ 1.05 =
10,500
4,000 @ 1.25 =
5,000
$195,500
2017
$180,000 @ 1.00 =
$180,000
10,000 @ 1.05 =
10,500
5,000
2018
$180,000 @ 1.00 =
$180,000
10,000 @ 1.05 =
10,500
4,000 @ 1.25 =
5,000
12,000 @ 1.40 =
16,800
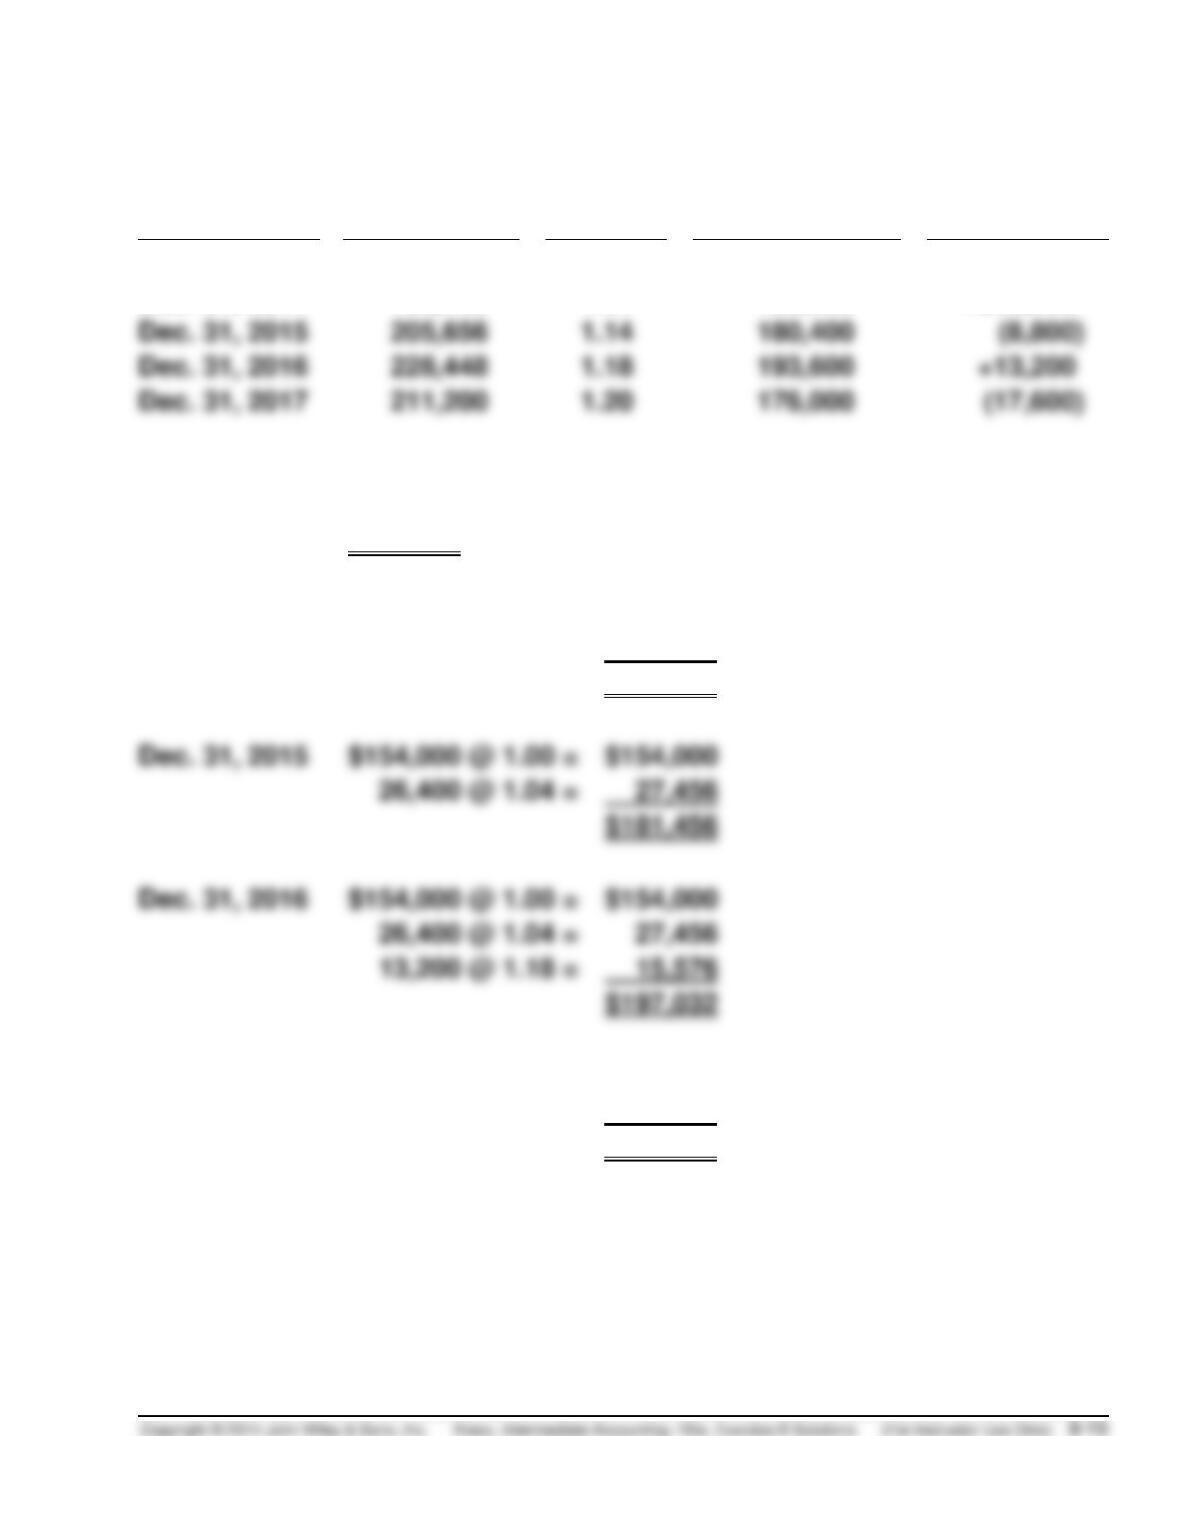
E8-26B (15–20 minutes)
Date
Current $
Price
Index
Base-Year $
Change
from
Prior Year
Dec. 31, 2013
$154,000
1.00
$154,000
—
Dec. 31, 2014
196,768
1.04
189,200
+$35,200
Dec. 31, 2015
205,656
1.14
180,400
Dec. 31, 2016
228,448
1.18
193,600
Dec. 31, 2017
211,200
1.20
176,000
Ending Inventory—Dollar-value LIFO:
Dec. 31, 2013
$154,000
Dec. 31, 2014
$154,000 @ 1.00 =
$154,000
35,200 @ 1.04 =
36,608
$190,608
Dec. 31, 2015
$154,000 @ 1.00 =
$154,000
$181,456
Dec. 31, 2016
$154,000 @ 1.00 =
$154,000
26,400 @ 1.04 =
13,200 @ 1.18 =
15,576
Dec. 31, 2017
$154,000 @ 1.00 =
$154,000
22,000 @ 1.04 =
22,880
$176,880