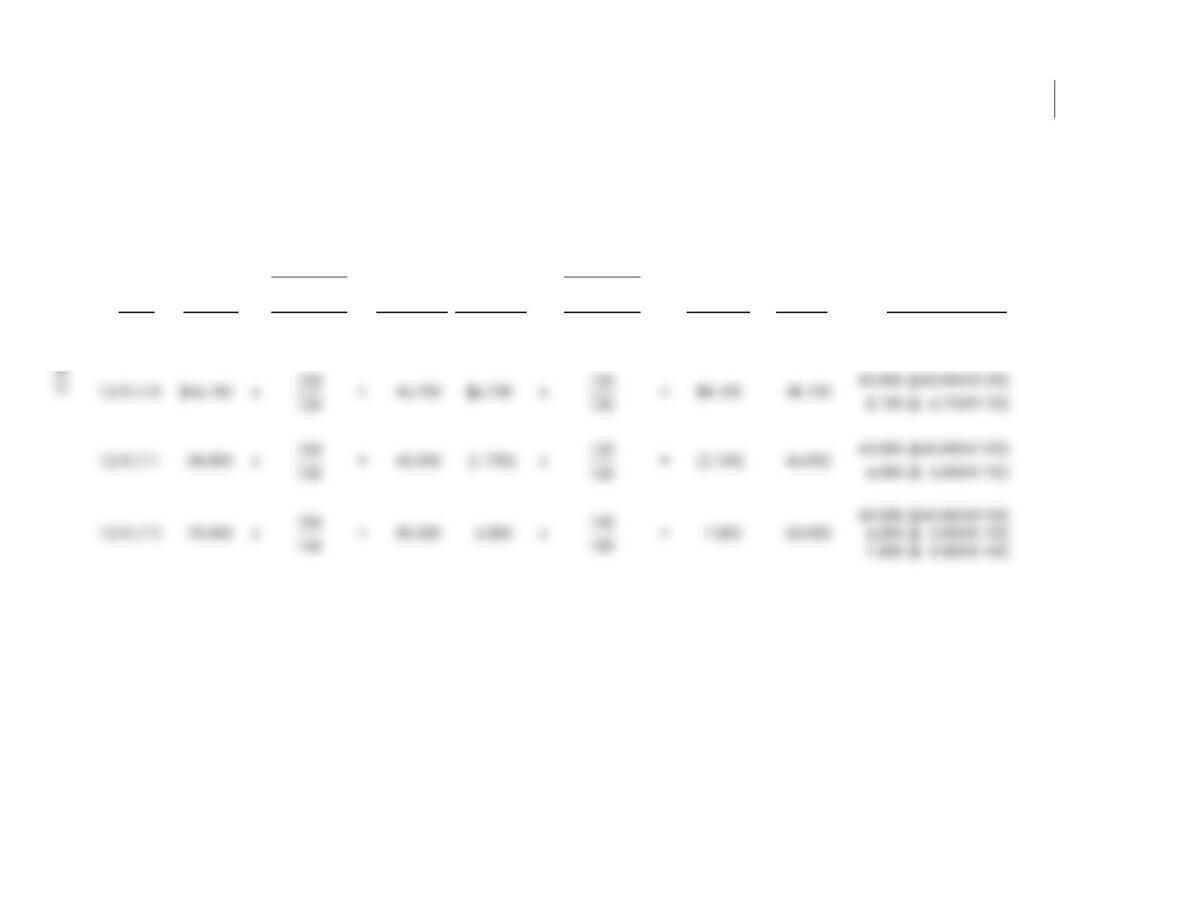
8-21
Date
Ending
Inventory
At
Current
Costs
x
Base Year
Cost Index
Current
Cost Index
=
Inventory
At
Base-Year
Costs
Increase
(Decrease)
at
Base-Year
Costs
x
Relevant
Cost Index
Base-Year
Cost Index
=
Increase
(Decrease)
at
Relevant
Current
Costs
Ending
Inventory
at
LIFO
Layers in LIFO
Ending Inventory
12/31/09 $40,000 — x
— =
— $40,000 $40,000
E8-12
8-21
7-22
E8-13 (AICPA adapted solution)
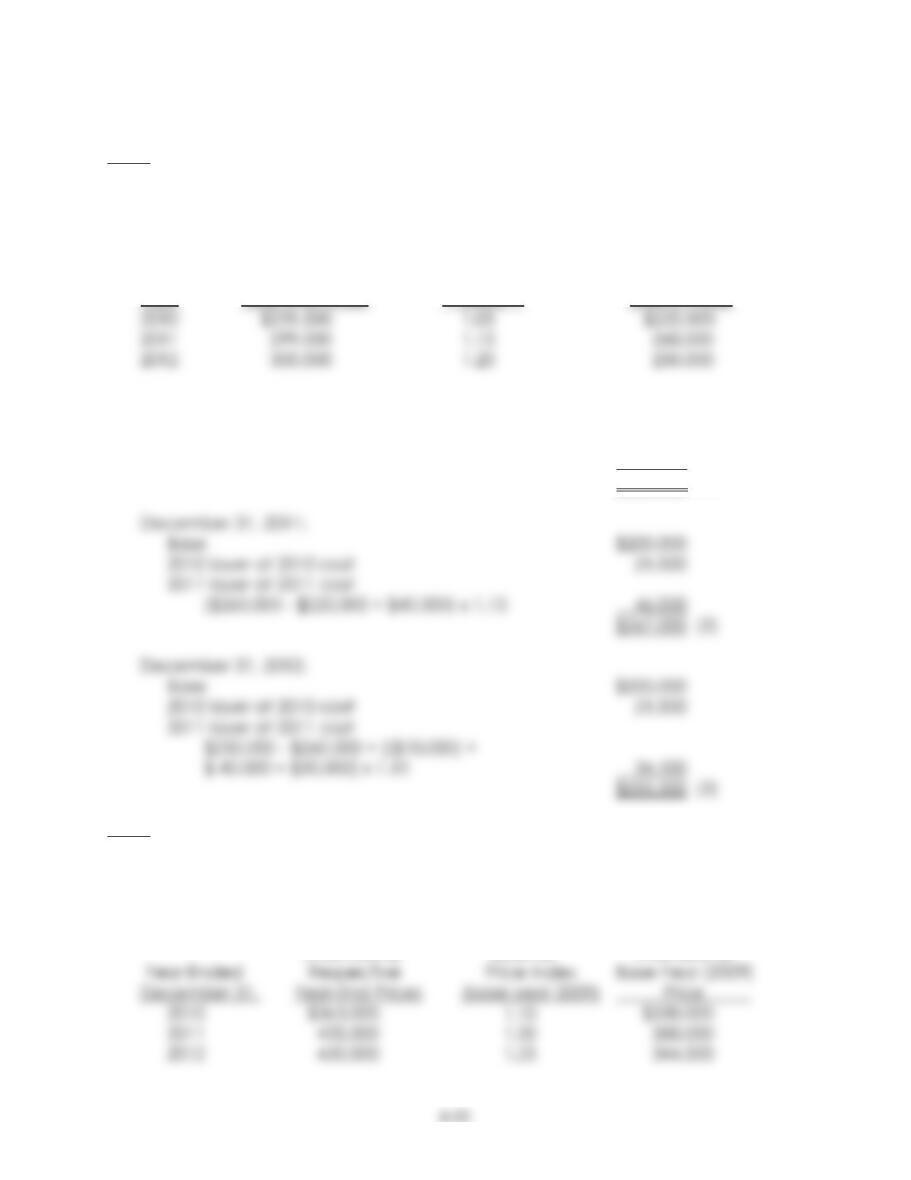
THE BELSTOCK COMPANY
Dollar-Value LIFO Computations
Inventory at Price Index Inventory at
Respective (Base Year Base-Year
Year Year-End Prices 2009) (2009) Prices
December 31, 2010:
Base $200,000
2010 layer at 2010 cost
($220,000 – $200,000 = $20,000) x 1.05 21,000
$221,000 (1)
E8-14 (AICPA adapted solution)
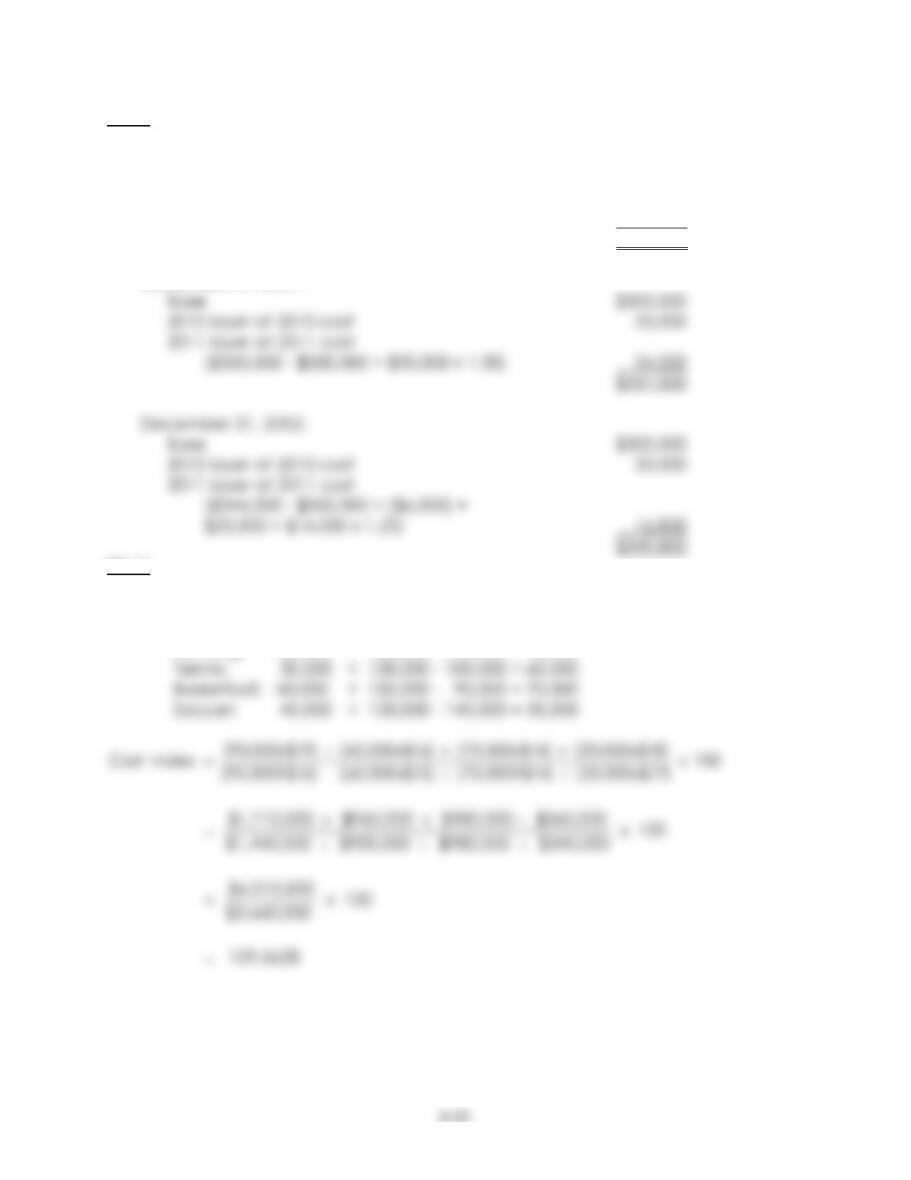
ACUTE COMPANY
Computation of Inventories Under the Dollar-Value
LIFO Inventory Method
Inventory at External Inventory at
E8-14 (continued)
December 31, 2010:
Base $300,000
2010 layer at 2010 cost
($330,000 – $300,000 = $30,000 x 1.10) 33,000
$333,000
December 31, 2011:
E8-15
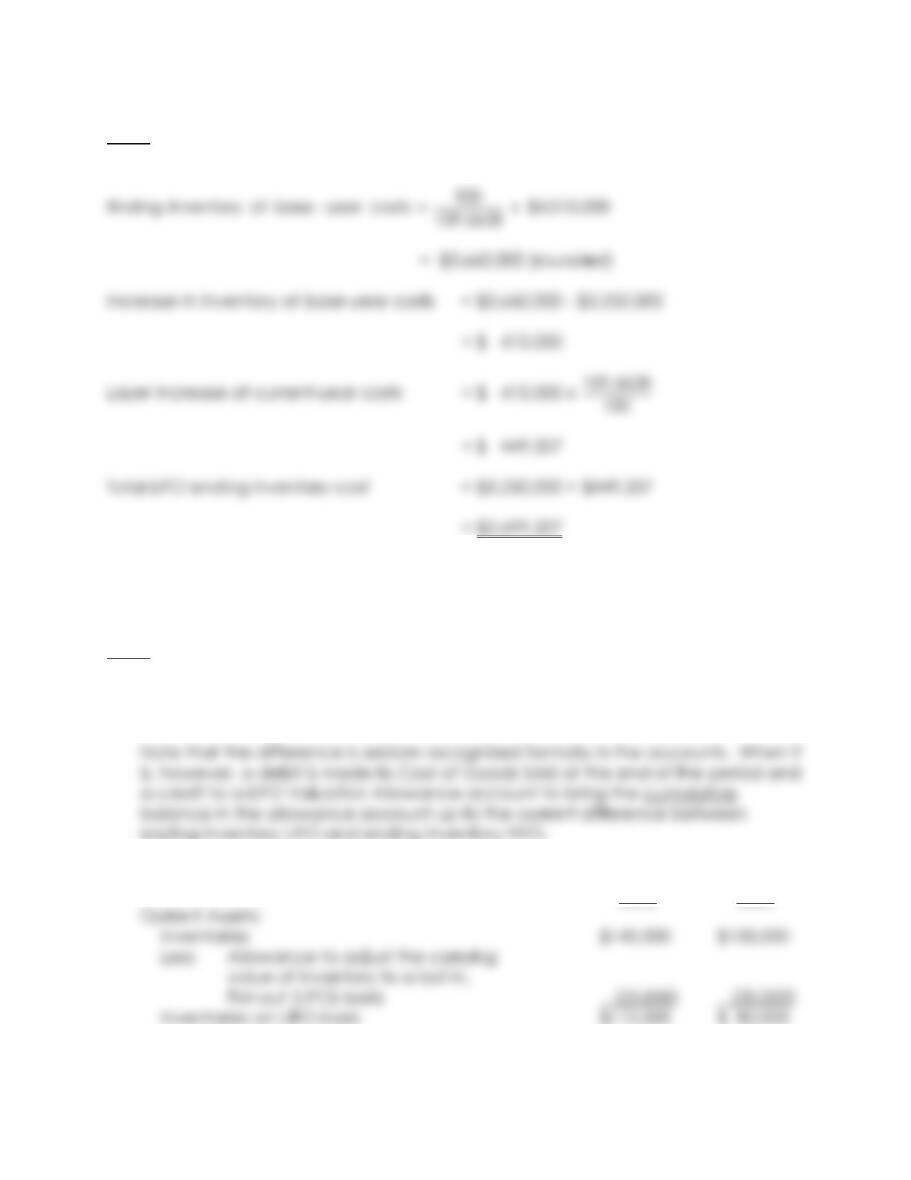
1. Ending inventory (in units):
Running: 80,000 + 150,000 – 140,000 = 90,000
8-24
E8-15 (continued)
1. (continued)
2. The use of one pool instead of four pools has prevented the company from
recognizing a LIFO liquidation profit on the soccer shoes of $20,000
[(140,000 – 120,000) x ($18 – $17)].
E8-16
1. 2010 Cost of Goods Sold 5,000
LIFO Valuation Allowance 5,000
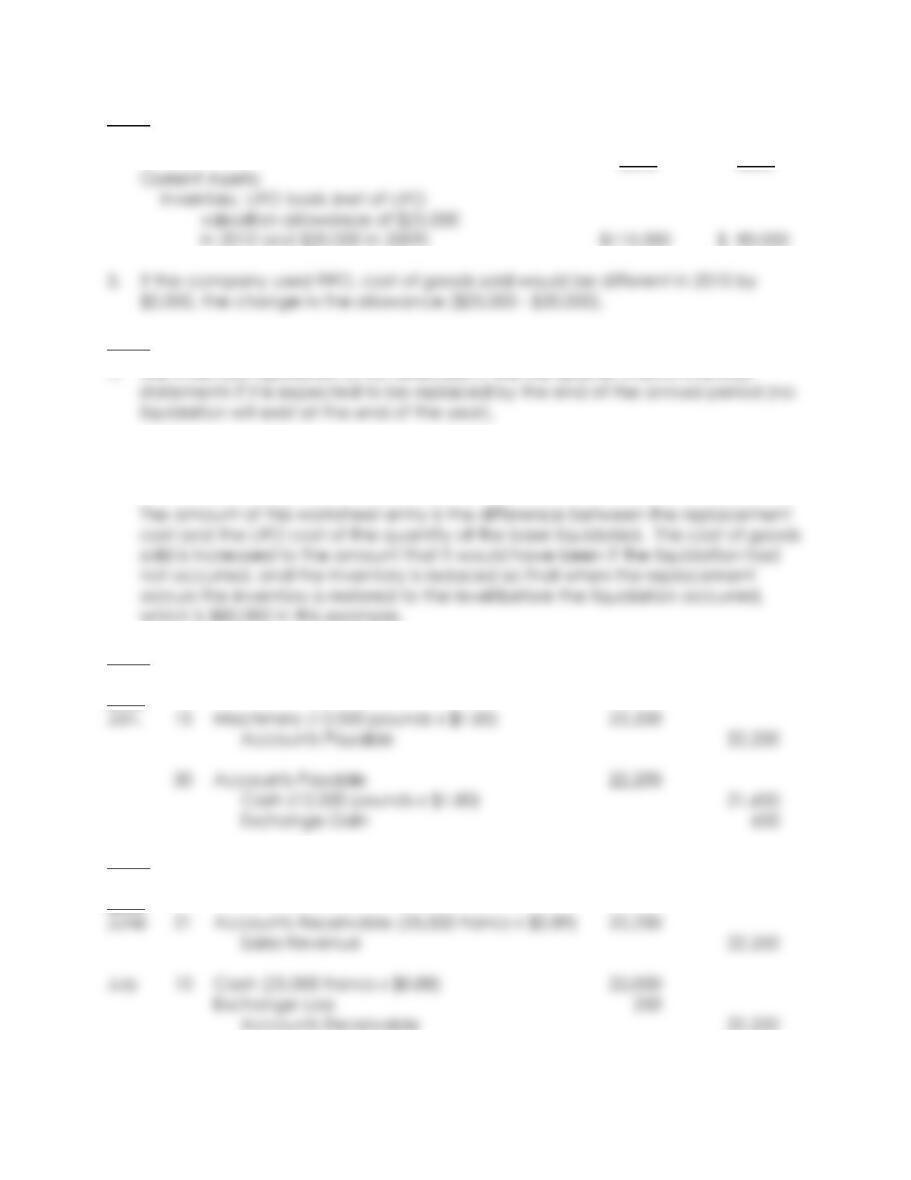
2. Comparative balance sheets
2010 2009
or
8-25
E8-16 (continued)
2. (continued)
2010 2009
E8-17
2. Cost of Goods Sold XXXX
Inventory XXXX
E8-18
2010
E8-19
2010
8-26
SOLUTIONS TO PROBLEMS
P8-1
1. The merchandise is included in inventory because it was owned by the Hayes
Company on December 31, 2010, when it was shipped F.O.B. supplier’s
warehouse (i.e., shipping point).
P8-2
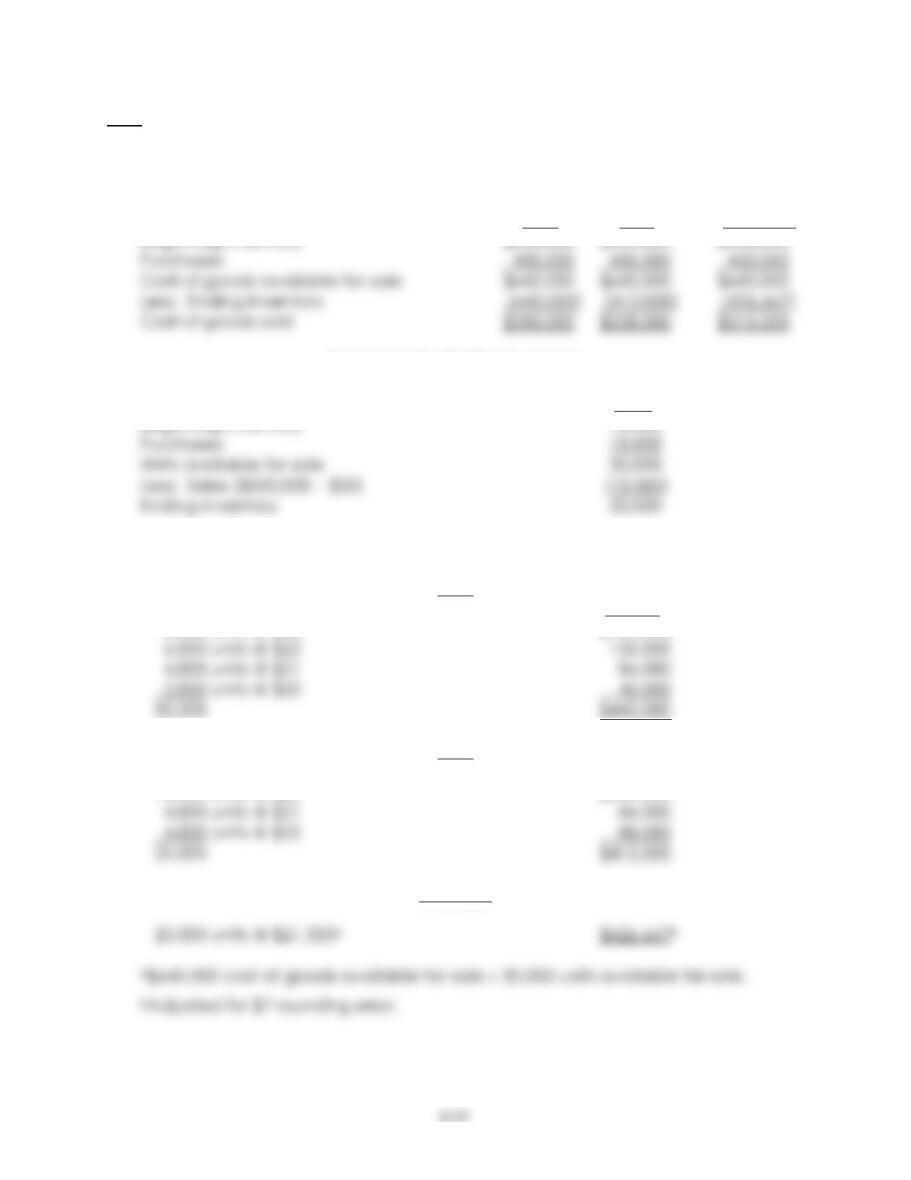
Ending inventory on hand (before adjustments) $87,450
1. Goods in transit (FOB shipping point) 3,700
P8-3
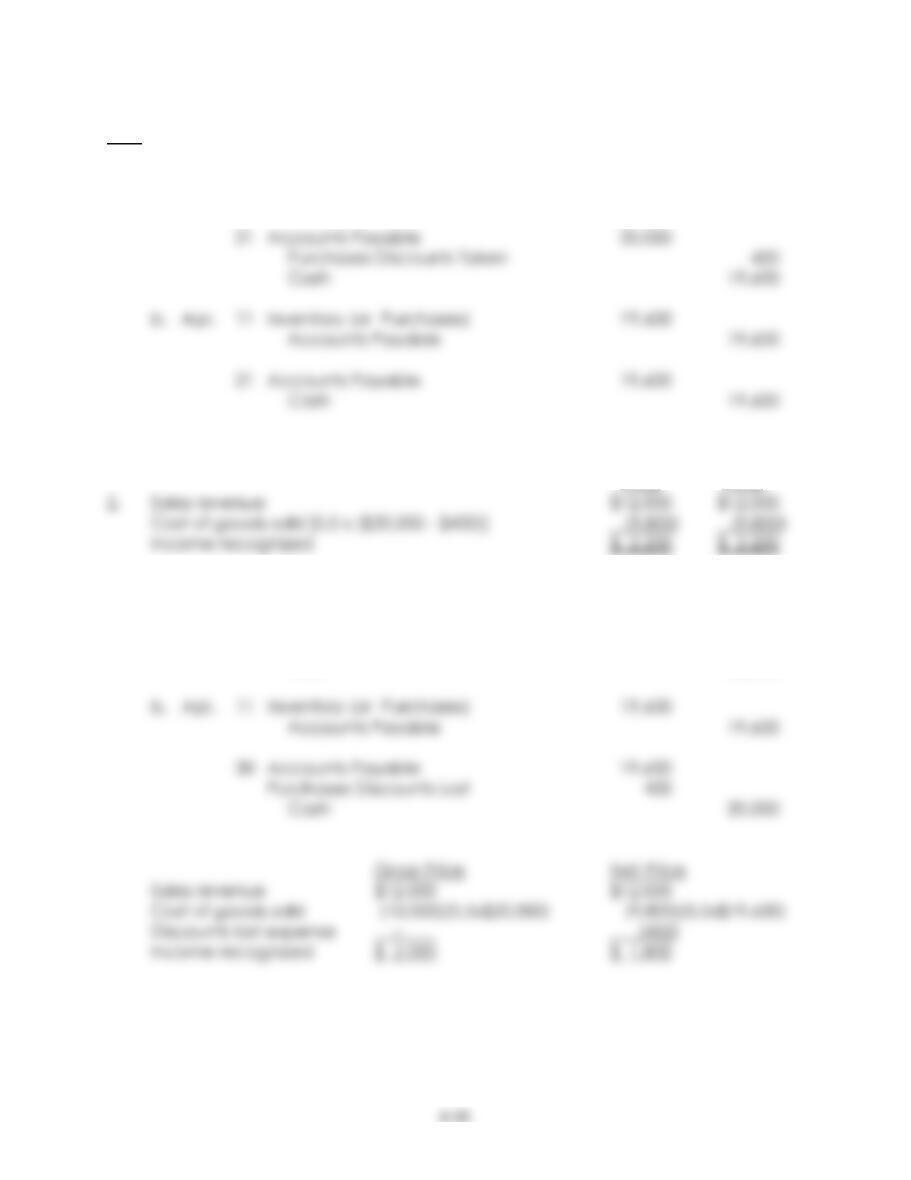
LEE COMPANY
Schedules of Cost of Goods Sold
For First Quarter Ended March 31
FIFO LIFO Average
Schedules for Ending Inventory
Units
The units are the same for all three alternatives.
FIFO
Dollars
8,000 units @ $23 $184,000
LIFO
12,000 units @ $20 $240,000
Average
P8-4
1. a. Apr. 11 Inventory (or Purchases) 20,000
Accounts Payable 20,000
Gross Net
Price Price
3. a. Apr. 11 Inventory (or Purchases) 20,000
Accounts Payable 20,000
30 Accounts Payable 20,000
Cash 20,000
P8-5
1. Computations
Units in Units in
Beginning Inventory + Purchases – Sales = Ending Inventory
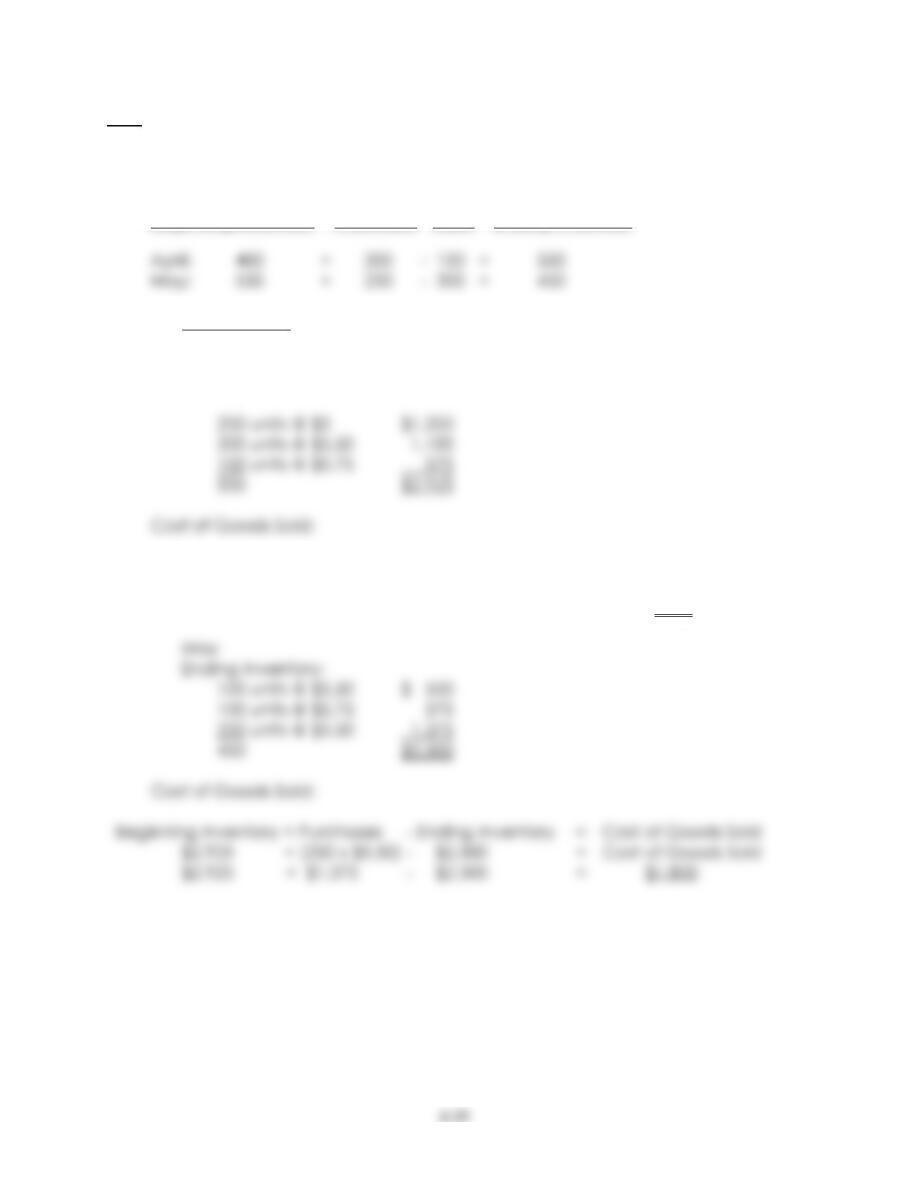
1. a. FIFO periodic:
April
Ending Inventory:
Beginning Inventory + Purchases – Ending Inventory = Cost of Goods Sold
(400 x $5) + (200 x $5.50 + 100 x $5.75) – $2,925 = Cost of Goods Sold
$2,000 + $1,675 – $2,925 = $750
8-30
P8-5 (continued)
1. (continued)
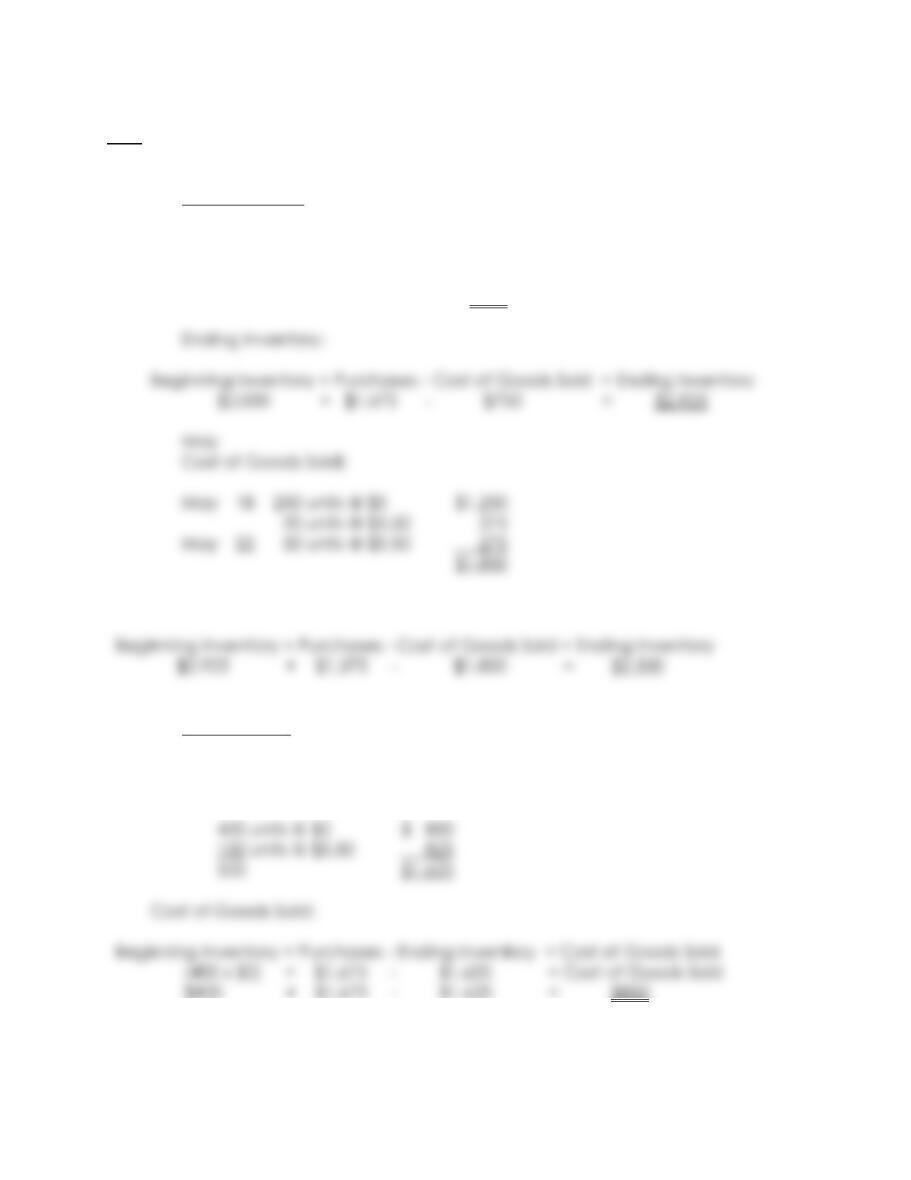
1. b. FIFO perpetual:
April
Cost of Goods Sold:
Apr 25 150 units @ $5 $750
Ending Inventory:
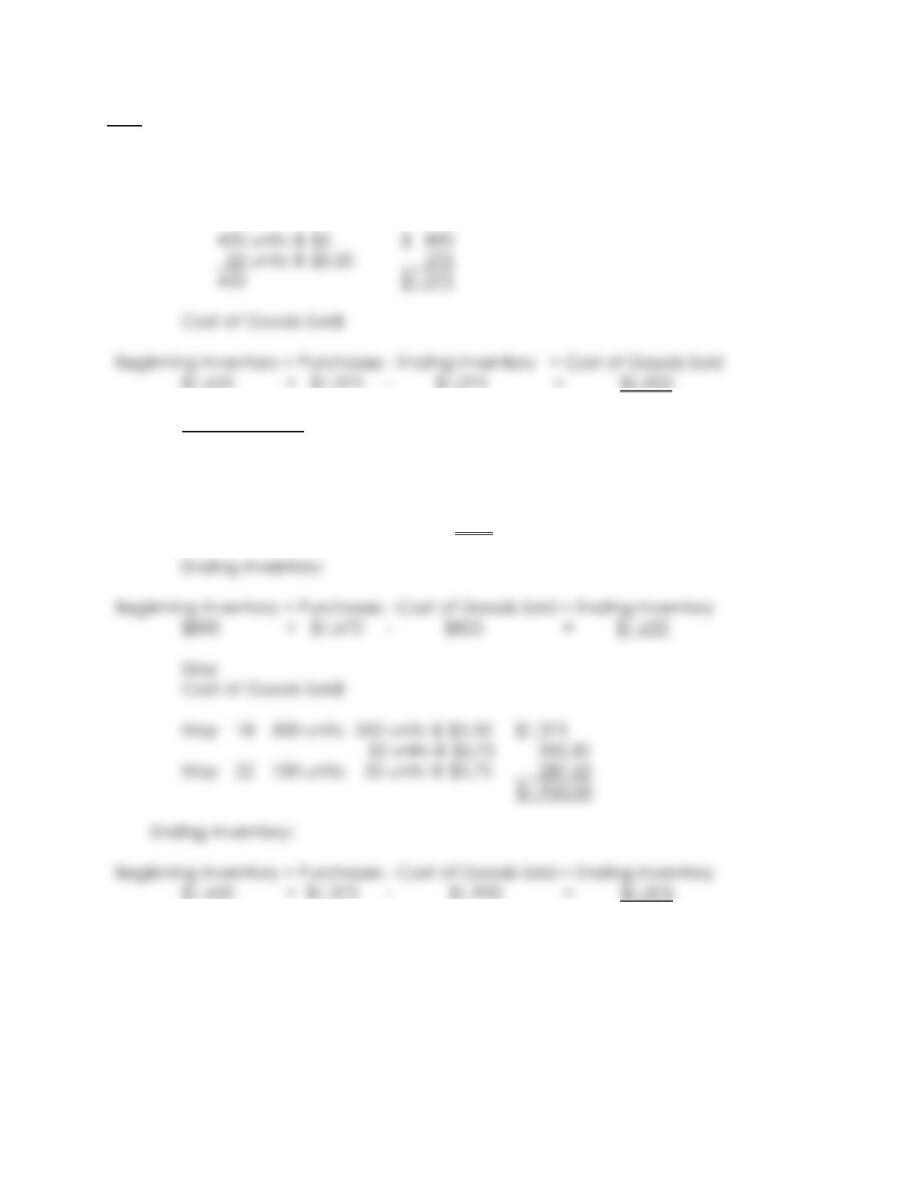
1. c. LIFO periodic:
April
Ending Inventory:
8-31
P8-5 (continued)
1. c. (continued)
May
Ending Inventory:
1. d. LIFO perpetual:
April
Cost of Goods Sold:
Apr. 25 150 units @ $5.50 $825
8-32
P8-5 (continued)
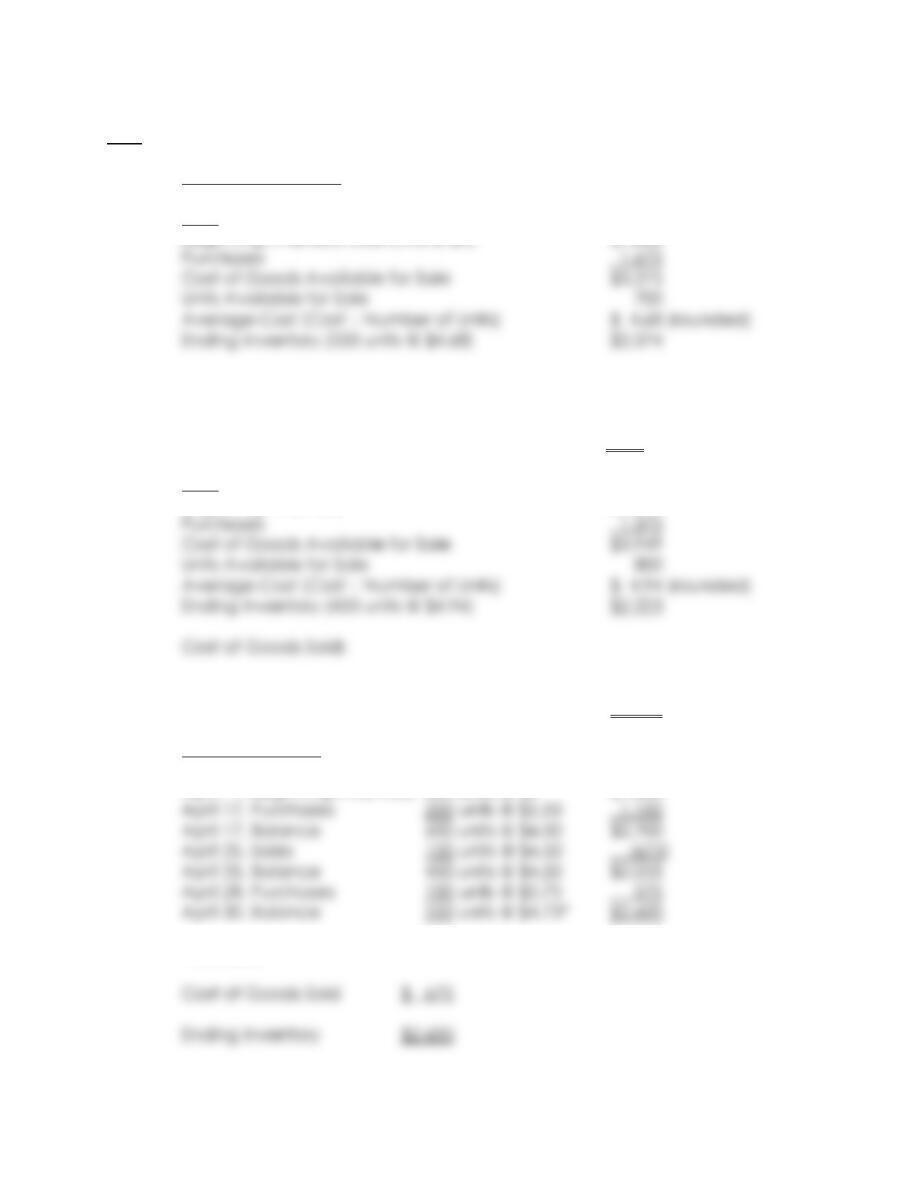
1. e. Weighted Average:
April
Beginning Inventory (400 units @ $4) $1,600
Cost of Goods Sold:
Beginning Inventory + Purchases – Ending Inventory = Cost of Goods Sold
$1,600 + $1,675 – $2,574 = $701
May
Beginning Inventory $2,574
Beginning Inventory + Purchases – Ending Inventory = Cost of Goods Sold
$2,574 + $1,375 – $2,223 = $1,726
1. f. Moving Average:
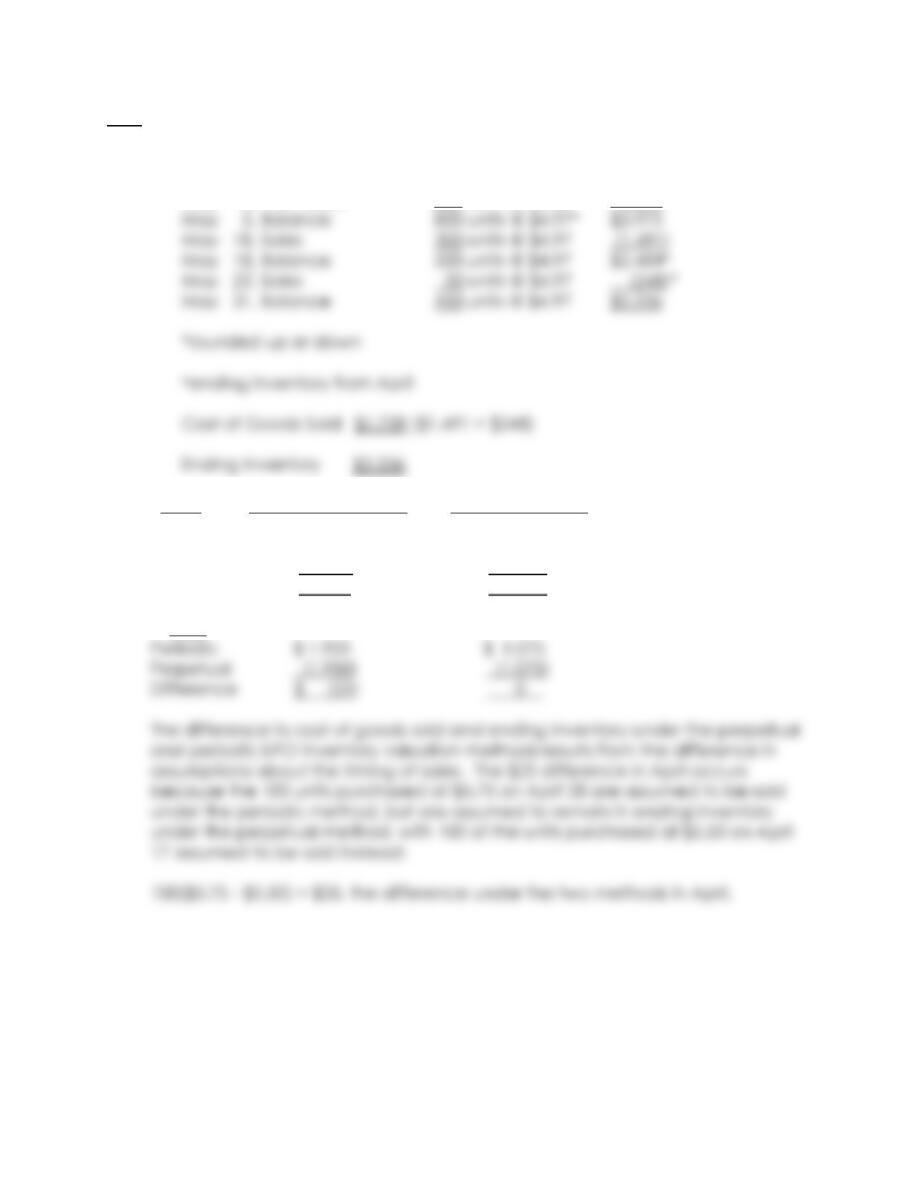
April 1, Beginning Inventory 400 units @ $4 $1,600
*rounded
8-33
P8-5 (continued)
1. f. (continued)
May 1, Beginning Inventory 550 units @ $4.73* $2,600#
May 5, Purchases 250 units @ $5.50 1,375
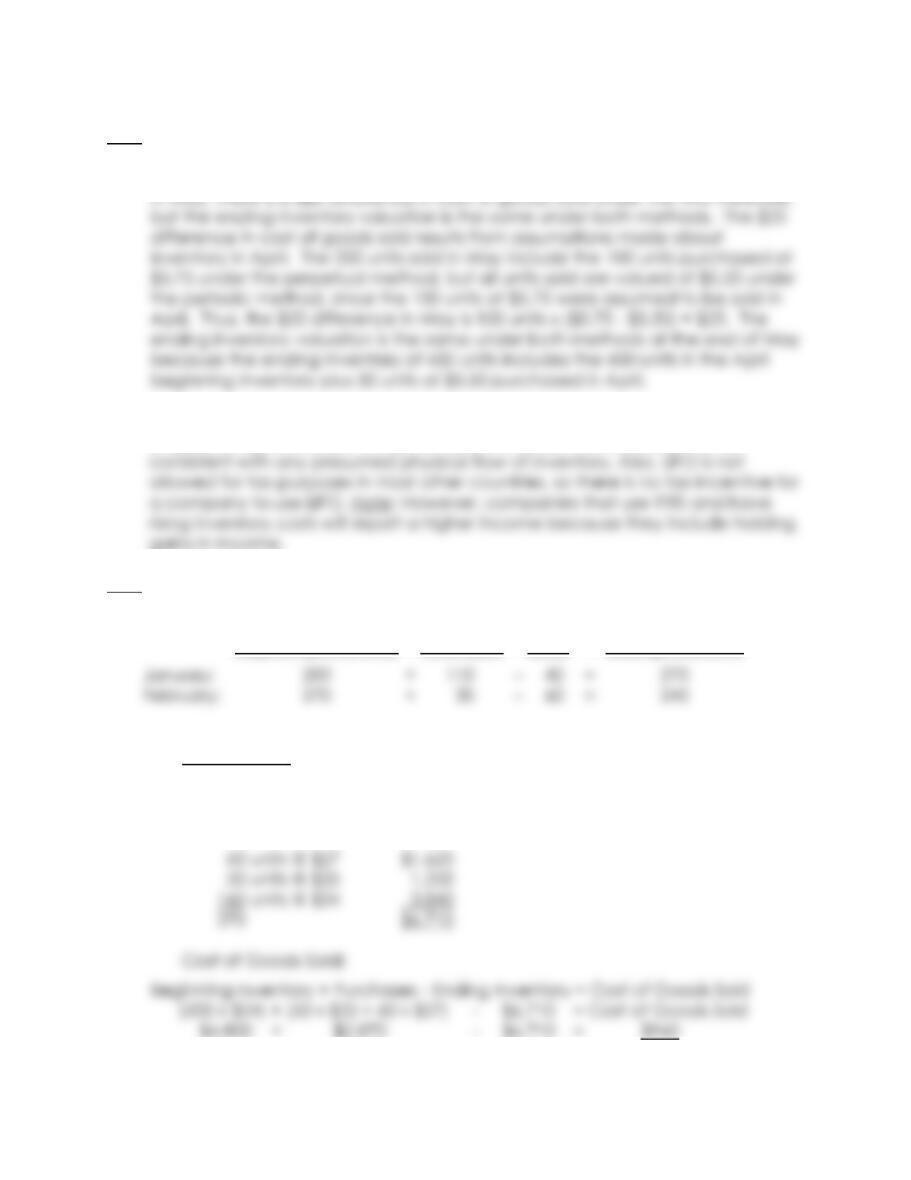
2. April Cost of Goods Sold Ending Inventory
Periodic $ 850 $ 1,625
Perpetual (825) (1,650)
Difference $ 25 $ (25)
May
8-34
P8-5 (continued)
2. (continued)
3. If Garrett Company uses IFRS, it may report its inventory under FIFO, average,
or specific identification. It may not use LIFO under IFRS because it is not
P8-6
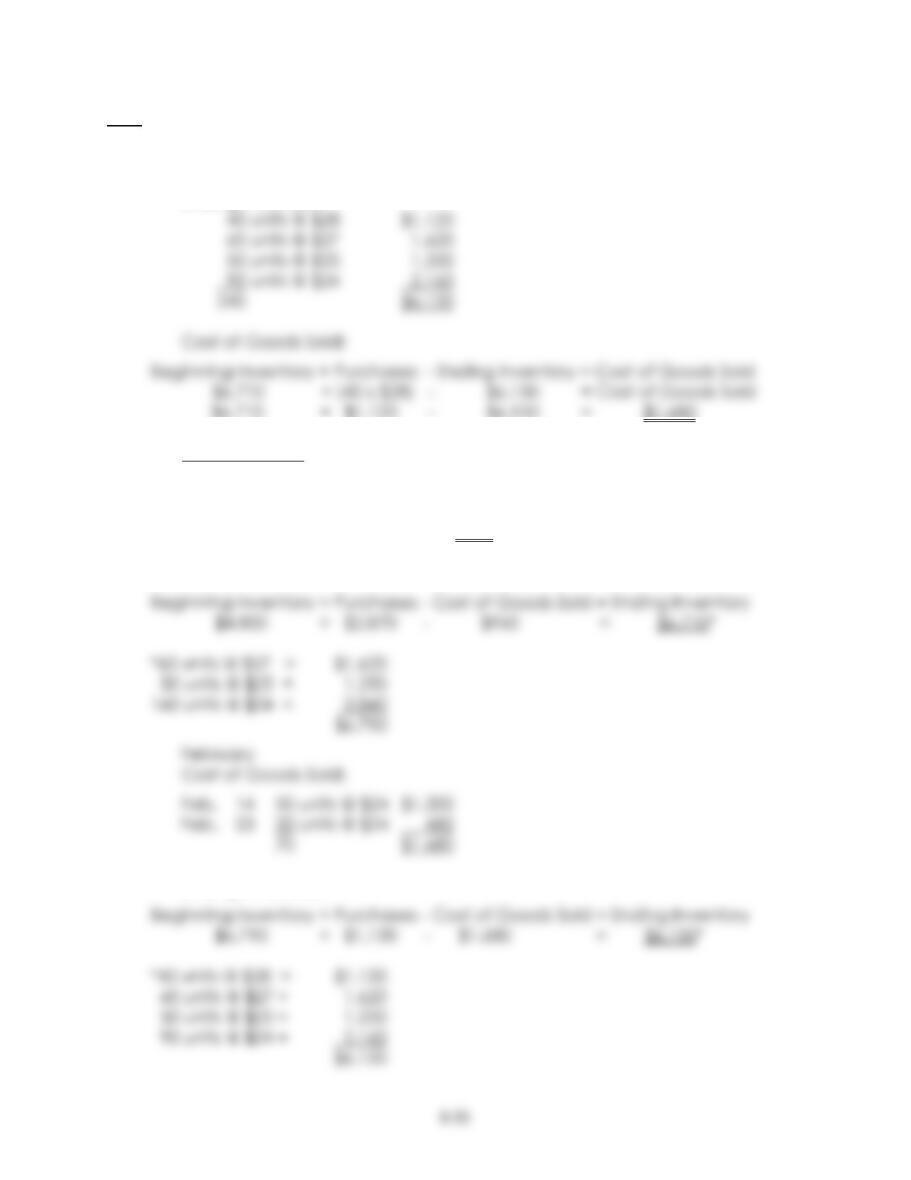
Units in
Beginning Inventory
+
Purchases
–
Sales
=
Units in
Ending Inventory
1. a. FIFO periodic:
January
Ending Inventory:
P8-6 (continued)
1.a. (continued)
February
Ending Inventory:
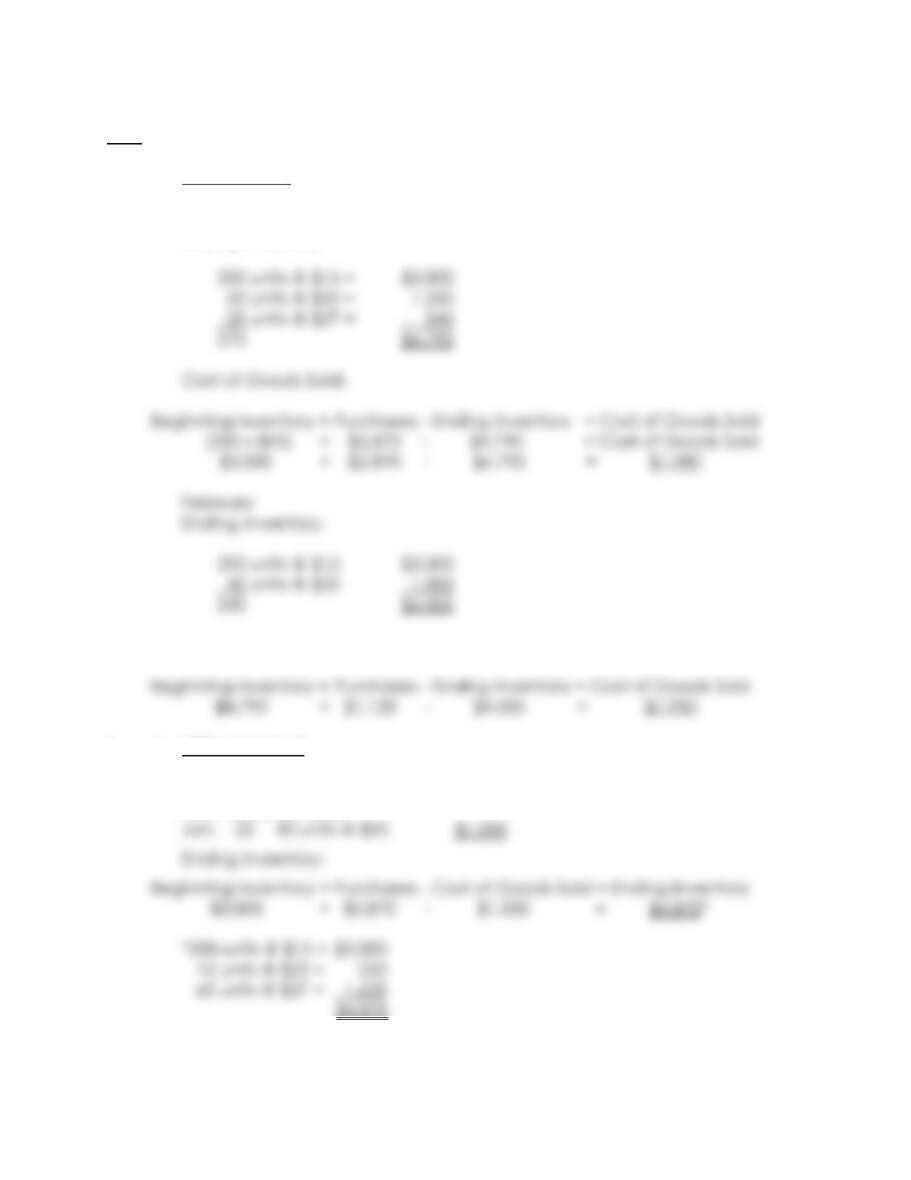
1. b. FIFO perpetual:
January
Cost of Goods Sold:
Jan. 22 40 units @ $24 $960
Ending Inventory:
Ending Inventory:
8-36
P8-6 (continued)
1. c. LIFO periodic:
January
Ending Inventory:
Cost of Goods Sold:
1. d. LIFO perpetual:
January
Cost of Goods Sold:
8-37
P8-6 (continued)
1. d. (continued)
February
Cost of Goods Sold:
1. e. Weighted Average:
January
Beginning Inventory (200 units @ $23) $4,600
Purchases 2,870
8-38
P8-6 (continued)
1. e. (continued)
Cost of Goods Sold:
1. f. Moving Average:
January 01, Beginning Inventory 200 units @ $23 $4,600
January 10, Purchases 50 units @ $25 1,250
January 10, Balance 250 units @ $23.40 $5,850
January 22, Sales 40 units @ $23.40 (936)
January 22, Balance 210 units @ $23.40 $4,914
January 28, Purchases 60 units @ $27 1,620
January 31, Balance 270 units @ $24.20 $6,534
8-39
P8-6 (continued)
2. January Cost of Goods Sold Ending Inventory
Periodic $ 1,080 $ 4,790
Perpetual (1,000) (4,870)
Difference $ 80 $ (80)
The differences for February may be illustrated as follows:
Periodic
Purchase dates 1/1 1/10 1/28 2/4
8-40
P8-6 (continued)
2. (continued)
Thus the difference in the cost of goods sold in February is the 10 units that are
assumed to be sold on February 23 from the January 28 purchase under the
3. If the company had purchased an additional 25 units for $30 each ($750),
purchases in February would be higher by $750 and the calculations would be
as follows:
FIFO periodic:
Ending Inventory: