Solution
Solution
1. Each month, usually on the first Friday of the month, the Bureau of Labor Statistics
releases the Employment Situation Summary for the previous month. Go to www.bls.
gov and find the latest report. On the Bureau of Labor Statistics home page, at the
2. In general, how do changes in the unemployment rate vary with changes in real
GDP? After several quarters of a severe recession, explain why we might observe a
decrease in the official unemployment rate. Explain why we could see an increase in
the official unemployment rate after several quarters of a strong expansion.
2. In general, the change in the unemployment rate varies inversely with the rate of growth
in real GDP: when the rate of real GDP growth is above average, we expect the unem-
3. In each of the following situations, what type of unemployment is Melanie facing?
a. After completing a complex programming project, Melanie is laid off. Her pros-
pects for a new job requiring similar skills are good, and she has signed up with a
3. a. Melanie is frictionally unemployed because she is refusing offers for low-paying
jobs in favor of engaging in a job search for a higher-paying job.
Unemployment and Inflation
8
CHAPTER
S-114 CHAPTER 8 UNEMPLOYMENT AND INFLATION
Solution
4. Part of the information released in the Employment Situation Summary concerns
how long individuals have been unemployed. Go to www.bls.gov to find the latest
report. Use the same technique as in Problem 1 to find the Employment Situation
Summary. Near the end of the Employment Situation, click on table A-12, titled
“Unemployed persons by duration of unemployment.” Use the seasonally adjusted
numbers to answer the following questions.
a. How many workers were unemployed less than 5 weeks? What percentage of all
unemployed workers do these workers represent? How do these numbers compare
4. Answers will vary depending on when you look up the information.
a. In July 2014, 2,587,000 workers had been unemployed less than 5 weeks, repre-
senting 27.0% of all unemployed workers. This was an increase from June 2014,
when 2,410,000 workers had been unemployed less than 5 weeks, representing
bers for July 2014 were slightly better than for June 2014.
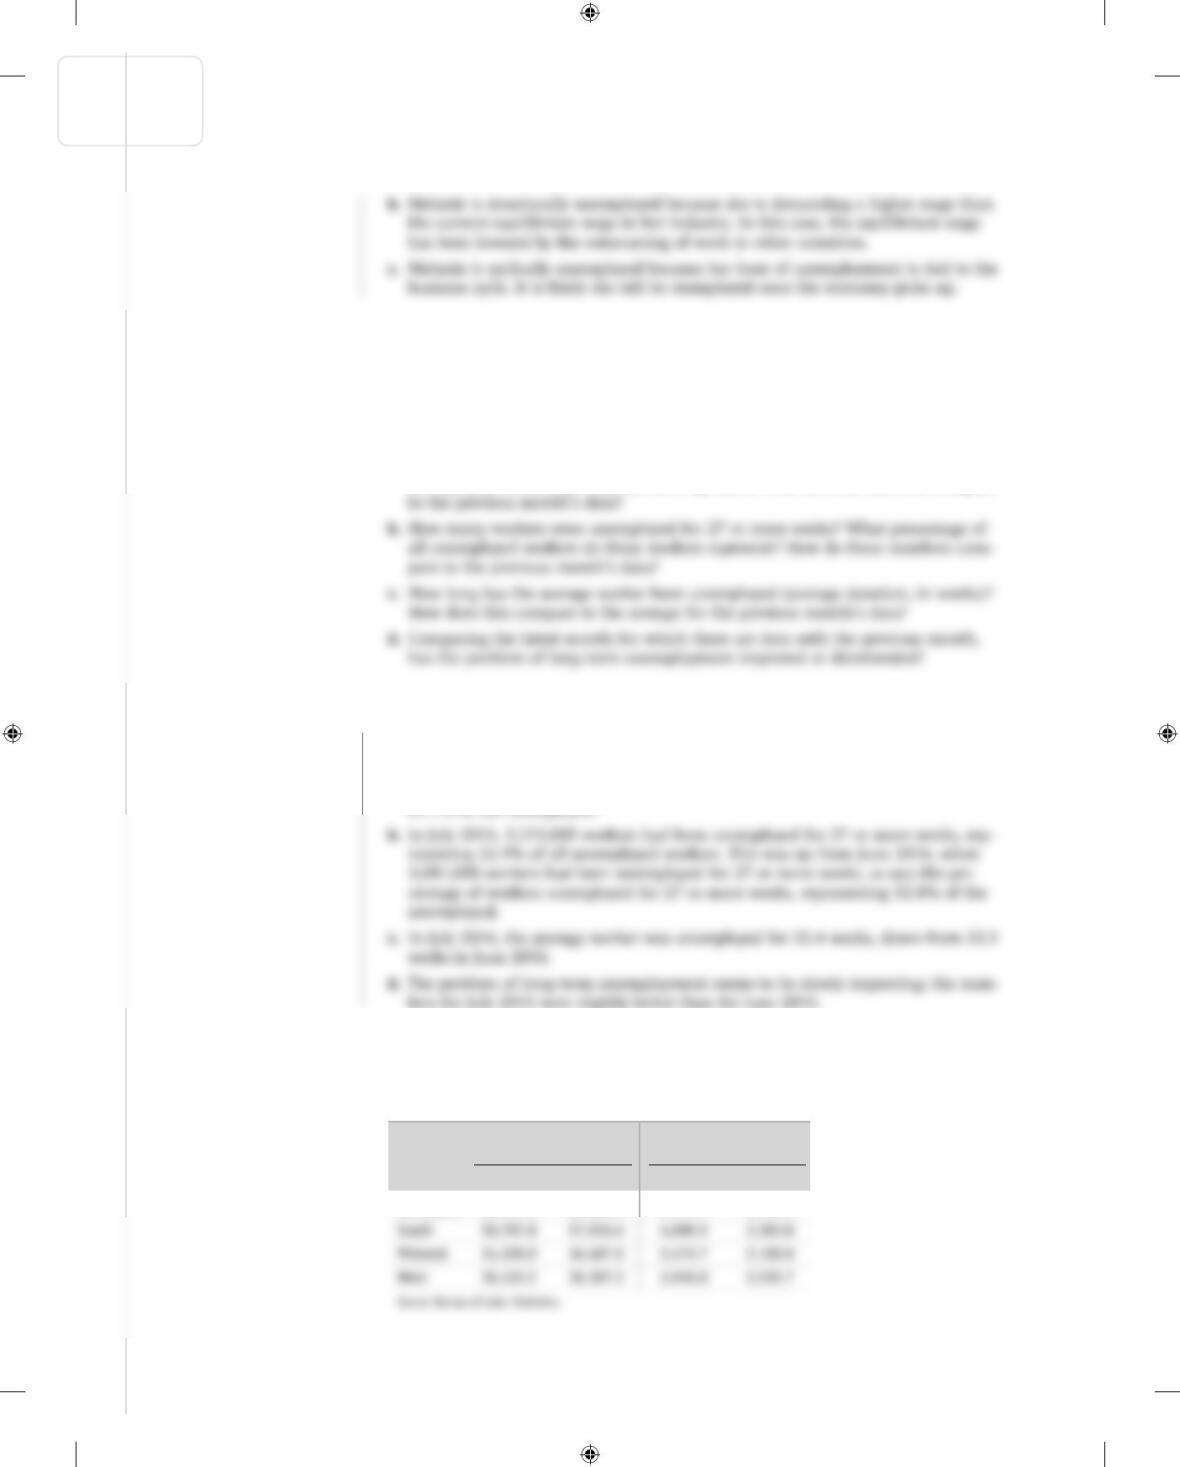
5. A country’s labor force is the sum of the number of employed and unemployed work–
ers. The accompanying table provides data on the size of the labor force and the
number of unemployed workers for different regions of the United States.
Region
Labor force
(thousands)
Unemployed
(thousands)
April 2013 April 2014 April 2013 April 2014
Northeast 28,407.2 28,288.9 2,174.4 1,781.3
KrugWellsECPS4e_Macro_CH08.indd S-114KrugWellsECPS4e_Macro_CH08.indd S-114 1/26/15 10:13 AM1/26/15 10:13 AM
CHAPTER 8 UNEMPLOYMENT AND INFLATION S-115
Solution
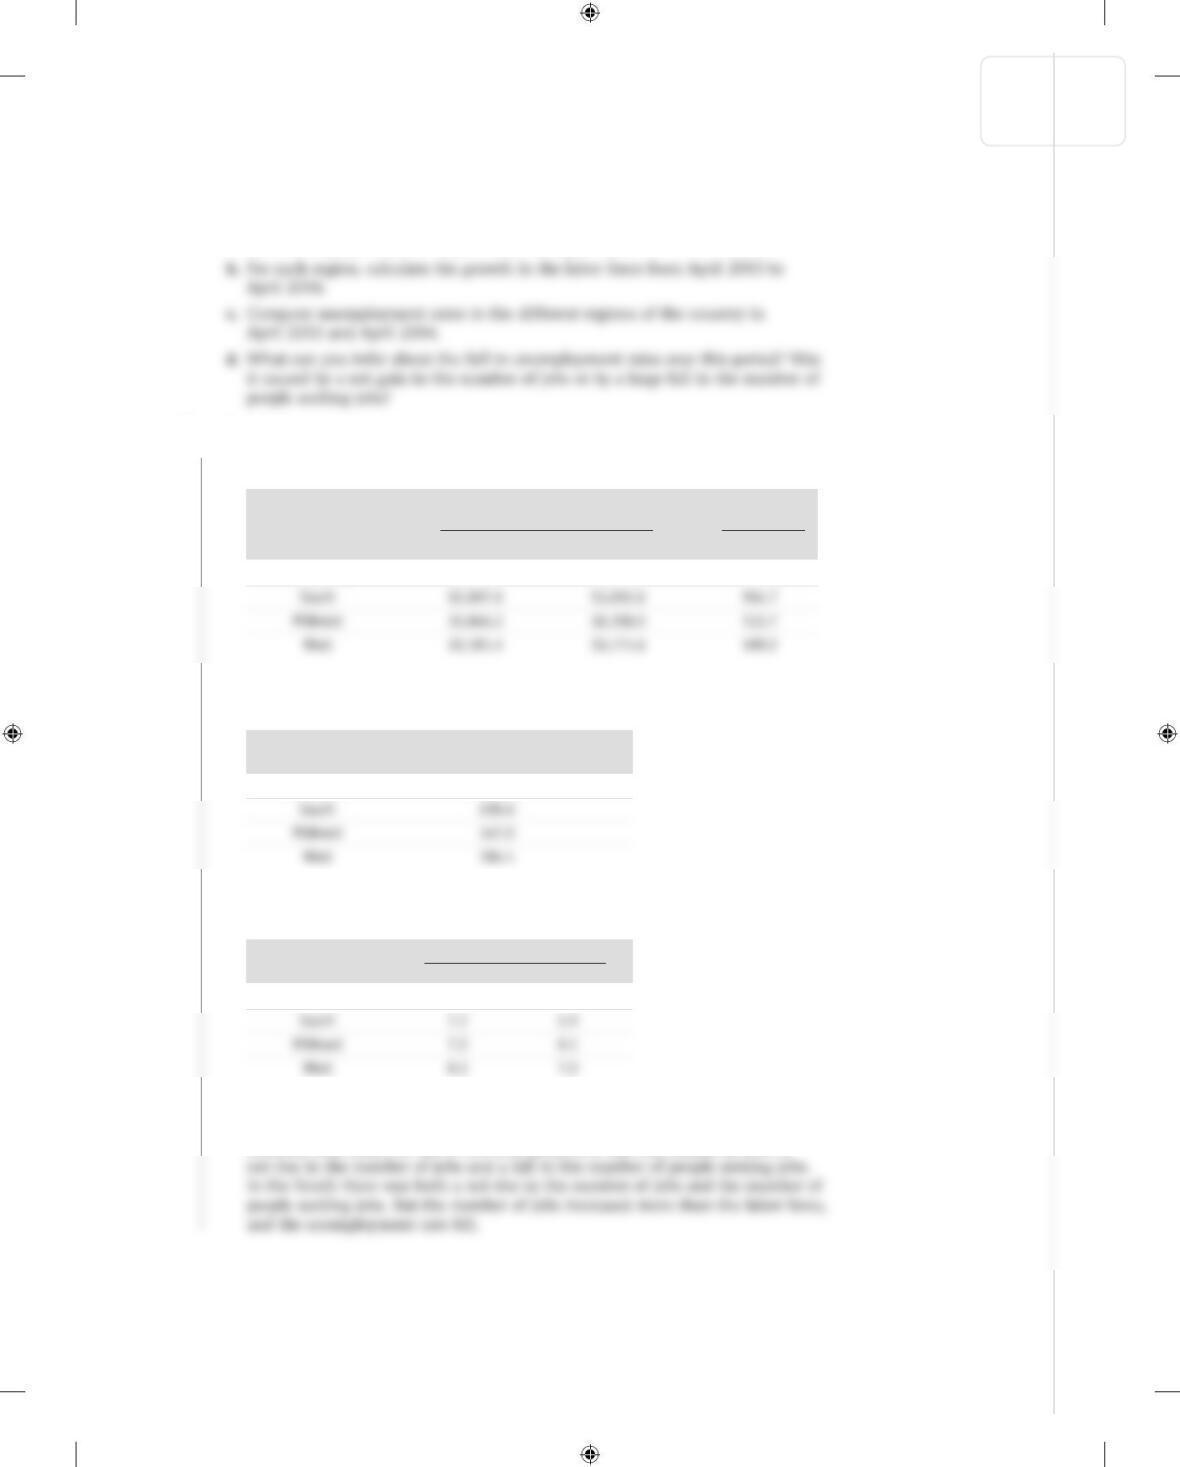
a. Calculate the number of workers employed in each of the regions in April 2013
and April 2014. Use your answers to calculate the change in the total number of
workers employed between April 2013 and April 2014.
5. a. The number of employed people equals the size of the labor force minus the num-
ber of unemployed people, as shown in the accompanying table.
b. The accompanying table shows the change in the size of the labor force during the
period April 2013 to April 2014.
c. The unemployment rate is calculated as (Number of unemployed workers/
labor force) × 100, as shown in the accompanying table.
d. In the Northeast the fall in the unemployment rate was caused by a rise in
the number of people with jobs and a decline in the labor force. In the South,
midwest, and west, the fall in the unemployment rate was caused by both a
Unemployment rate
Region April 2013 April 2014
Northeast 7.7% 6.3%
Growth in the labor force
Region (thousands)
Northeast −118.3
Employed Change
(thousands) (thousands)
Region April 2013 April 2014
Northeast 26,232.8 26,507.6 274.8
KrugWellsECPS4e_Macro_CH08.indd S-115KrugWellsECPS4e_Macro_CH08.indd S-115 1/26/15 10:13 AM1/26/15 10:13 AM
S-116 CHAPTER 8 UNEMPLOYMENT AND INFLATION
Solution
Solution
6. In which of the following cases is it more likely for efficiency wages to exist? Why?
a. Jane and her boss work as a team selling ice cream.
6. a. If Jane and her boss work as a team selling ice cream, Jane will want her boss to
see her doing a good job. The boss knows that the quality of her work will be high
without an efficiency wage because he is there to observe her.
7. How will the following changes affect the natural rate of unemployment?
a. The government reduces the time during which an unemployed worker can receive
7. a. If the government reduces the time during which an unemployed worker can
obtain benefits, workers will be less willing to spend time searching for a job. This
will reduce the amount of frictional unemployment and lower the natural rate of
unemployment.
8. With its tradition of a job for life for most citizens, Japan once had a much lower
unemployment rate than that of the United States; from 1960 to 1995, the unem-
ployment rate in Japan exceeded 3% only once. However, since the crash of its stock
KrugWellsECPS4e_Macro_CH08.indd S-116KrugWellsECPS4e_Macro_CH08.indd S-116 1/26/15 10:13 AM1/26/15 10:13 AM
CHAPTER 8 UNEMPLOYMENT AND INFLATION S-117
Solution
rate. Is the likely cause of the change in the unemployment rate during this period
a change in the natural rate of unemployment or a change in the cyclical unem-
ployment rate?
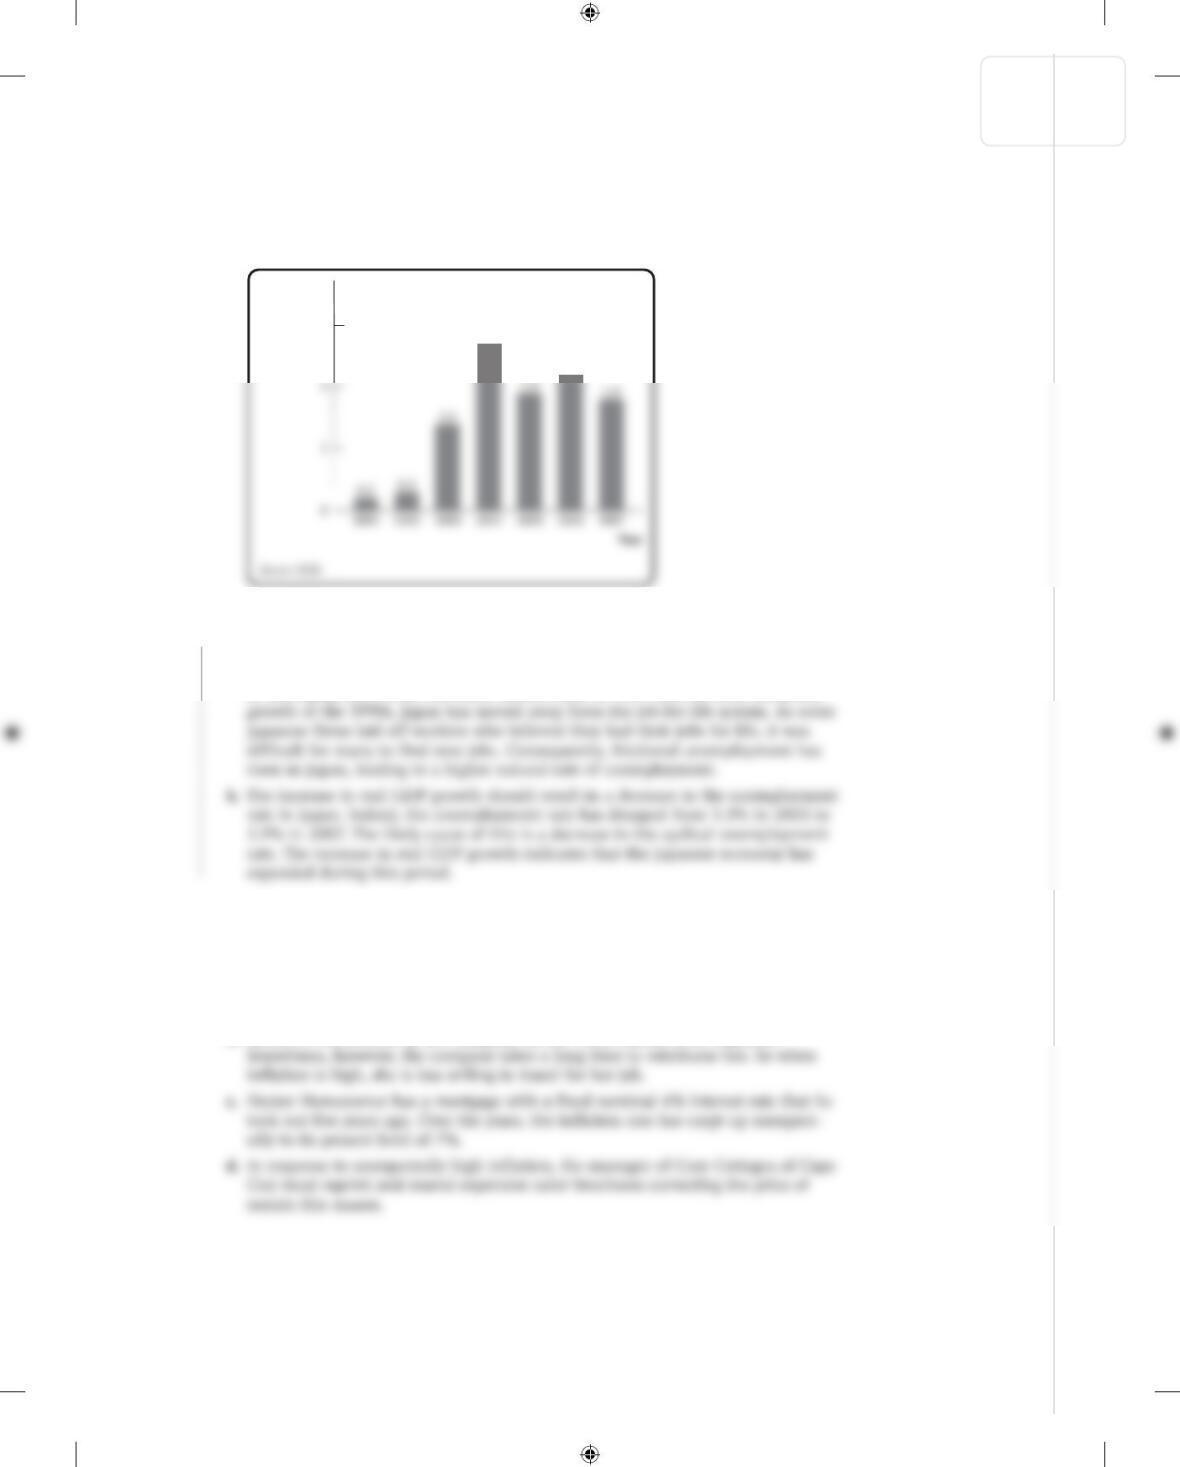
3%
Real GDP
growth rate
2.7
2.2
8. a. The job – for – life system of employment in Japan led to a very low level of frictional
unemployment. The only search for jobs occurred when workers first joined the
labor force. The low level of frictional unemployment led to a low natural rate
of unemployment. Since the stock market crash of 1989 and the slow economic
9. In the following examples, is inflation creating winners and losers at no net cost
to the economy or is inflation imposing a net cost on the economy? If a net cost is
being imposed, which type of cost is involved?
a. When inflation is expected to be high, workers get paid more frequently and make
more trips to the bank.
b. Lanwei is reimbursed by her company for her work – related travel expenses.
KrugWellsECPS4e_Macro_CH08.indd S-117KrugWellsECPS4e_Macro_CH08.indd S-117 1/26/15 10:13 AM1/26/15 10:13 AM
S-118 CHAPTER 8 UNEMPLOYMENT AND INFLATION
Solution
9. a. This is an example of the effect of shoe – leather costs, a net cost of inflation to the
economy. Workers spend valuable resources going to the bank more frequently,
firms spend valuable resources (such as bookkeepers’ time) in paying workers
more frequently, and banks spend more resources in processing the greater volume
of transactions.
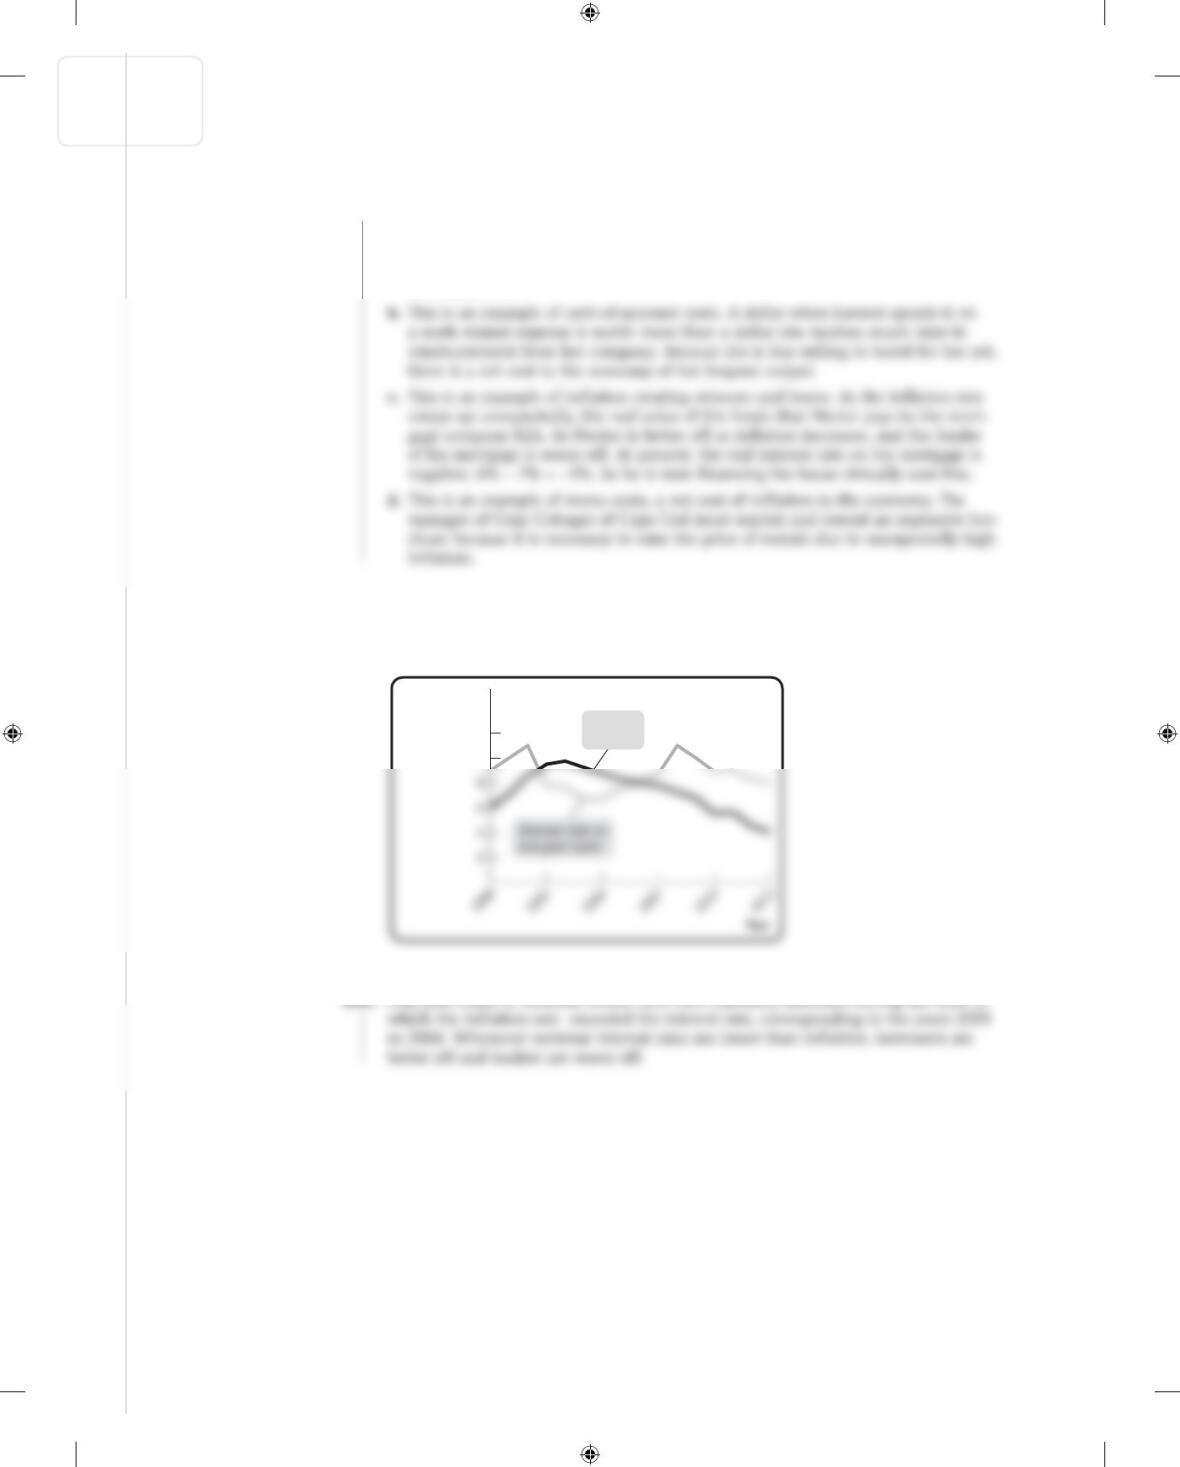
10. The accompanying diagram shows the interest rate on one-year loans and inflation
during 1998–2013 in the economy of Albernia. When would one-year loans have
been especially attractive and why?
Inflation rate,
interest rate
12%
10
Inflation
rate
KrugWellsECPS4e_Macro_CH08.indd S-118KrugWellsECPS4e_Macro_CH08.indd S-118 1/26/15 10:13 AM1/26/15 10:13 AM
CHAPTER 8 UNEMPLOYMENT AND INFLATION S-119
Solution
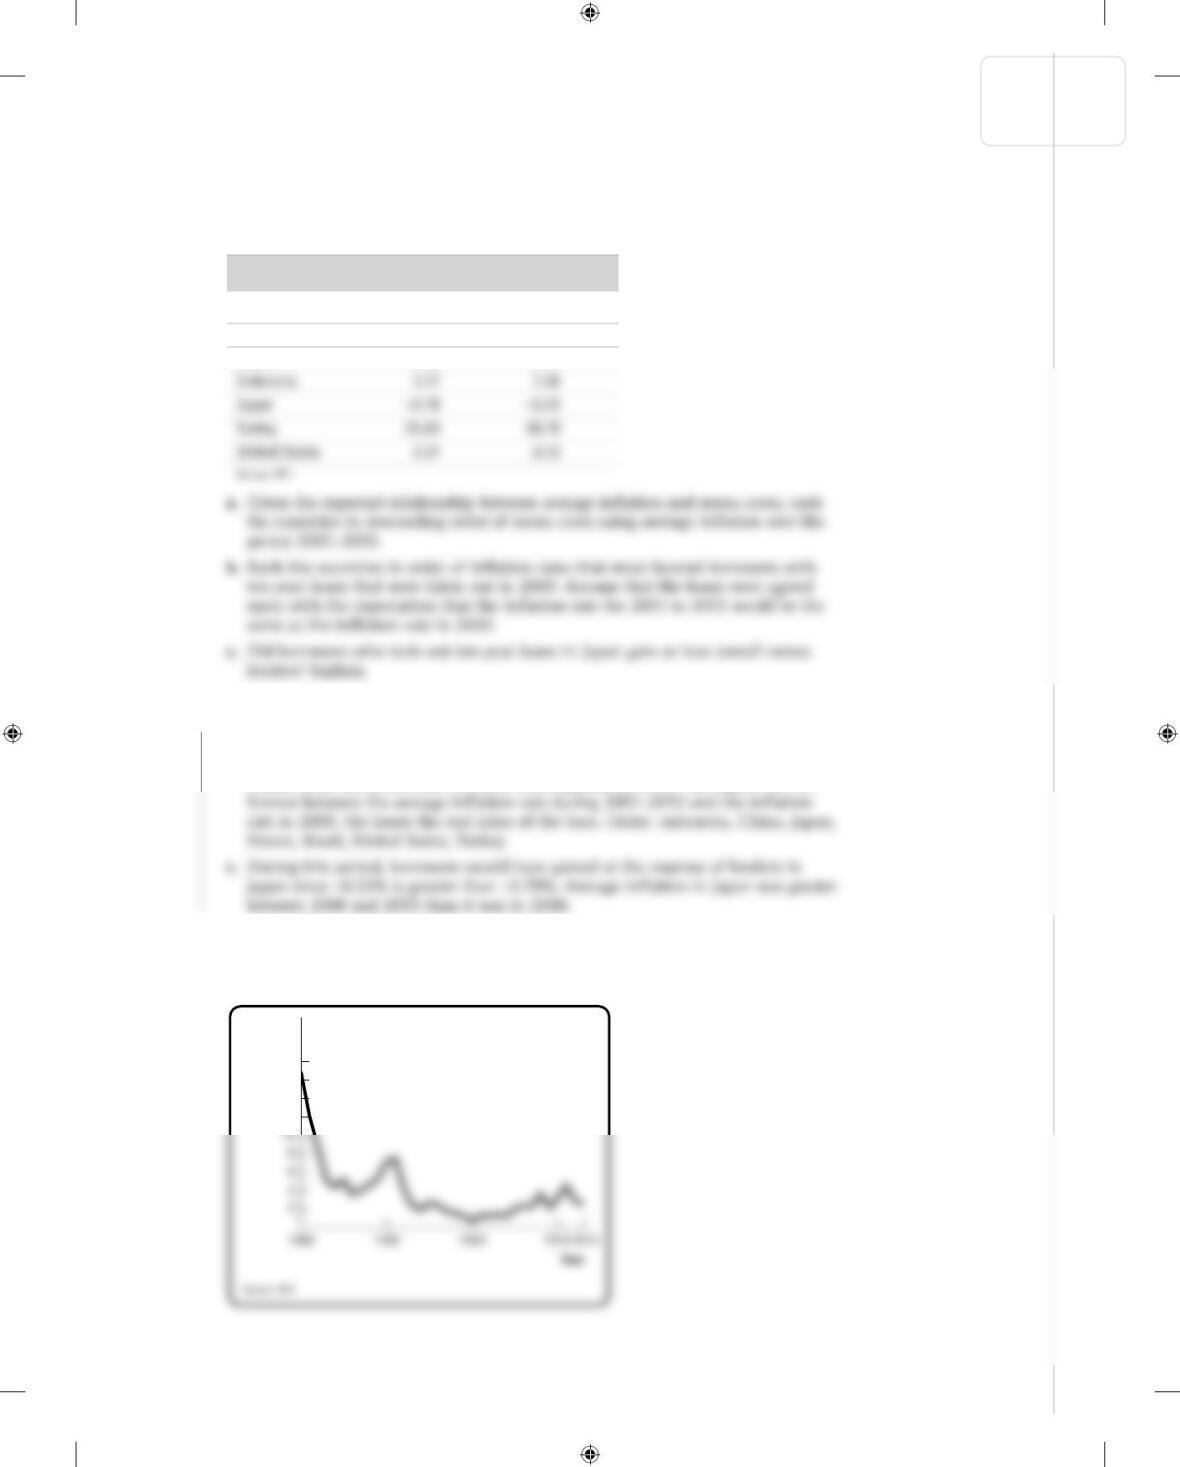
11. The accompanying table provides the inflation rate in the year 2000 and the average
inflation rate over the period 2001–2013 for seven different countries.
11. a. The countries with the highest average inflation rates should have the highest menu
costs. Order: Turkey, Indonesia, Brazil, United States, China, France, Japan.
b. The countries with an average inflation rate higher than the inflation rate in 2000
should favor borrowers with ten-year loans payable in 2013. The higher the dif-
12. The accompanying diagram shows the inflation rate in the United Kingdom from
1980 to 2013.
Inflation
rate
12
18%
14
16
Inflation rate Average inflation
Country in 2000 rate in 2001–2013
Brazil 7.06% 6.72%
China 0.40 2.34
France 1.83 1.86
KrugWellsECPS4e_Macro_CH08.indd S-119KrugWellsECPS4e_Macro_CH08.indd S-119 1/26/15 10:13 AM1/26/15 10:13 AM
S-120 CHAPTER 8 UNEMPLOYMENT AND INFLATION
Solution
a. Between 1980 and 1985, policy makers in the United Kingdom worked to lower
the inflation rate. What would you predict happened to unemployment between
1980 and 1985?
12. a. Because of the disinflation that occurred between 1980 and 1985, one would pre-
dict that the unemployment rate rose during this period. Indeed, the unemploy-
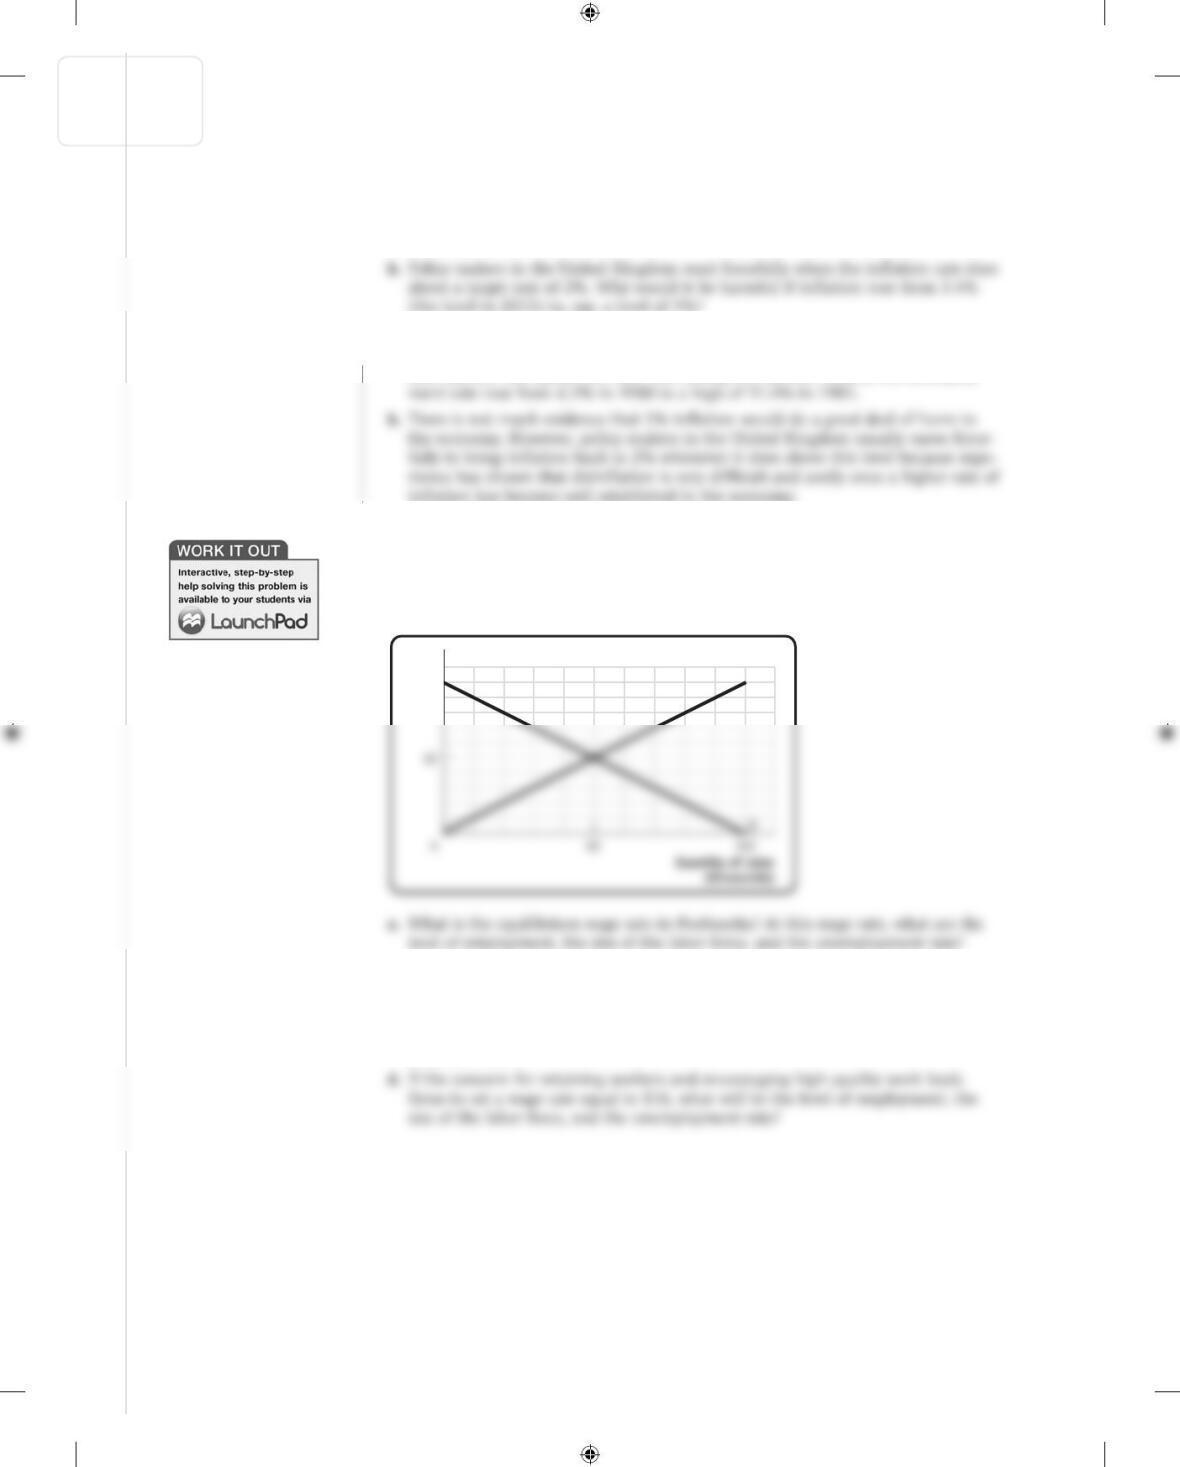
13. There is only one labor market in Profunctia. All workers have the same skills, and
all firms hire workers with these skills. Use the accompanying diagram, which shows
the supply of and demand for labor, to answer the following questions. Illustrate
each answer with a diagram.
$20
Wage
rate S
b. If the government of Profunctia sets a minimum wage equal to $12, what will be
the level of employment, the size of the labor force, and the unemployment rate?
c. If unions bargain with the firms in Profunctia and set a wage rate equal to $14,
what will be the level of employment, the size of the labor force, and the unem-
ployment rate?
KrugWellsECPS4e_Macro_CH08.indd S-120 1/26/15 10:13 AM

CHAPTER 8 UNEMPLOYMENT AND INFLATION S-121
Solution
13. a. The equilibrium wage rate is $10. At this wage rate, there will be 50,000 employed
workers, no unemployed workers, a labor force of 50,000, and an unemployment
rate of 0%.
$20
Wage
rate S
b. If the government of Profunctia sets a minimum wage equal to $12, then 60,000
workers (the size of the labor force) will be looking for work but only 40,000 will
find jobs. There will be 20,000 unemployed workers, and the unemployment rate
will be 33.3% ((20,000/60,000) × 100).
$20
Wage
rate
S
c. If unions bargain with the firms in Profunctia and set a wage rate equal to $14,
then 70,000 workers (the size of the labor force) will be looking for work but only
30,000 will find jobs. There will be 40,000 unemployed workers, and the unem-
ployment rate will be 57.1% ((40,000/70,000) × 100).
$20
Wage
rate
S
KrugWellsECPS4e_Macro_CH08.indd S-121KrugWellsECPS4e_Macro_CH08.indd S-121 1/26/15 10:14 AM1/26/15 10:14 AM

S-122 CHAPTER 8 UNEMPLOYMENT AND INFLATION
d. If the concern for retaining workers and encouraging high-quality work leads firms
KrugWellsECPS4e_Macro_CH08.indd S-122KrugWellsECPS4e_Macro_CH08.indd S-122 1/26/15 10:14 AM1/26/15 10:14 AM