CHAPTER 8
NET PRESENT VALUE AND OTHER
INVESTMENT CRITERIA
Answers to Concepts Review and Critical Thinking Questions
1. A payback period less than the project’s life means that the NPV is positive for a zero discount rate,
but nothing more definitive can be said. For discount rates greater than zero, the payback period will
still be less than the project’s life, but the NPV may be positive, zero, or negative, depending on
whether the discount rate is less than, equal to, or greater than the IRR.
3. a. Payback period is simply the break-even point of a series of cash flows. To actually compute the
payback period, it is assumed that any cash flow occurring during a given period is realized
continuously throughout the period, and not at a single point in time. The payback is then the
point in time for the series of cash flows when the initial cash outlays are fully recovered. Given
some predetermined cutoff for the payback period, the decision rule is to accept projects that
payback before this cutoff, and reject projects that take longer to payback.
4. a. The average accounting return is interpreted as an average measure of the accounting
performance of a project over time, computed as some average profit measure due to the project
divided by some average balance sheet value for the project. This text computes AAR as average
net income with respect to average (total) book value. Given some predetermined cutoff for AAR,
the decision rule is to accept projects with an AAR in excess of the target measure, and reject all
other projects.
b. AAR is not a measure of cash flows and market value, but a measure of financial statement
5. a. NPV is simply the sum of the present values of a project’s cash flows. NPV specifically measures,
after considering the time value of money, the net increase or decrease in firm wealth due to the
project. The decision rule is to accept projects that have a positive NPV, and reject projects with
a negative NPV.
6. a. The IRR is the discount rate that causes the NPV of a series of cash flows to be equal to zero.
IRR can thus be interpreted as a financial break-even rate of return; at the IRR discount rate, the
net value of the project is zero. The IRR decision rule is to accept projects with IRRs greater than
the discount rate, and to reject projects with IRRs less than the discount rate.
7. a. The profitability index is the present value of the future cash flows divided by the initial
investment. As such, it is a benefit/cost ratio, providing a measure of the relative profitability of
a project. The profitability index decision rule is to accept projects with a PI greater than one,
and to reject projects with a PI less than one.
8. For a project with future cash flows that are an annuity:
Payback = I / C
And the IRR is:
0 = – I + C / IRR
9. There are a number of reasons. Two of the most important have to do with transportation costs and
exchange rates. Manufacturing in the U.S. places the finished product much closer to the point of sale,
resulting in significant savings in transportation costs. It also reduces inventories because goods spend
less time in transit. Higher labor costs tend to offset these savings to some degree, at least compared
to other possible manufacturing locations. Of great importance is the fact that manufacturing in the
U.S. means that a much higher proportion of the costs are paid in dollars. Since sales are in dollars,
the net effect is to immunize profits to a large extent against fluctuations in exchange rates. This issue
is discussed in greater detail in the chapter on international finance.
11. Yes, they are. Such entities generally need to allocate available capital efficiently, just as for-profits
do. However, it is frequently the case that the “revenues” from not-for-profit ventures are not tangible.
For example, charitable giving has real opportunity costs, but the benefits are generally hard to
measure. To the extent that benefits are measurable, the question of an appropriate required return
remains. Payback rules are commonly used in such cases. Finally, realistic cost/benefit analysis along
the lines indicated should definitely be used by the U.S. government and would go a long way toward
balancing the budget!
13. The MIRR is calculated by finding the present value of all cash outflows, the future value of all cash
inflows to the end of the project, and then calculating the IRR of the two cash flows. As a result, the
14. The statement is incorrect. It is true that if you calculate the future value of all intermediate cash flows
to the end of the project at the required return, then calculate the NPV of this future value and the
initial investment, you will get the same NPV. However, NPV says nothing about reinvestment of
intermediate cash flows. The NPV is the present value of the project cash flows. What is actually done
15. The statement is incorrect. It is true that if you calculate the future value of all intermediate cash flows
to the end of the project at the IRR, then calculate the IRR of this future value and the initial
investment, you will get the same IRR. However, as in the previous question, what is done with the
cash flows once they are generated does not affect the IRR. Consider the following example:
Solutions to Questions and Problems
Basic
NOTE: All end-of-chapter problems were solved using a spreadsheet. Many problems require multiple
steps. Due to space and readability constraints, when these intermediate steps are included in this solutions
manual, rounding may appear to have occurred. However, the final answer for each problem is found
without rounding during any step in the problem.
1. To calculate the payback period, we need to find the time it takes to recover the initial investment.
After two years, the project has created:
$2,800 + 3,200 = $6,000
2. To calculate the payback period, we need to find the time it takes to recover the initial investment. The
cash flows in this problem are an annuity, so the calculation is simpler. If the initial cost is $3,100, the
payback period is:
Payback = 3 + $295 / $935
Payback = 3.32 years
If the initial cost is $7,900, the project never pays back. Notice that if you use the shortcut for annuity
cash flows, you get:
Payback = $7,900 / $935
Payback = 8.45 years
This answer does not make sense since the cash flows stop after eight years, so again, we must
conclude the payback period is never.
3. Project A has cash flows of:
Cash flows = $23,000 + 28,000
Cash flows = $51,000
during the first three years. The cash flows are still short by $29,000 of recapturing the initial
investment, so the payback for Project B is:
Payback = 3 + ($29,000 / $260,000)
Payback = 3.11 years
Using the payback criterion and a cutoff of 3 years, accept Project A and reject Project B.
4. Our definition of AAR is the average net income divided by the average book value. The average net
income for this project is:
5. The IRR is the interest rate that makes the NPV of the project equal to zero. So, the equation that defines
the IRR for this project is:
0 = –$168,500 + $86,000 / (1+IRR) + $91,000 / (1+IRR)2 + $53,000 / (1+IRR)3
6. The NPV of a project is the PV of the outflows minus by the PV of the inflows. The equation for the
NPV of this project at a 9 percent required return is:
NPV = –$168,500 + $86,000 / 1.09 + $91,000 / 1.092 + $53,000 / 1.093
NPV = $27,917.69
7. The NPV of a project is the PV of the outflows plus the PV of the inflows. Since the cash inflows are
an annuity, the equation for the NPV of this project at an 8 percent required return is:
NPV = –$8,450 + $2,145(PVIFA8%, 8)
NPV = $3,876.54
8. The IRR is the interest rate that makes the NPV of the project equal to zero. So, the equation that
defines the IRR for this project is:
0 = –$19,400 + $9,800 / (1+IRR) + $11,300 / (1+IRR)2 + $6,900 / (1+IRR)3
9. The NPV of a project is the PV of the outflows plus by the PV of the inflows. At a zero discount rate
(and only at a zero discount rate), the cash flows can be added together across time. So, the NPV of
the project at a zero percent required return is:
NPV = –$19,400 + 9,800 + 11,300 + 6,900
NPV = $8,600
The NPV at a 10 percent required return is:
10. a. The IRR is the interest rate that makes the NPV of the project equal to zero. The equation for the
IRR of Project A is:
0 = –$78,500 + $43,000 / (1 + IRR) + $29,000 / (1 + IRR)2 + $23,000 / (1 + IRR)3
+ $21,000 / (1 + IRR)4
b. The NPV of Project A is:
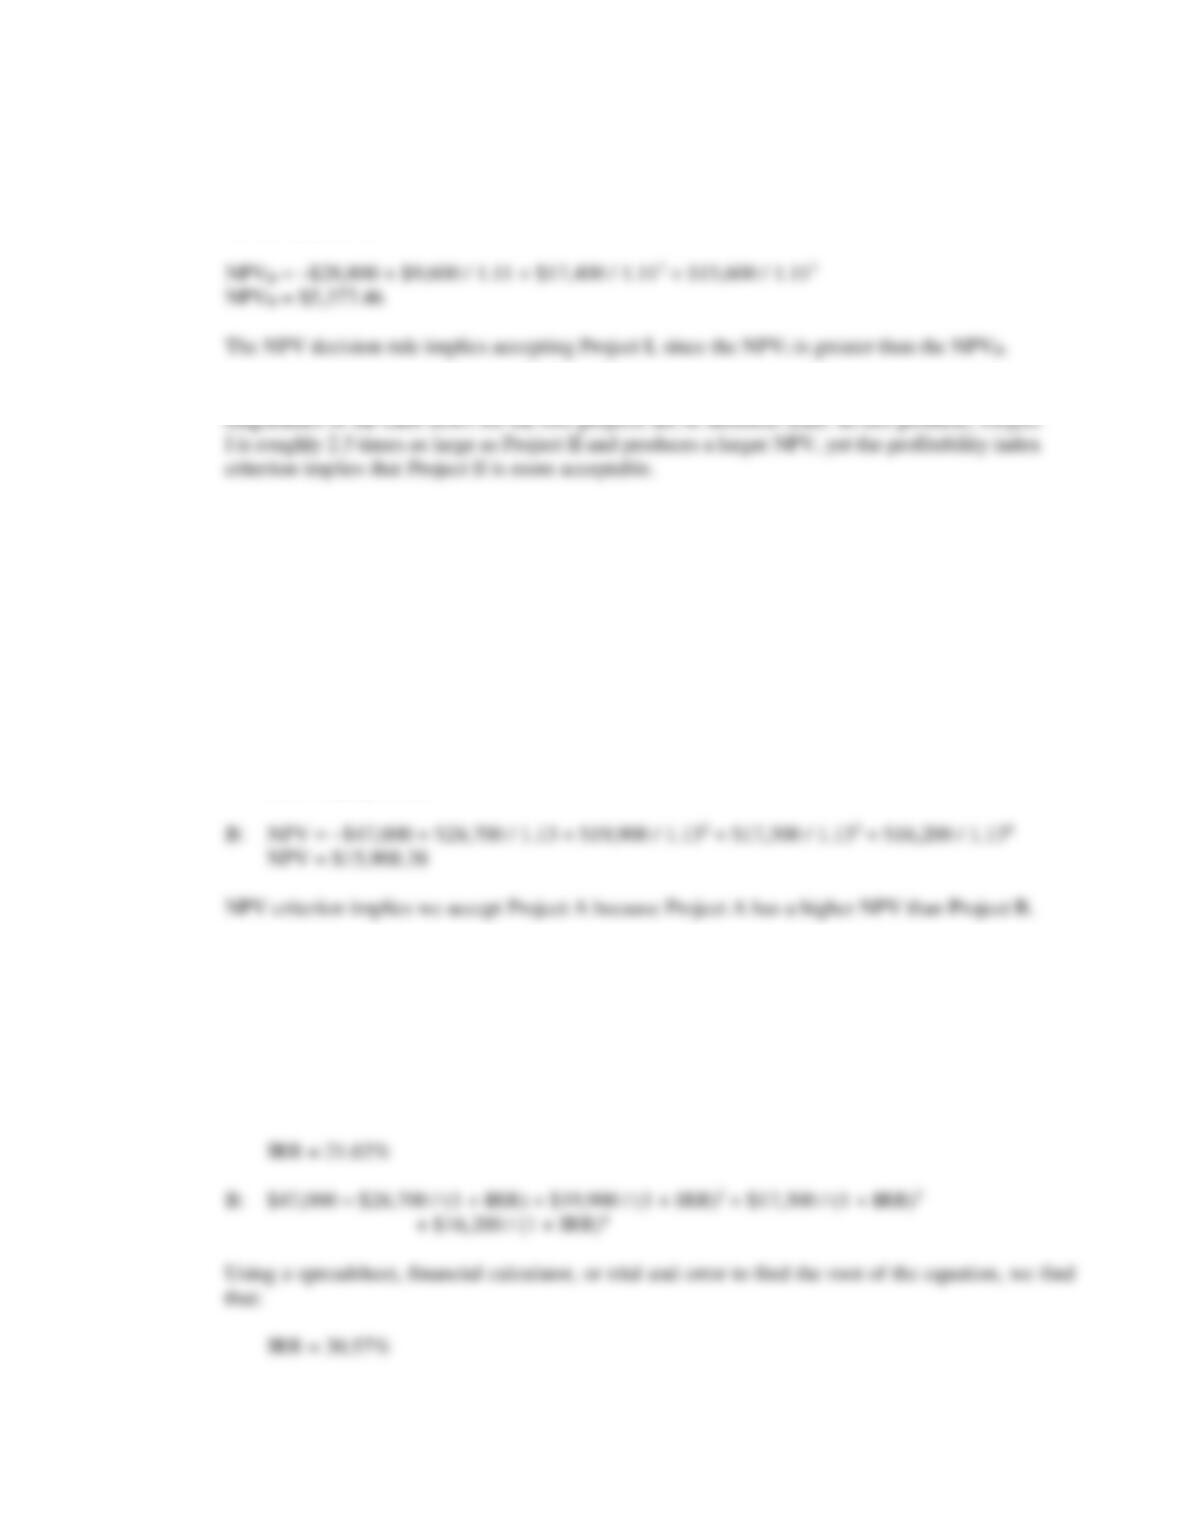
NPVA = –$78,500 + $43,000 / 1.11+ $29,000 / 1.112 + $23,000 / 1.113 + $21,000 / 1.114
NPVA = $14,426.54
And the NPV of Project B is:
c. To find the crossover rate, we subtract the cash flows from one project from the cash flows of the
other project. Here, we will subtract the cash flows for Project B from the cash flows of Project
A. Once we find these differential cash flows, we find the IRR. The equation for the crossover
rate is:
0 = $22,000 / (1 + R) + $1,000 / (1 + R)2 – $11,000 / (1 + R)3 – $20,000 / (1 + R)4
11. The IRR is the interest rate that makes the NPV of the project equal to zero. The equation to calculate
the IRR of Project X is:
0 = –$23,400 + $13,100 / (1 + IRR) + $9,480 / (1 + IRR)2 + $7,890 / (1 + IRR)3
Using a spreadsheet, financial calculator, or trial and error to find the root of the equation, we find that:
To find the crossover rate, we subtract the cash flows from one project from the cash flows of the other
project, and find the IRR of the differential cash flows. We will subtract the cash flows from Project
Y from the cash flows from Project X. It is irrelevant which cash flows we subtract from the other.
Subtracting the cash flows, the equation to calculate the IRR for these differential cash flows is:
Crossover rate: 0 = $3,900 / (1 + R) – $1,140 / (1 + R)2 – $3,290 / (1 + R)3
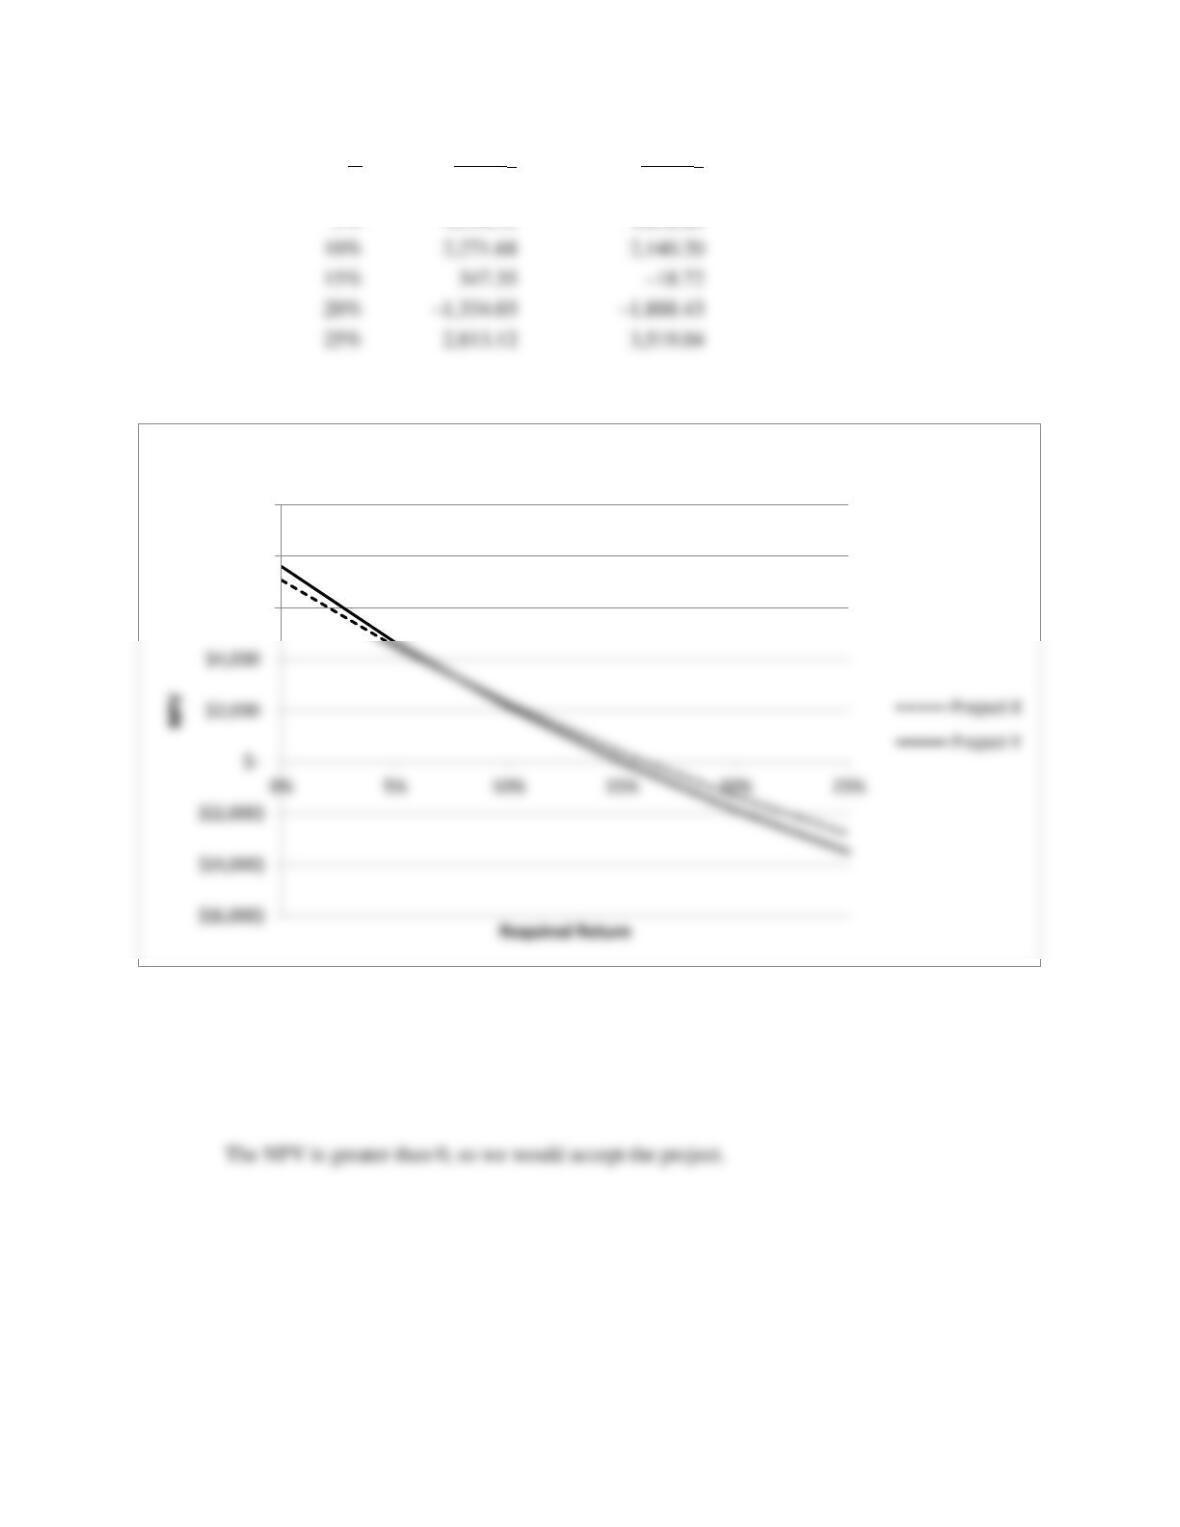
R
$NPVX
$NPVY
0%
$7,070.00
$7,600.00
5%
4,490.51
4,652.26
And the NPV profile is:
12. a. The equation for the NPV of the project is:
NPV = –$39,000,000 + $57,000,000 / 1.10 – $9,000,000 / 1.102
NPV = $5,380,165.29
$6,000
$8,000
$10,000
NPV Profile
b. The equation for the IRR of the project is:
0 = –$39,000,000 + $57,000,000 / (1 + IRR) – $9,000,000 / (1 + IRR)2
13. The profitability index is defined as the PV of the future cash flows divided by the initial investment.
The equation for the profitability index at a required return of 10 percent is:
PI = ($15,800 / 1.10 + $13,600 / 1.102 + $8,300 / 1.103) / $27,500
PI = 1.158
The equation for the profitability index at a required return of 15 percent is:
14. a. The profitability index is defined as the PV of the future cash flows divided by the initial
investment. The equation for the profitability index for each project is:
PII = ($28,300 / 1.11 + $34,800 / 1.112 + $43,700 / 1.113) / $78,000
PII = 1.099
b. The NPV of each project is:
NPVI = –$78,000 + $28,300 / 1.11 + $34,800 / 1.112 + $43,700 / 1.113
NPVI = $7,693.02
c. Using the profitability index to compare mutually exclusive projects can be ambiguous when the
15. a. The payback period for each project is:
A: 3 + ($110,000 / $325,000) = 3.34 years
B: 1 + ($18,300 / $19,900) = 1.92 years
The payback criterion implies accepting Project B, because it pays back sooner than Project A.
b. The NPV for each project is:
A: NPV = –$235,000 + $29,000 / 1.13 + $45,000 / 1.132 + $51,000 / 1.133 + $325,000 / 1.134
NPV = $60,579.46
c. The IRR for each project is:
A: $235,000 = $29,000 / (1 + IRR) + $45,000 / (1 + IRR)2 + $51,000 / (1 + IRR)3
+ $325,000 / (1 + IRR)4
Using a spreadsheet, financial calculator, or trial and error to find the root of the equation, we find
that:
IRR decision rule implies we accept Project B because IRR for B is greater than IRR for A.
d. The profitability index for each project is:
A: PI = ($29,000 / 1.13 + $45,000 / 1.132 + $51,000 / 1.133 + $325,000 / 1.134) / $235,000
PI = 1.258
16. a. The IRR for each project is:
M: $150,000 = $68,600 / (1 + IRR) + $76,800 / (1 + IRR)2 + $71,300 / (1 + IRR)3
+ $40,500 / (1 + IRR)4
Using a spreadsheet, financial calculator, or trial and error to find the root of the equation, we find
that:
b. The NPV for each project is:
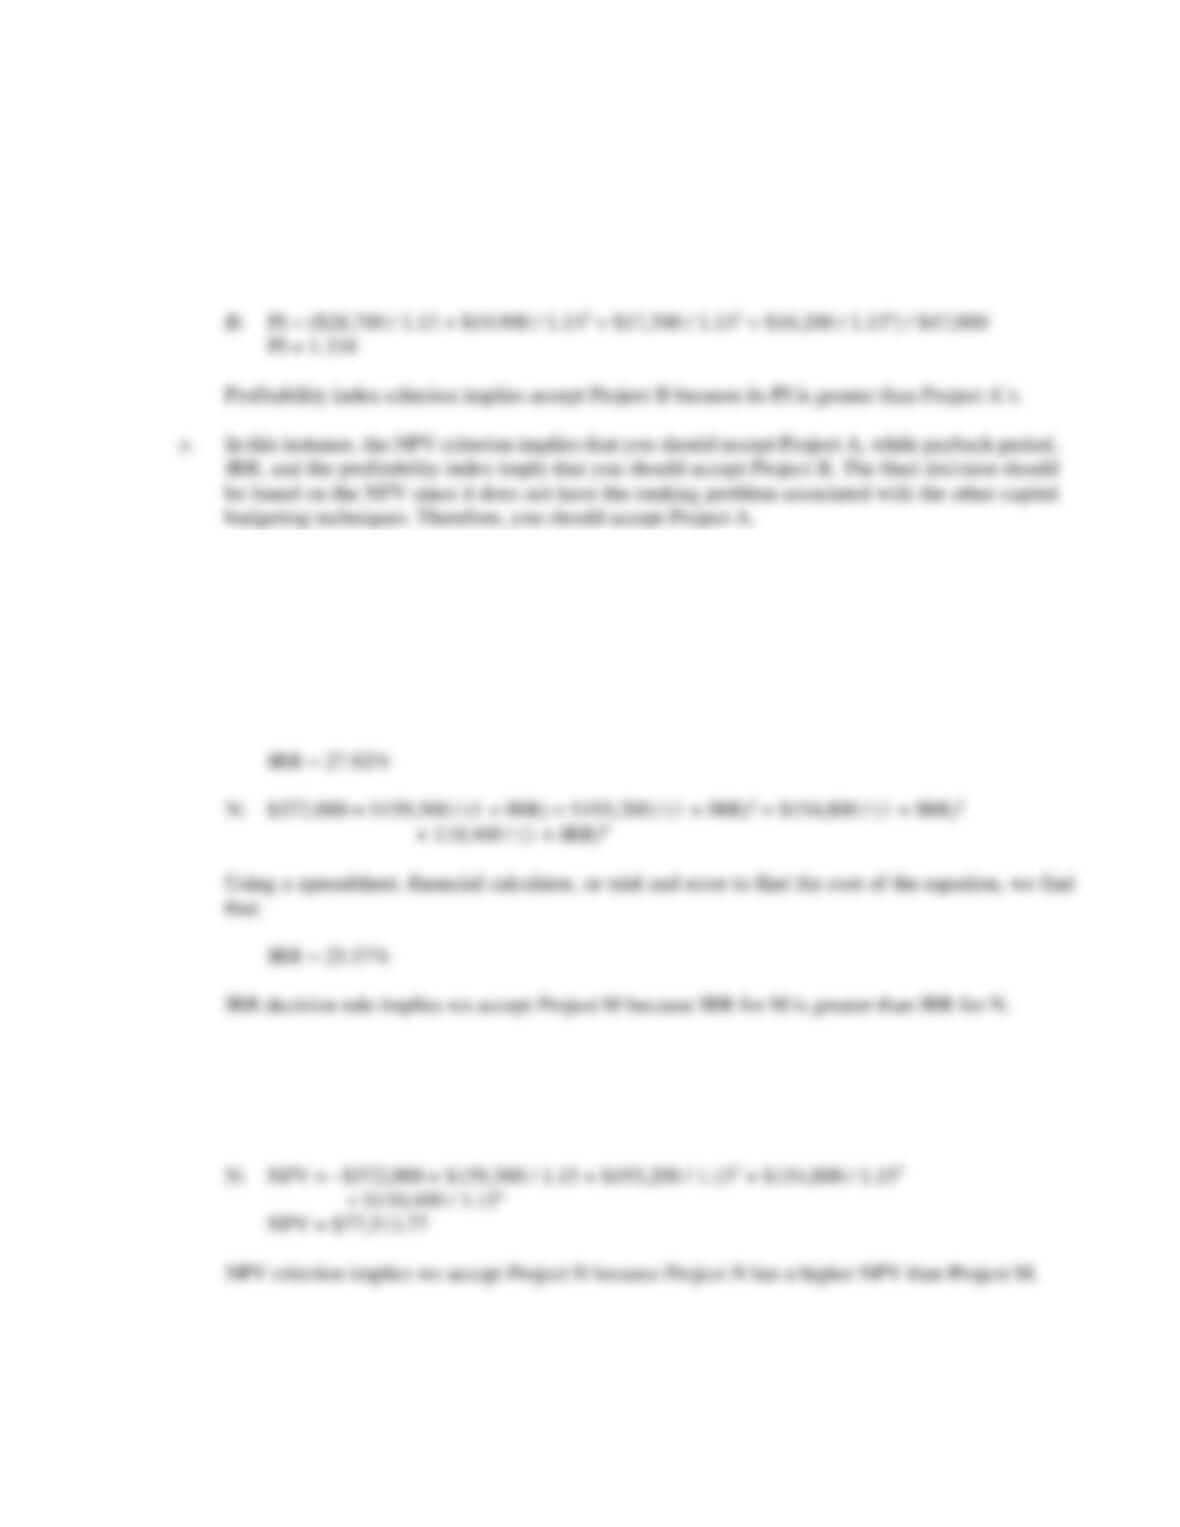
M: NPV = –$150,000 + $68,600 / 1.15 + $76,800 / 1.152 + $71,300 / 1.153 + $40,500 / 1.154
NPV = $37,760.92
c. Accept Project N since the NPV is higher. IRR cannot be used to rank mutually exclusive
projects.
17. a. The profitability index for each project is:
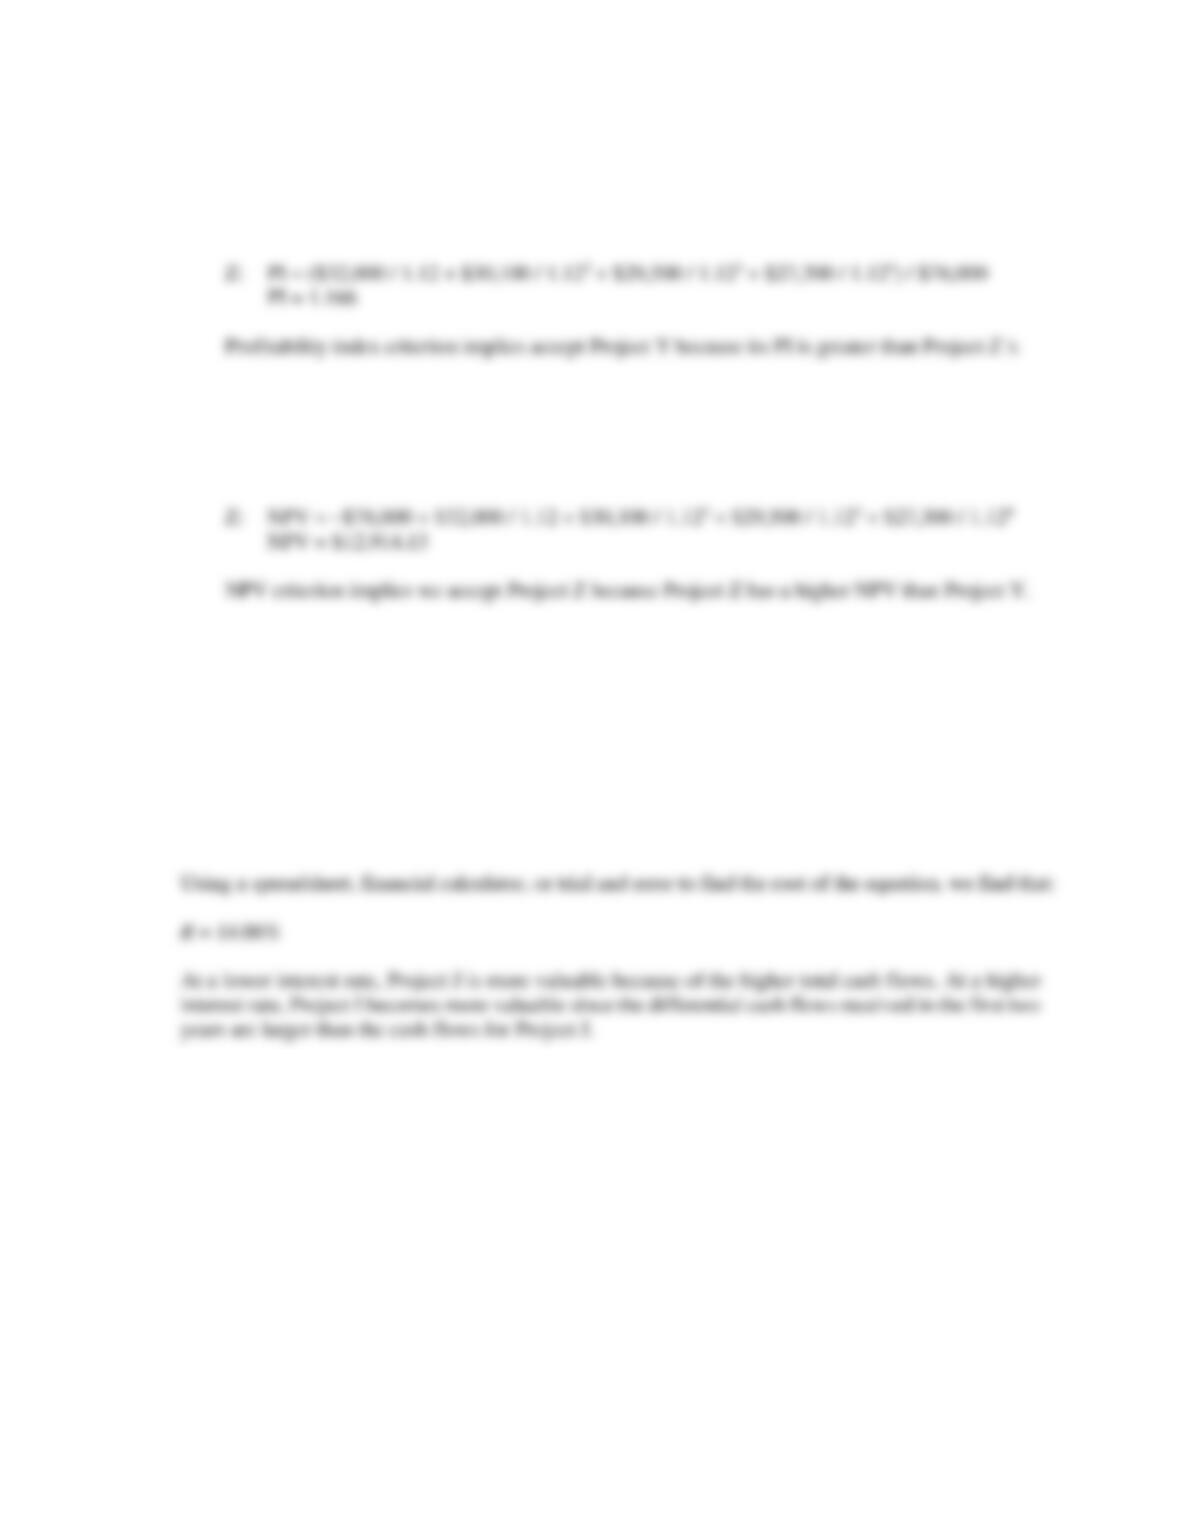
Y: PI = ($19,800 / 1.12 + $17,500 / 1.122 + $20,700 / 1.123 + $14,600 / 1.124) / $43,400
PI = 1.282
b. The NPV for each project is:
Y: NPV = –$43,400 + $19,800 / 1.12 + $17,500 / 1.122 + $20,700 / 1.123 + $14,600 / 1.124
NPV = $12,241.88
c. Accept Project Z since the NPV is higher. The profitability index cannot be used to rank mutually
exclusive projects.
18. To find the crossover rate, we subtract the cash flows from one project from the cash flows of the other
project, and find the IRR of the differential cash flows. We will subtract the cash flows from Project J
from the cash flows from Project I. It is irrelevant which cash flows we subtract from the other.
Subtracting the cash flows, the equation to calculate the IRR for these differential cash flows is:
Crossover rate: 0 = $23,200 / (1 + R) + $5,600 / (1 + R)2 – $13,600 / (1 + R)3 – $26,200 / (1 + R)4
19. If the payback period is exactly equal to the project’s life then the IRR must be equal to zero since the
project pays back exactly the initial investment. If the project never pays back its initial investment,
then the IRR of the project must negative.
20. At a zero discount rate (and only at a zero discount rate), the cash flows can be added together across
time. So, the NPV of the project at a zero percent required return is:
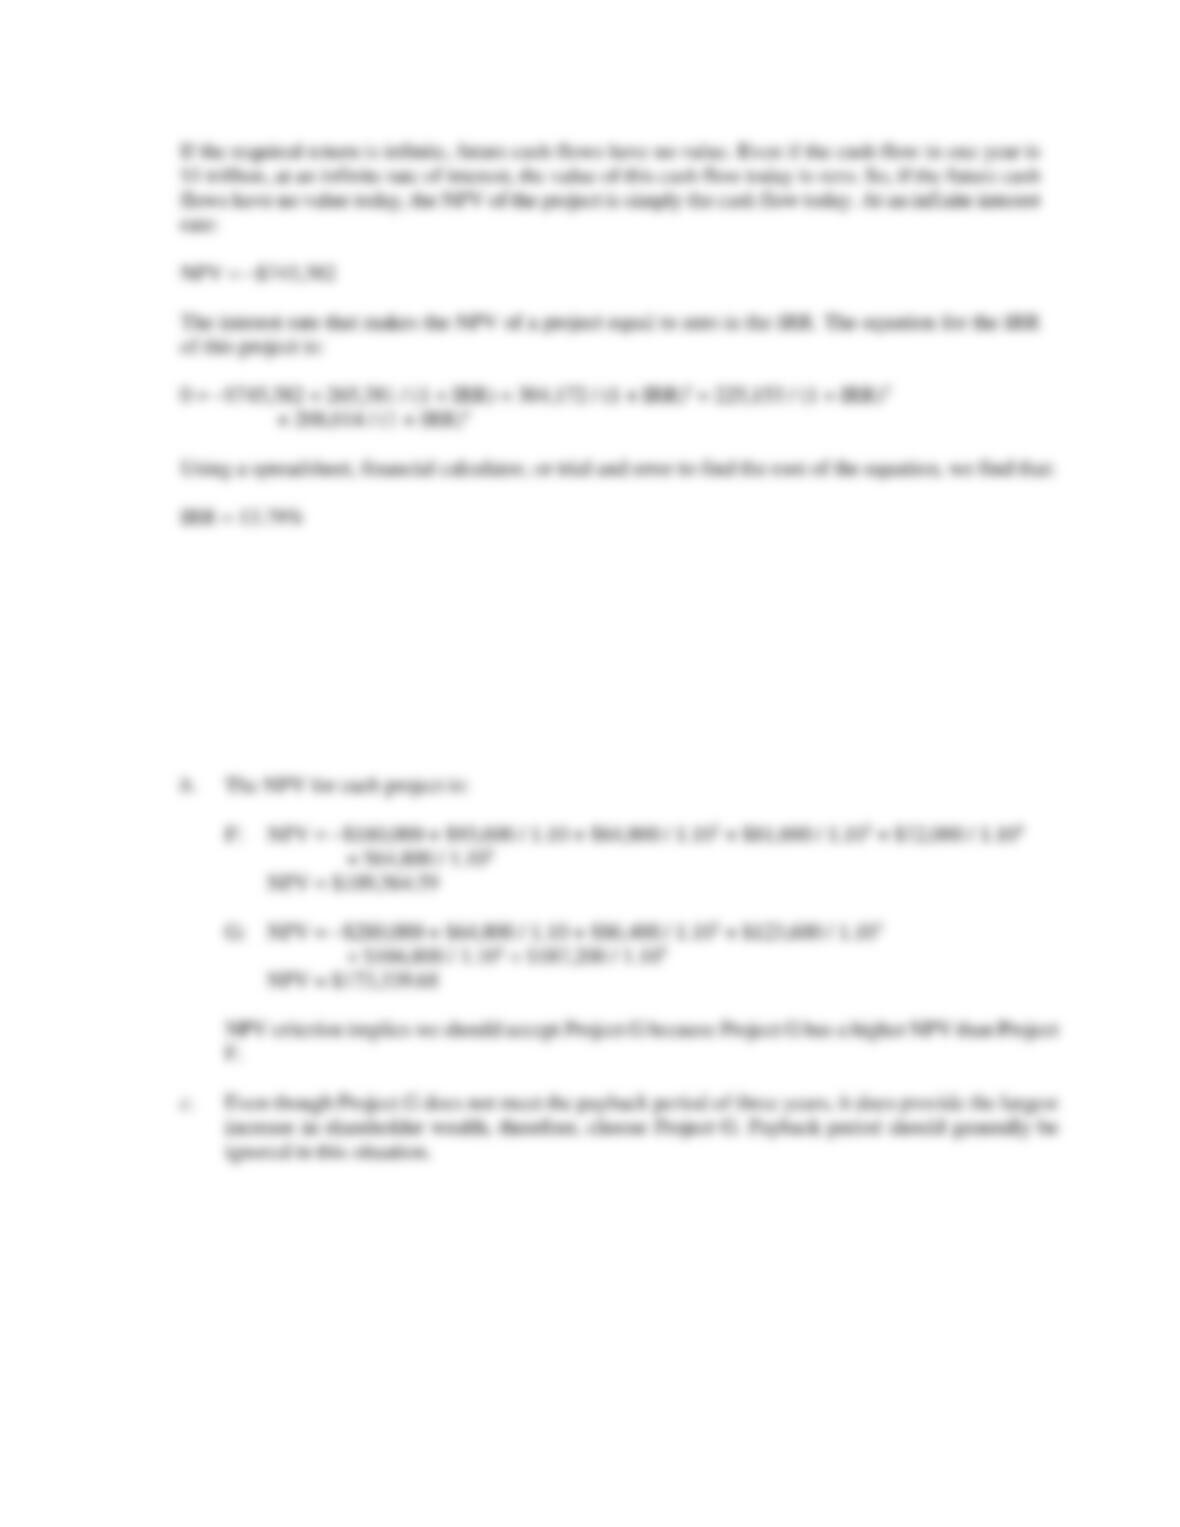
NPV = –$745,382 + 265,381 + 304,172 + 225,153 + 208,614
NPV = $257,938
21. a. The payback period for each project is:
F: 2 + ($21,600 / $81,600) = 2.26 years
G: 3 + ($5,200 / $166,800) = 3.03 years
The payback criterion implies accepting Project F because it pays back sooner than Project G.
Project G does not meet the minimum payback of three years.
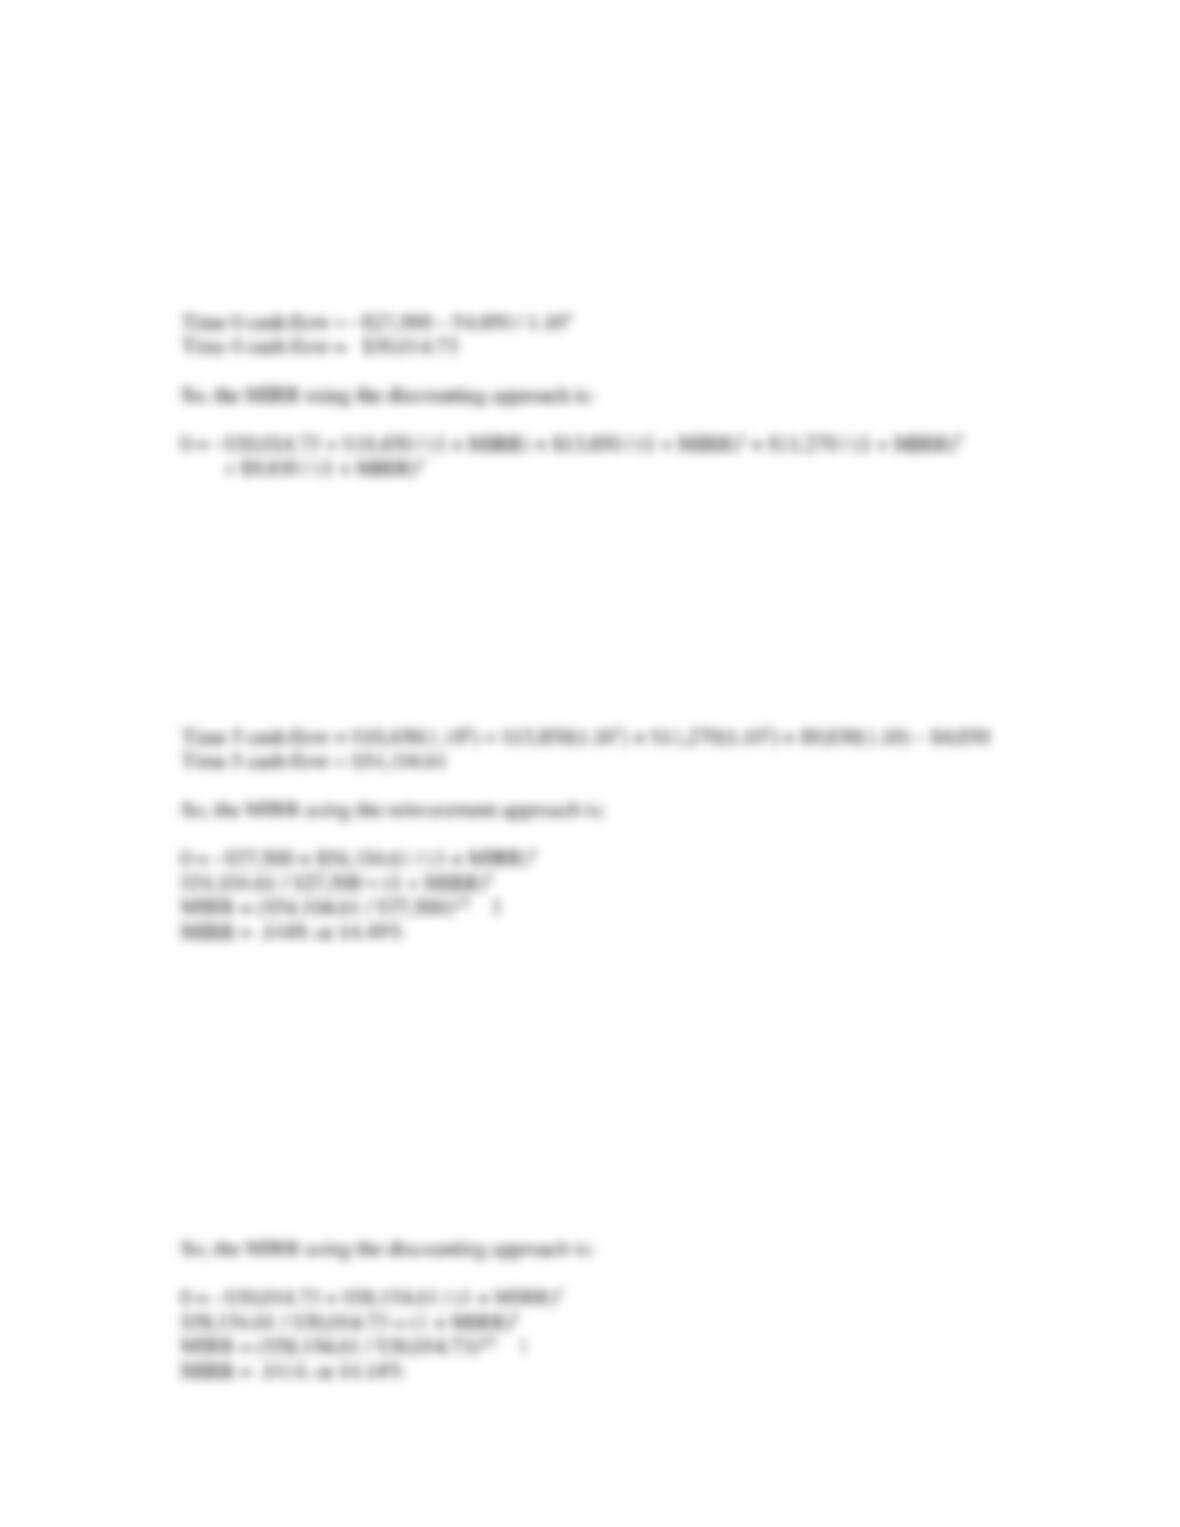
22. The MIRR for the project with all three approaches is:
Discounting approach:
In the discounting approach, we find the value of all cash outflows to Time 0, while any cash inflows
remain at the time at which they occur. So, discounting the cash outflows to Time 0, we find:
Using a spreadsheet, financial calculator, or trial and error to find the root of the equation, we find that:
MIRR = 19.21%
Reinvestment approach:
In the reinvestment approach, we find the future value of all cash except the initial cash flow at the
end of the project. So, reinvesting the cash flows to Time 5, we find:
Combination approach:
In the combination approach, we find the value of all cash outflows at Time 0, and the value of all
cash inflows at the end of the project. So, the value of the cash flows is:
Time 0 cash flow = –$27,500 – $4,050 / 1.105
Time 0 cash flow = –$30,014.73
Time 5 cash flow = $10,430(1.104) + $13,850(1.103) + $11,270(1.102) + $9,830(1.10)
Time 5 cash flow = $58,154.61
Intermediate
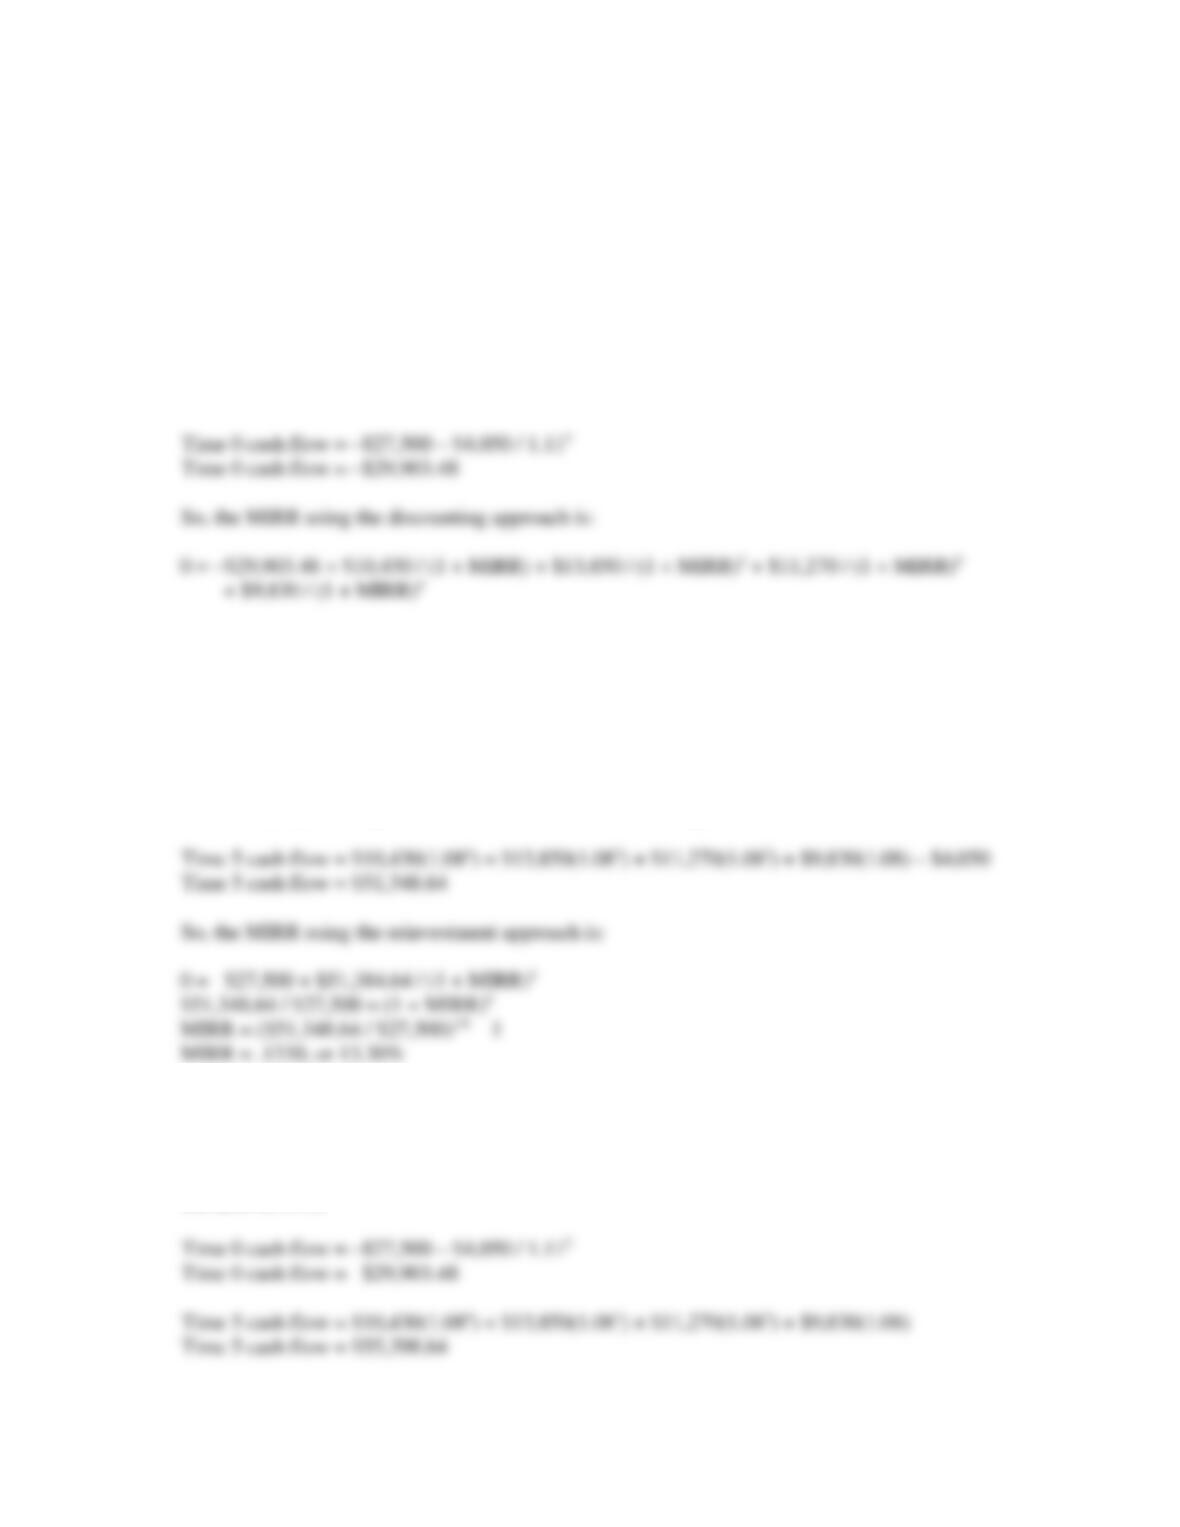
23. With different discounting and reinvestment rates, we need to make sure to use the appropriate interest
rate. The MIRR for the project with all three approaches is:
Discounting approach:
In the discounting approach, we find the value of all cash outflows to Time 0 at the discount rate, while
any cash inflows remain at the time at which they occur. So, discounting the cash outflows to Time 0,
we find:
Using a spreadsheet, financial calculator, or trial and error to find the root of the equation, we find that:
MIRR = 19.41%
Reinvestment approach:
In the reinvestment approach, we find the future value of all cash except the initial cash flow at the
end of the project using the reinvestment rate. So, reinvesting the cash flows to Time 5, we find:
Combination approach:
In the combination approach, we find the value of all cash outflows at Time 0 using the discount rate,
and the value of all cash inflows at the end of the project using the reinvestment rate. So, the value of
the cash flows is:
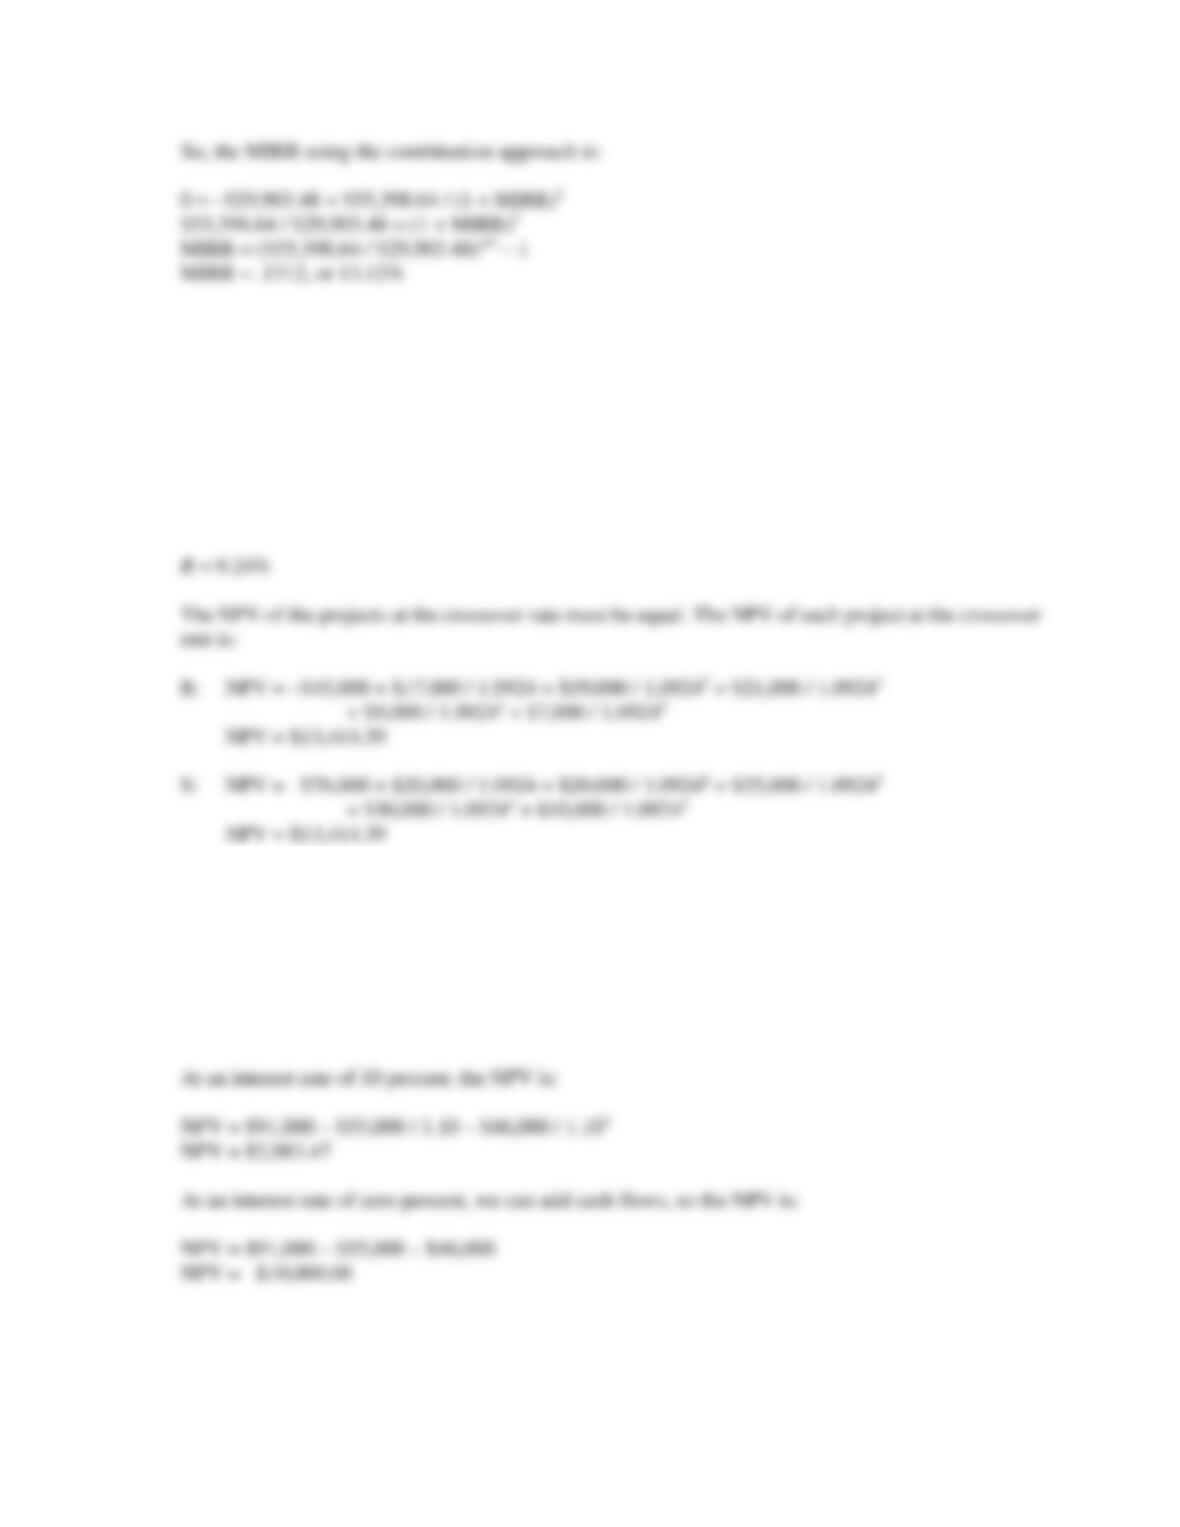
24. To find the crossover rate, we subtract the cash flows from one project from the cash flows of the other
project, and find the IRR of the differential cash flows. We will subtract the cash flows from Project
S from the cash flows from Project R. It is irrelevant which cash flows we subtract from the other.
Subtracting the cash flows, the equation to calculate the IRR for these differential cash flows is:
0 = $31,000 – $3,000 / (1 + R) – $1,000 / (1 + R)2 – $14,000 / (1 + R)3 – $21,000 / (1 + R)4
– $3,000 / (1 + R)5
Using a spreadsheet, financial calculator, or trial and error to find the root of the equation, we find that:
25. The IRR of the project is:
$91,000 = $55,000 / (1 + IRR) + $46,000 / (1 + IRR)2
Using a spreadsheet, financial calculator, or trial and error to find the root of the equation, we find that:
IRR = 7.47%
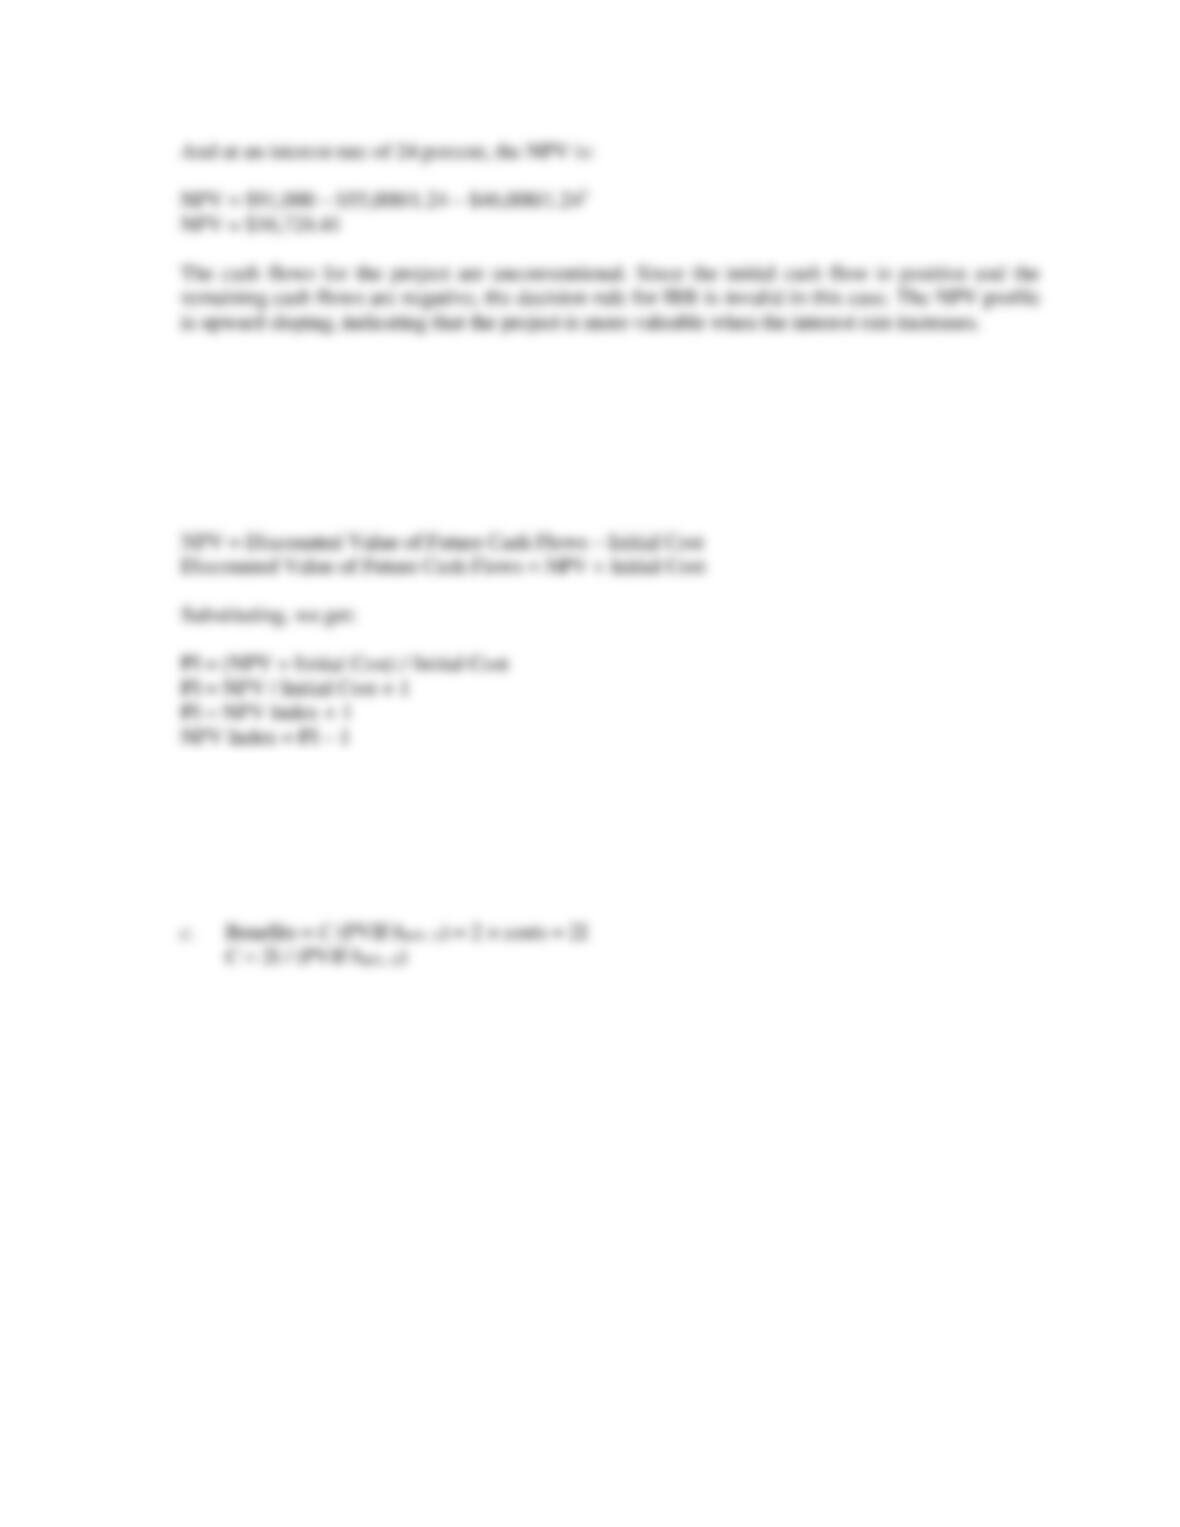
26. By definition, the profitability index is:
PI = Discounted Value of Future Cash Flows / Initial Cost
But note that the discounted value of future cash flows is just the NPV overstated by the neglected
initial costs, so:
27. a. To have a payback equal to the project’s life, given C is a constant cash flow for N years:
C = I/N
b. To have a positive NPV, I < C (PVIFAR%, N). Thus, C > I / (PVIFAR%, N).
Challenge
28. a. Here the cash inflows of the project go on forever, which is a perpetuity. Unlike ordinary
perpetuity cash flows, the cash flows here grow at a constant rate forever, which is a growing
perpetuity. If you remember back to the chapter on stock valuation, we presented a formula for
valuing a stock with constant growth in dividends. This formula is actually the formula for a
growing perpetuity, so we can use it here. The PV of the future cash flows from the project is:
b. Here we want to know the minimum growth rate in cash flows necessary to accept the project.
The minimum growth rate is the growth rate at which we would have a zero NPV. The equation
for a zero NPV, using the equation for the PV of a growing perpetuity, is:
0 = –$1,575,000 + $135,000 / (.12 – g)
29. The IRR is the interest rate that makes the NPV of the project equal to zero. So, the IRR of the project
is:
0 = $35,000 – $27,000 / (1 + IRR) + $29,000 / (1 + IRR)2
Even though it appears there are two IRRs, a spreadsheet, financial calculator, or trial and error will
not give an answer. The reason is that there is no real IRR for this set of cash flows. If you examine
30. First, we need to find the future value of the cash flows for the one year in which they are blocked by
the government. So, reinvesting each cash inflow for one year, we find:
Year 2 cash flow = $303,800(1.04) = $315,952
Year 3 cash flow = $219,700(1.04) = $228,488
Year 4 cash flow = $320,000(1.04) = $332,800
Year 5 cash flow = $288,700(1.04) = $300,248
So, the NPV of the project is:
Calculator Solutions
5.
CFo
–$168,500
C01
$86,000
F01
1
C02
$91,000
F02
1
C03
$53,000
1
IRR CPT
18.79%

6.
CFo
–$168,500
CFo
–$168,500
C01
$86,000
C01
$86,000
F01
1
F01
1
7.
CFo
–$8,450
CFo
–$8,450
CFo
–$8,450
C01
$2,145
C01
$2,145
C01
$2,145
F01
8
F01
8
F01
8
I = 8%
I = 24%
IRR CPT
NPV CPT
NPV CPT
19.13%
$3,876.54
–$1,111.48
8.
CFo
–$19,400
C01
$9,800
1
C02
$11,300
1
C03
$6,900
F03
1
IRR CPT
22.09%
9.
CFo
–$19,400
CFo
–$19,400
C01
$9,800
C01
$9,800
F01
1
F01
1
C02
$11,300
C02
$11,300
1
1
C03
$6,900
C03
$6,900
1
1
I = 0%
I = 10%
NPV CPT
NPV CPT
$8,600.00
$4,032.01
C02
$91,000
C02
$91,000
1
1
C03
$53,000
C03
$53,000
1
1
I = 9%
I = 21%
NPV CPT
NPV CPT
$27,917.69
–$5,354.28
CFo
–$19,400
CFo
–$19,400
C01
$9,800
C01
$9,800
F01
1
F01
1
10.
CF (A)
Cfo
–$78,500
CFo
–$78,500
C01
$43,000
C01
$43,000
F01
1
F01
1
C02
$29,000
C02
$29,000
F02
1
F02
1
C03
$23,000
C03
$23,000
F03
1
F03
1
C04
$21,000
C04
$21,000
F04
1
F04
1
CPT IRR
I = 11%
20.70%
NPV CPT
$14,426.54
CF (B)
CFo
–$78,500
CFo
–$78,500
C01
$21,000
C01
$21,000
F01
1
F01
1
C02
$28,000
C02
$28,000
F02
1
F02
1
C03
$34,000
C03
$34,000
F03
1
F03
1
C04
$41,000
C04
$41,000
F04
1
F04
1
CPT IRR
I = 11%
18.73%
NPV CPT
$15,012.82
C02
$11,300
C02
$11,300
F02
1
F02
1
C03
$6,900
C03
$6,900
F03
1
F03
1
I = 20%
I = 30%
NPV CPT
NPV CPT
$606.94
–$2,034.50

Crossover rate:
CFo
$0
C01
$22,000
F01
1
C02
$1,000
11.
CF (X)
CFo
–$23,400
CFo
–$23,400
C01
$13,100
C01
$13,100
F01
1
F01
1
C02
$9,480
C02
$9,480
F02
1
F02
1
C03
$7,890
C03
$7,890
F03
1
F03
1
I = 0%
I = 25%
NPV CPT
NPV CPT
$7,070
–$2,813.12
CF (Y)
CFo
–$23,400
CFo
–$23,400
C01
$9,200
C01
$9,200
F01
1
F01
1
C02
$10,620
C02
$10,620
F02
1
F02
1
C03
$11,180
C03
$11,180
F03
1
F03
1
I = 0%
I = 25%
NPV CPT
NPV CPT
$7,600
–$3,519.04
Crossover rate:
CFo
$0
C01
$3,900
F01
1
C02
–$1,140
F02
1
C03
–$3,290
F03
1
CPT IRR
7.62%
F02
1
C03
–$11,000
F03
1
C04
–$20,000
F04
1
CPT IRR
12.21%
12.
CFo
–$39,000,000
CFo
–$39,000,000
C01
$57,000,000
C01
$57,000,000
13.
CFo
$0
CFo
$0
CFo
$0
C01
$15,800
C01
$15,800
C01
$15,800
F01
1
F01
1
F01
1
C02
$13,600
C02
$13,600
C02
$13,600
F02
1
F02
1
F02
1
C03
$8,300
C03
$8,300
C03
$8,300
F03
1
F03
1
F03
1
I = 10%
I = 15%
I = 22%
NPV CPT
NPV CPT
NPV CPT
$31,839.22
$29,480.07
$26,659.02
@10%: PI = $31,839.22 / $27,500 = 1.158
@15%: PI = $29,480.07 / $27,500 = 1.072
@22%: PI = $26,659.02 / $27,500 = .969
14. a. The profitability indexes are:
CF (I)
CF (II)
CFo
$0
CFo
$0
C01
$28,300
C01
$9,600
F01
1
F01
1
C02
$34,800
C02
$17,400
F02
1
F02
1
C03
$43,700
C03
$15,600
F03
1
F03
1
I = 11%
I = 11%
NPV CPT
NPV CPT
$85,693.02
$34,177.46
F01
1
F01
1
C02
C02
F02
1
F02
1
I = 10
IRR CPT
NPV CPT
28.15%
$5,380,165.29
b. The NPV of each project is:
CF (I)
CF (II)
CFo
–$78,000
CFo
–$28,800
C01
$28,300
C01
$9,600
F01
1
F01
1
C02
$34,800
C02
$17,400
15.
CF (A)
CFo
–$235,000
CFo
–$235,000
CFo
$0
C01
$29,000
C01
$29,000
C01
$29,000
F01
1
F01
1
F01
1
C02
$45,000
C02
$45,000
C02
$45,000
1
1
1
C03
$51,000
C03
$51,000
C03
$51,000
1
1
1
C04
$325,000
C04
$325,000
C04
$325,000
F04
1
F04
1
F04
1
I = 13%
IRR CPT
I = 13%
NPV CPT
21.02%
NPV CPT
$60,579.46
$295,579.46
PI = $295,579.46 / $235,000 = 1.258
CF (B)
CFo
–$47,000
CFo
–$47,000
CFo
$0
C01
$28,700
C01
$28,700
C01
$28,700
F01
1
F01
1
F01
1
C02
$19,900
C02
$19,900
C02
$19,900
F02
1
F02
1
F02
1
C03
$17,300
C03
$17,300
C03
$17,300
F03
1
F03
1
F03
1
C04
$16,200
C04
$16,200
C04
$16,200
1
1
1
I = 13%
IRR CPT
I = 13%
NPV CPT
30.57%
NPV CPT
$15,908.38
$62,908.38
1
1
C03
$43,700
C03
$15,600
1
1
I = 11%
I = 11%
NPV CPT
NPV CPT
$7,693.02
$5,377.46
16.
Project M
CFo
–$150,000
CFo
–$150,000
C01
$68,600
C01
$68,600
F01
1
F01
1
C02
$76,800
C02
$76,800
F02
1
F02
1
Project N
CFo
–$372,000
CFo
–$372,000
C01
$159,300
C01
$159,300
F01
1
F01
1
C02
$193,200
C02
$193,200
F02
1
F02
1
C03
$154,800
C03
$154,800
F03
1
F03
1
C04
$110,400
C04
$110,400
F04
1
F04
1
CPT IRR
I = 15%
25.57%
NPV CPT
$77,513.77
17.
Project Y
CFo
$0
CFo
–$43,400
C01
$19,800
C01
$19,800
F01
1
F01
1
C02
$17,500
C02
$17,500
F02
1
F02
1
C03
$20,700
C03
$20,700
F03
1
F03
1
C04
$14,600
C04
$14,600
F04
1
F04
1
I = 12%
I = 12%
NPV CPT
NPV CPT
$55,641.88
$12,241.88
C03
$71,300
C03
$71,300
F03
1
F03
1
C04
$40,500
C04
$40,500
F04
1
F04
1
CPT IRR
I = 15%
27.82%
NPV CPT
$37,760.92
Project Z
CFo
$0
CFo
–$78,000
C01
$32,000
C01
$32,000
F01
1
F01
1
C02
$30,100
C02
$30,100
PI = $90,914.13 / $78,000 = 1.166
18.
CFo
$0
C01
$23,200
F01
1
C02
$5,600
F02
1
C03
F03
1
C04
F04
1
CPT IRR
14.06%
20.
CFo
–$745,382
CFo
–$745,382
C01
$265,381
C01
$265,381
F01
1
F01
1
C02
$304,172
C02
$304,172
F02
1
F02
1
C03
$225,153
C03
$225,153
F03
1
F03
1
C04
$208,614
C04
$208,614
F04
1
F04
1
I = 0
IRR CPT
NPV CPT
13.79%
$257,938
F02
1
F02
1
C03
$29,500
C03
$29,500
F03
1
F03
1
C04
$27,300
C04
$27,300
F04
1
F04
1
I = 12%
I = 12%
NPV CPT
NPV CPT
$90,914.13
$12,914.13
21. b.
Project F
Project G
CFo
–$180,000
CFo
–$280,000
C01
$93,600
C01
$64,800
F01
1
F01
1
C02
$64,800
C02
$86,400
F02
1
F02
1
24. Crossover rate:
CFo
$31,000
C01
–$3,000
F01
1
C02
–$1,000
F02
1
C03
–$14,000
F03
1
C04
–$21,000
F04
1
C05
–$3,000
F05
1
IRR CPT
9.24%
Project R
Project S
CFo
–$45,000
CFo
–$76,000
C01
$17,000
C01
$20,000
F01
1
F01
1
C02
$19,000
C02
$20,000
F02
1
F02
1
C03
$21,000
C03
$35,000
F03
1
F03
1
C04
$9,000
C04
$30,000
F04
1
F04
1
C05
$7,000
C05
$10,000
F05
1
F05
I = 9.24%
I = 9.24%
NPV CPT
NPV CPT
$13,414.39
$13,414.39
C03
$81,600
C03
$123,600
F03
1
F03
1
C04
$72,000
C04
$166,800
F04
1
F04
1
C05
$64,800
C05
$187,200
F05
1
F05
1
I = 10%
I = 10%
NPV CPT
NPV CPT
$109,364.59
$173,339.68

25.
CFo
$91,000
C01
–$55,000
F01
1
C02
–$46,000
F02
1
IRR CPT
7.47%
CFo
$91,000
CFo
$91,000
CFo
$91,000
C01
–$55,000
C01
–$55,000
C01
–$55,000
F01
1
F01
1
F01
1
C02
–$46,000
C02
–$46,000
C02
–$46,000
F02
1
F02
1
F02
1
I = 0%
I = 10%
I = 24%
NPV CPT
NPV CPT
NPV CPT
–$10,000
$2,983.47
$16,728.41