Unlock document.
This document is partially blurred.
Unlock all pages and 1 million more documents.
Get Access
Solution
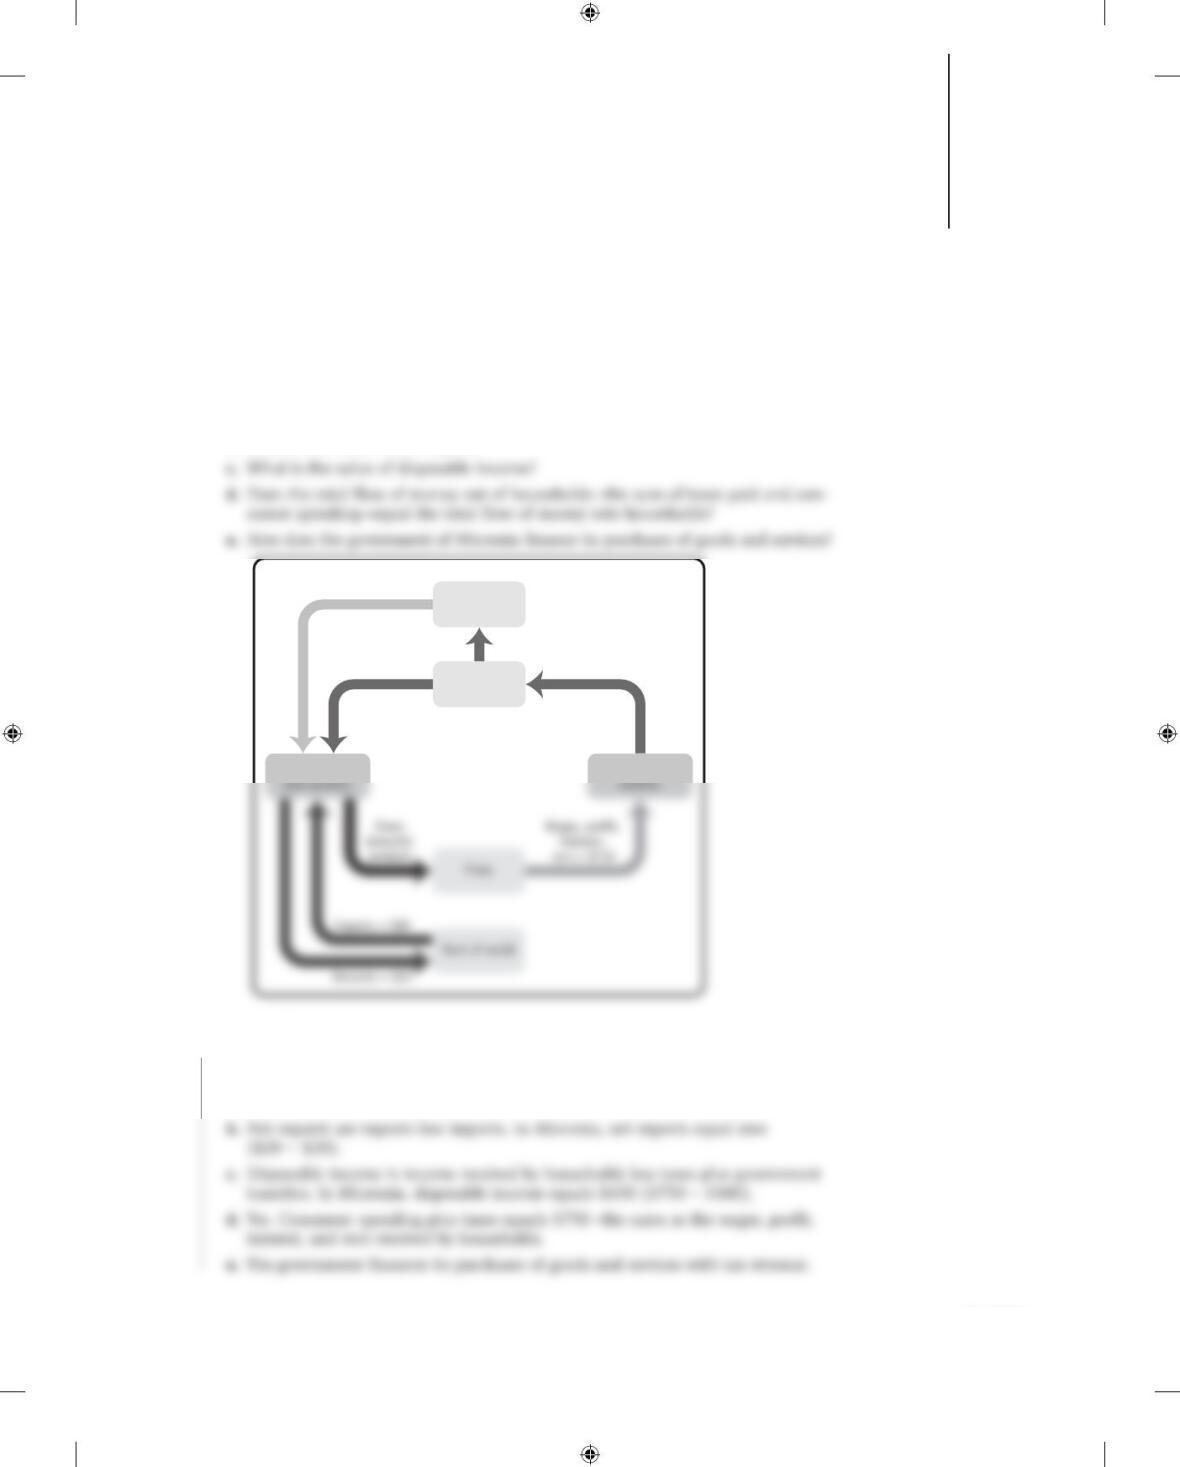
1. Below is a simplified circular-flow diagram for the economy of Micronia. (Note that
there is no investment spending in Micronia.)
a. What is the value of GDP in Micronia?
b. What is the value of net exports?
Government purchases of
goods and services = $100
Consumer
spending = $650
Wages,
profit,
interest,
rent = $750
Government
Households
Taxes = $100
Markets for goods
Factor
1. a. We can measure GDP in Micronia as the sum of all spending on domestically
produced final goods and services. Spending consists of consumer spending,
government purchases of goods and services, and exports less imports, or $750
($650 + $100 + $20 – $20).
CHAPTER
GDP and the CPI:
Tracking the Macroeconomy
S-299
722
ECONOMICS
MACROECONOMICS
KrugWellsECPS4e_Econ_CH22.indd S-299KrugWellsECPS4e_Econ_CH22.indd S-299 12/1/14 4:32 PM12/1/14 4:32 PM
S-300 CHAPTER 22 GDP AND THE CPI: TRACKING THE MACROECONOMY
Solution
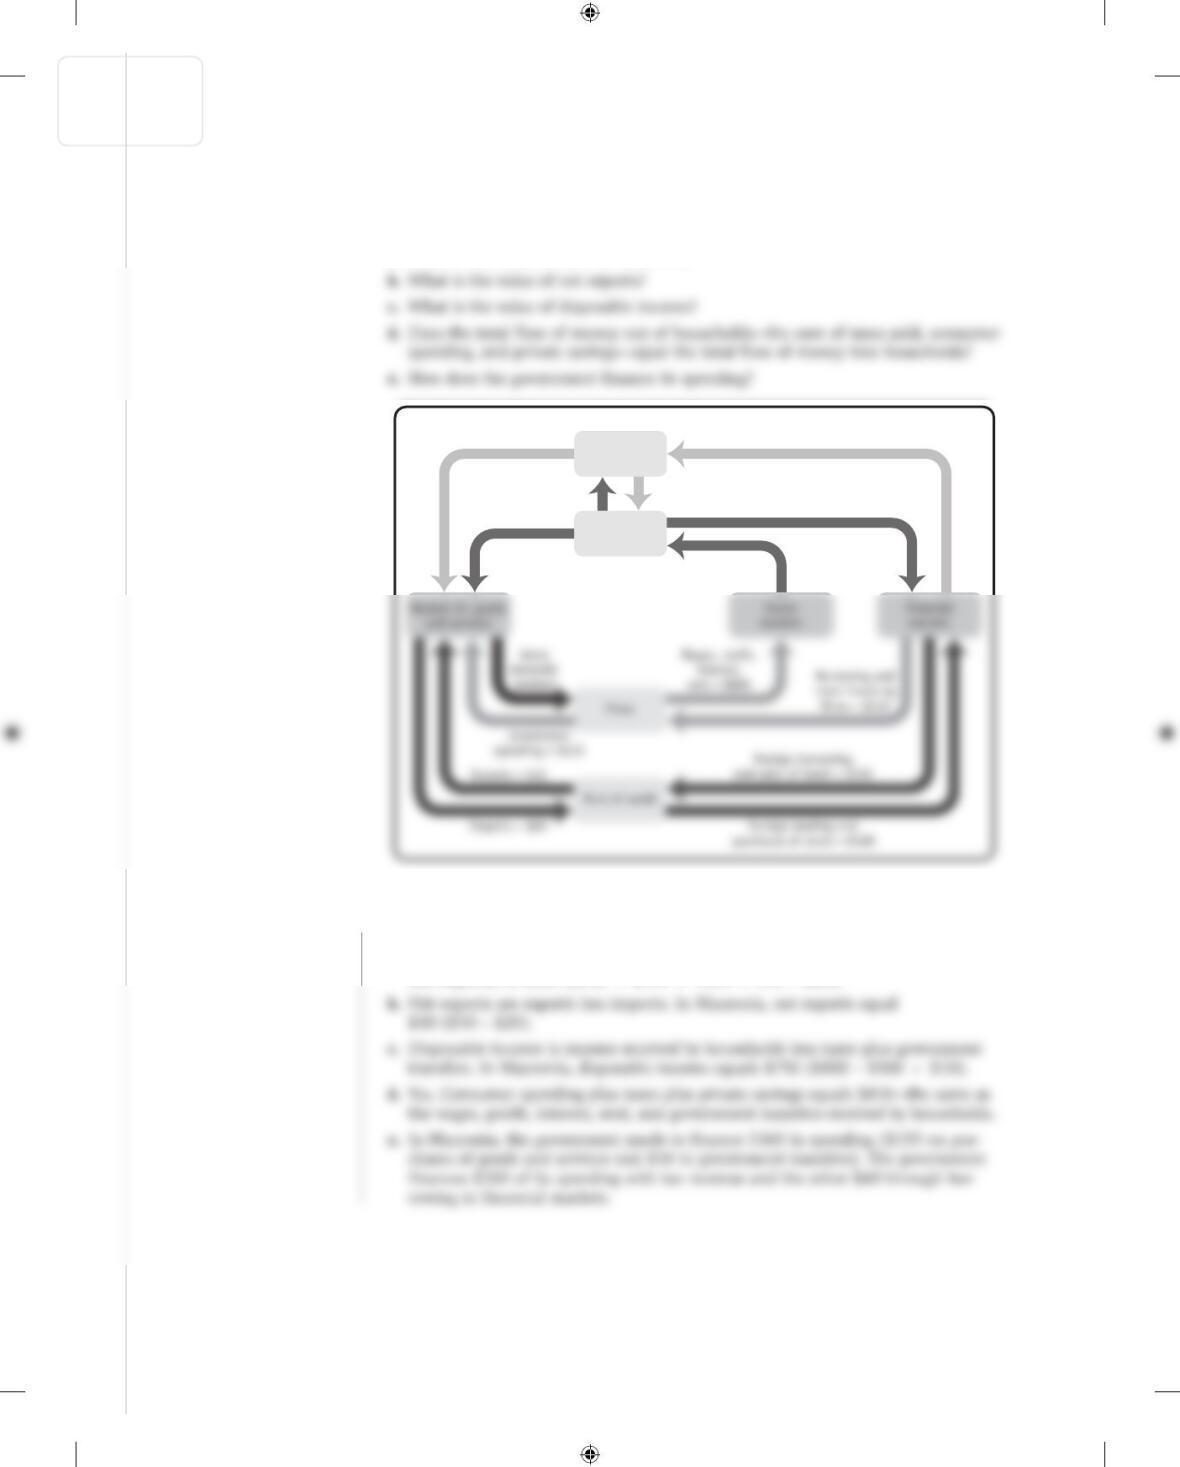
2. A more complex circular-flow diagram for the economy of Macronia is shown below.
(Note that Macronia has investment spending and financial markets.)
a. What is the value of GDP in Macronia?
Government purchases of
goods and services = $150 Government borrowing = $60
Consumer
spending = $510
Wages, profit,
interest,
rent = $800
Government
Households
Taxes = $100 Government transfers = $10
Private savings = $200
2. a. We can measure GDP in Macronia as the sum of all spending on domestically
produced final goods and ser vices. Spending consists of consumer spending,
investment spending, government purchases of goods and services, and exports
less imports, or $800 ($510 + $110 + $150 + $50 − $20).
KrugWellsECPS4e_Econ_CH22.indd S-300KrugWellsECPS4e_Econ_CH22.indd S-300 12/1/14 4:32 PM12/1/14 4:32 PM
CHAPTER 22 GDP AND THE CPI: TRACKING THE MACROECONOMY S-301
Solution
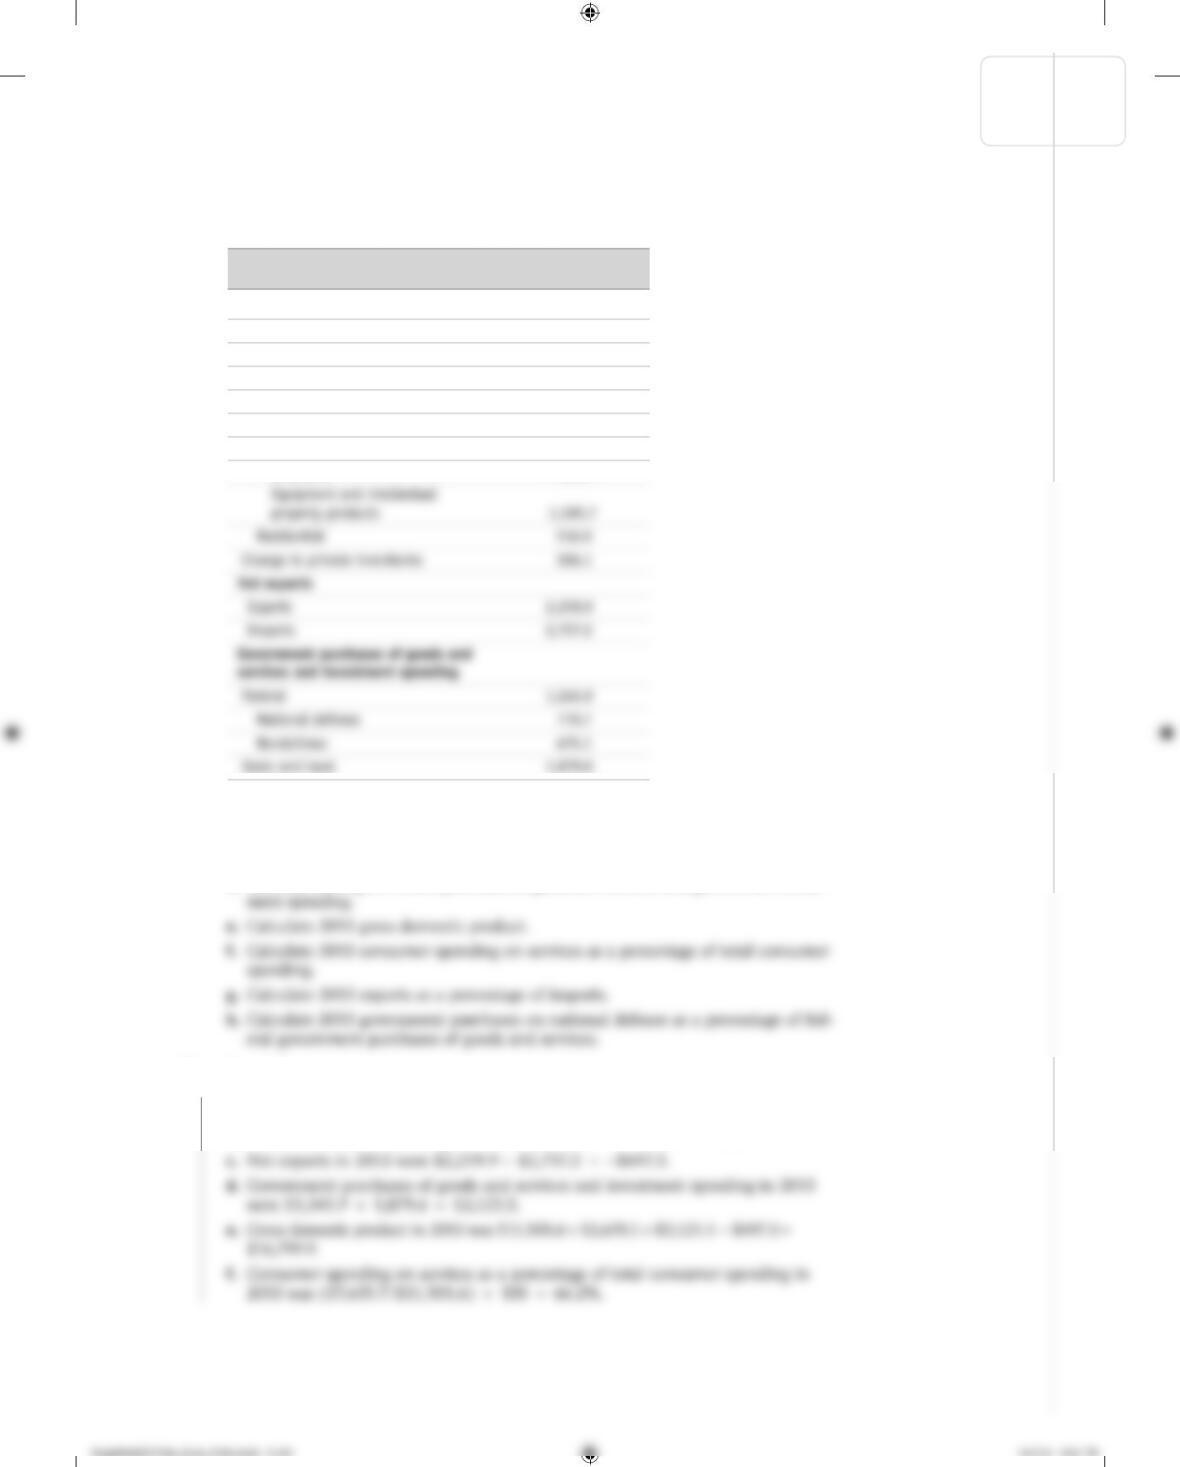
3. The components of GDP in the accompanying table were produced by the Bureau of
Economic Analysis.
a. Calculate 2013 consumer spending.
b. Calculate 2013 private investment spending.
c. Calculate 2013 net exports.
d. Calculate 2013 government purchases of goods and services and government invest-
3. All figures below are in billions of dollars.
a. Consumer spending in 2013 was $1,263.0 + $2,622.9 + $7,615.7 = $11,501.6.
b. Private investment spending in 2013 was $2.564.0 + $106.1 = $2,670.1.
Components of GDP in 2013
Category (billions of dollars)
Consumer spending
Durable goods $1,263.0
Nondurable goods 2,622.9
Services 7,615.7
Private investment spending
Fixed investment spending 2,564.0
Nonresidential 2,047.1
Structures 456.4
S-302 CHAPTER 22 GDP AND THE CPI: TRACKING THE MACROECONOMY
Solution
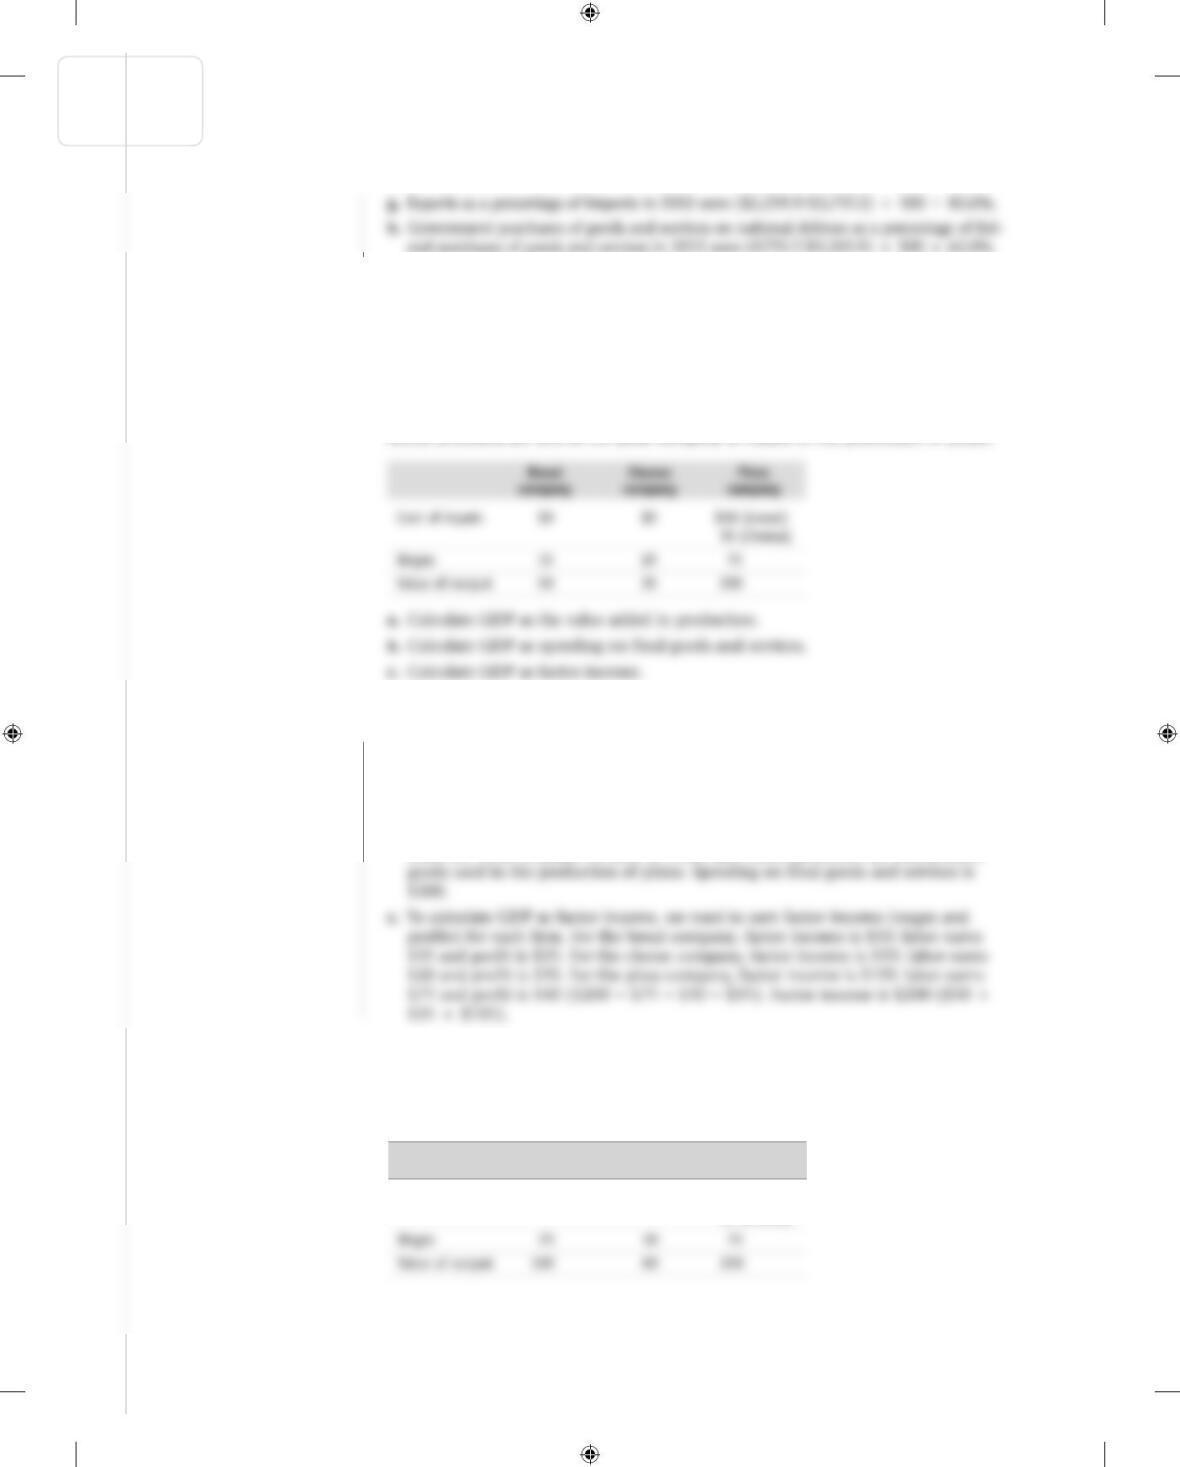
4. The small economy of Pizzania produces three goods (bread, cheese, and pizza), each
produced by a separate company. The bread and cheese companies produce all the
inputs they need to make bread and cheese, respectively. The pizza company uses the
bread and cheese from the other companies to make its pizzas. All three companies
employ labor to help produce their goods, and the difference between the value of
goods sold and the sum of labor and input costs is the firm’s profit. The accompany-
ing table summarizes the activities of the three companies when all the bread and
cheese produced are sold to the pizza company as inputs in the production of pizzas.
4. a. To calculate GDP as the value added in production, we need to sum all value
added (value of output minus the value of intermediate goods) for each company.
Value added in the bread company is $50; in the cheese company, $35; and in the
pizza company, $115 ($200 – $50 – $35). The total value added in production is
$200 ($50 + $35 + $115).
b. To calculate GDP as spending on final goods and services, we only need to in-
clude the value of pizzas because all bread and cheese produced are intermediate
5. In the economy of Pizzania (from Problem 4), bread and cheese produced are
sold both to the pizza company for inputs in the production of pizzas and to con-
sumers as final goods. The accompanying table summarizes the activities of the three
companies.
Bread Cheese Pizza
company company company
Cost of inputs $0 $0 $50 (bread)
35 (cheese)
KrugWellsECPS4e_Econ_CH22.indd S-302KrugWellsECPS4e_Econ_CH22.indd S-302 12/1/14 4:32 PM12/1/14 4:32 PM
CHAPTER 22 GDP AND THE CPI: TRACKING THE MACROECONOMY S-303
Solution
Solution
a. Calculate GDP as the value added in production.
5. a. To calculate GDP as the value added in production, we need to sum all value
added (value of output minus the value of intermediate goods) for each company.
Value added in the bread company is $100; in the cheese company, $60; and in
the pizza company, $115 ($200 – $50 – $35). The total value added in production
is $100 + $60 + $115 = $275.
b. To calculate GDP as spending on final goods and services, we need to sum the
6. Which of the following transactions will be included in GDP for the United States?
a. Coca - Cola builds a new bottling plant in the United States.
b. Delta sells one of its existing airplanes to Korean Air.
6. a. When Coca - Cola builds a new bottling plant, it is investment spending and
included in GDP.
b. If Delta sells one of its airplanes to Korean Air, this transaction is not included in
KrugWellsECPS4e_Econ_CH22.indd S-303KrugWellsECPS4e_Econ_CH22.indd S-303 12/1/14 4:32 PM12/1/14 4:32 PM
S-304 CHAPTER 22 GDP AND THE CPI: TRACKING THE MACROECONOMY
Solution
f. If a book publisher produces too many copies of a new book and the books don’t
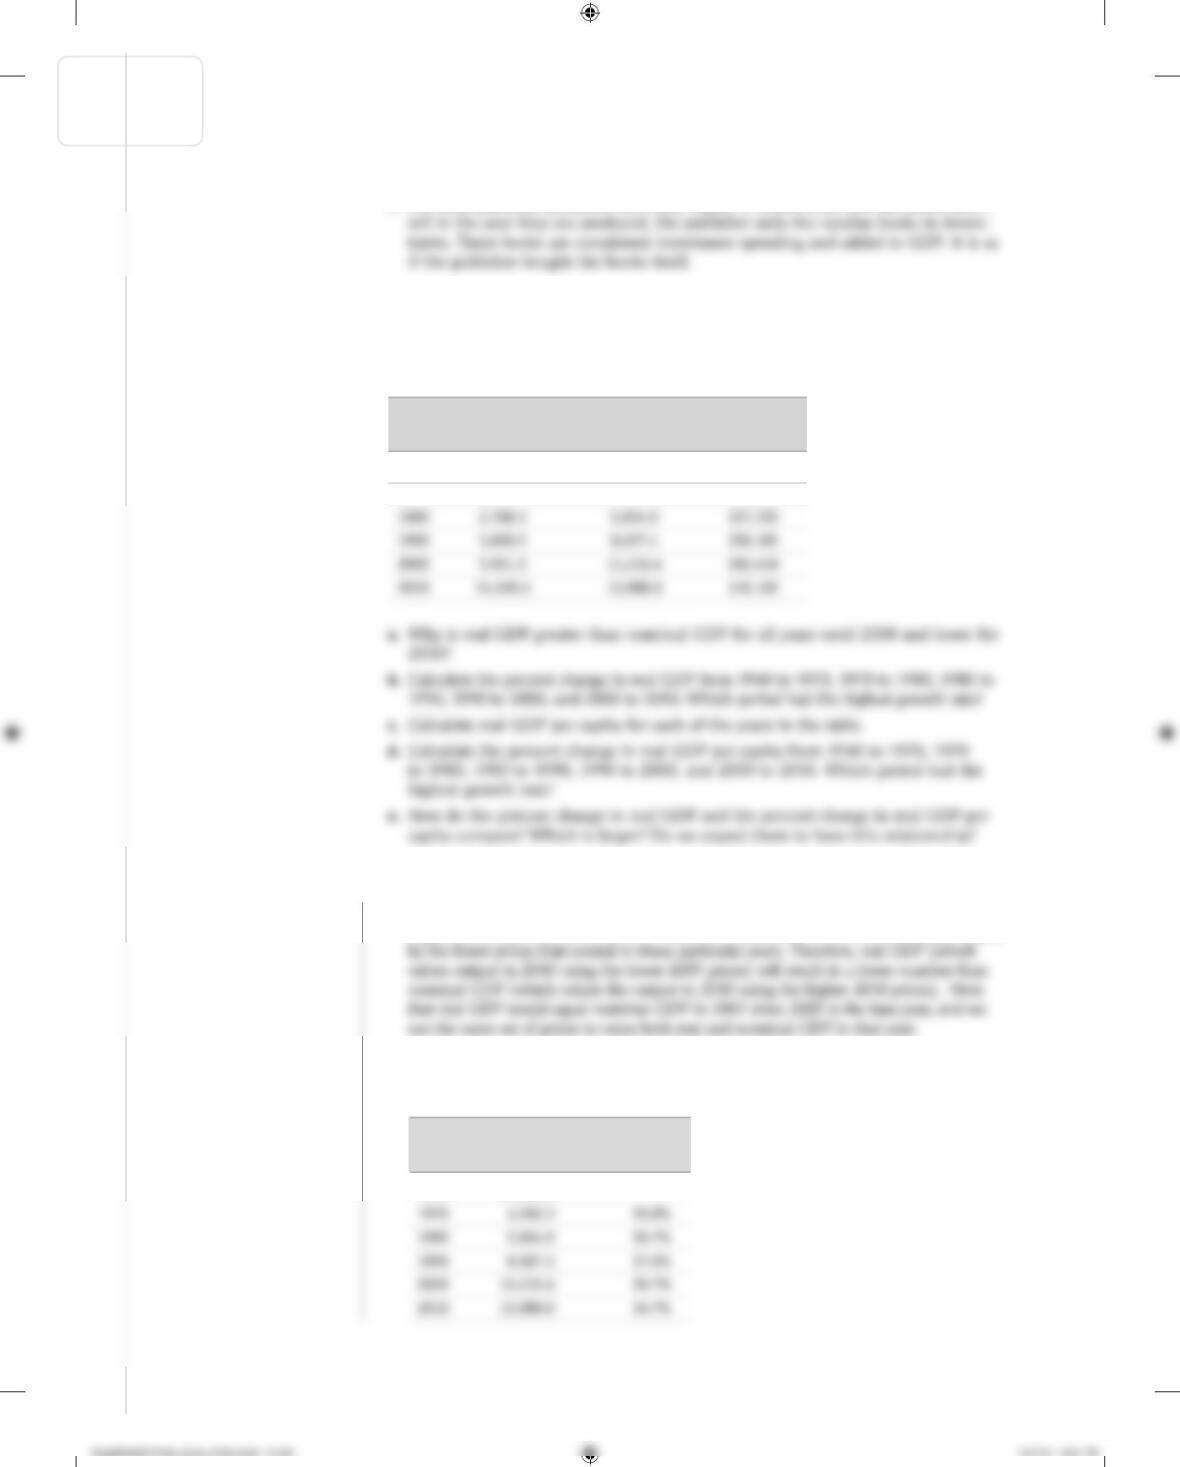
7. The accompanying table shows data on nominal GDP (in billions of dollars), real
GDP (in billions of 2005 dollars), and population (in thousands) of the United
States in 1960, 1970, 1980, 1990, 2000, and 2010. The U.S. price level rose consis-
tently over the period 1960–2010.
7. a. The base year is 2004, and from 1960 to 2005, prices rose. To calculate real GDP for
the years 1960, 1970, 1980, and 2000, we would multiply output in those years by the
higher prices that existed in 2005. To calculate nominal GDP, we would multiply output
b. The accompanying table shows the percent change in real GDP from 1960 to
1970, 1970 to 1980, 1980 to 1990, 1990 to 2000, and 2000 to 2010. The percent
change in real GDP was the highest during the 1960s.
Nominal GDP Real GDP
(billions of (billions of Population
Year dollars) 2005 dollars) (thousands)
1960 $526.4 $2,828.5 180,760
1970 1,038.5 4,266.3 205,089
Real GDP Percent
(billions of change in
Year 2005 dollars) real GDP
1960 $2,828.5
CHAPTER 22 GDP AND THE CPI: TRACKING THE MACROECONOMY S-305
Solution
c.
d. The years from 1960 through 1970 had the highest growth rate, as shown in the table.
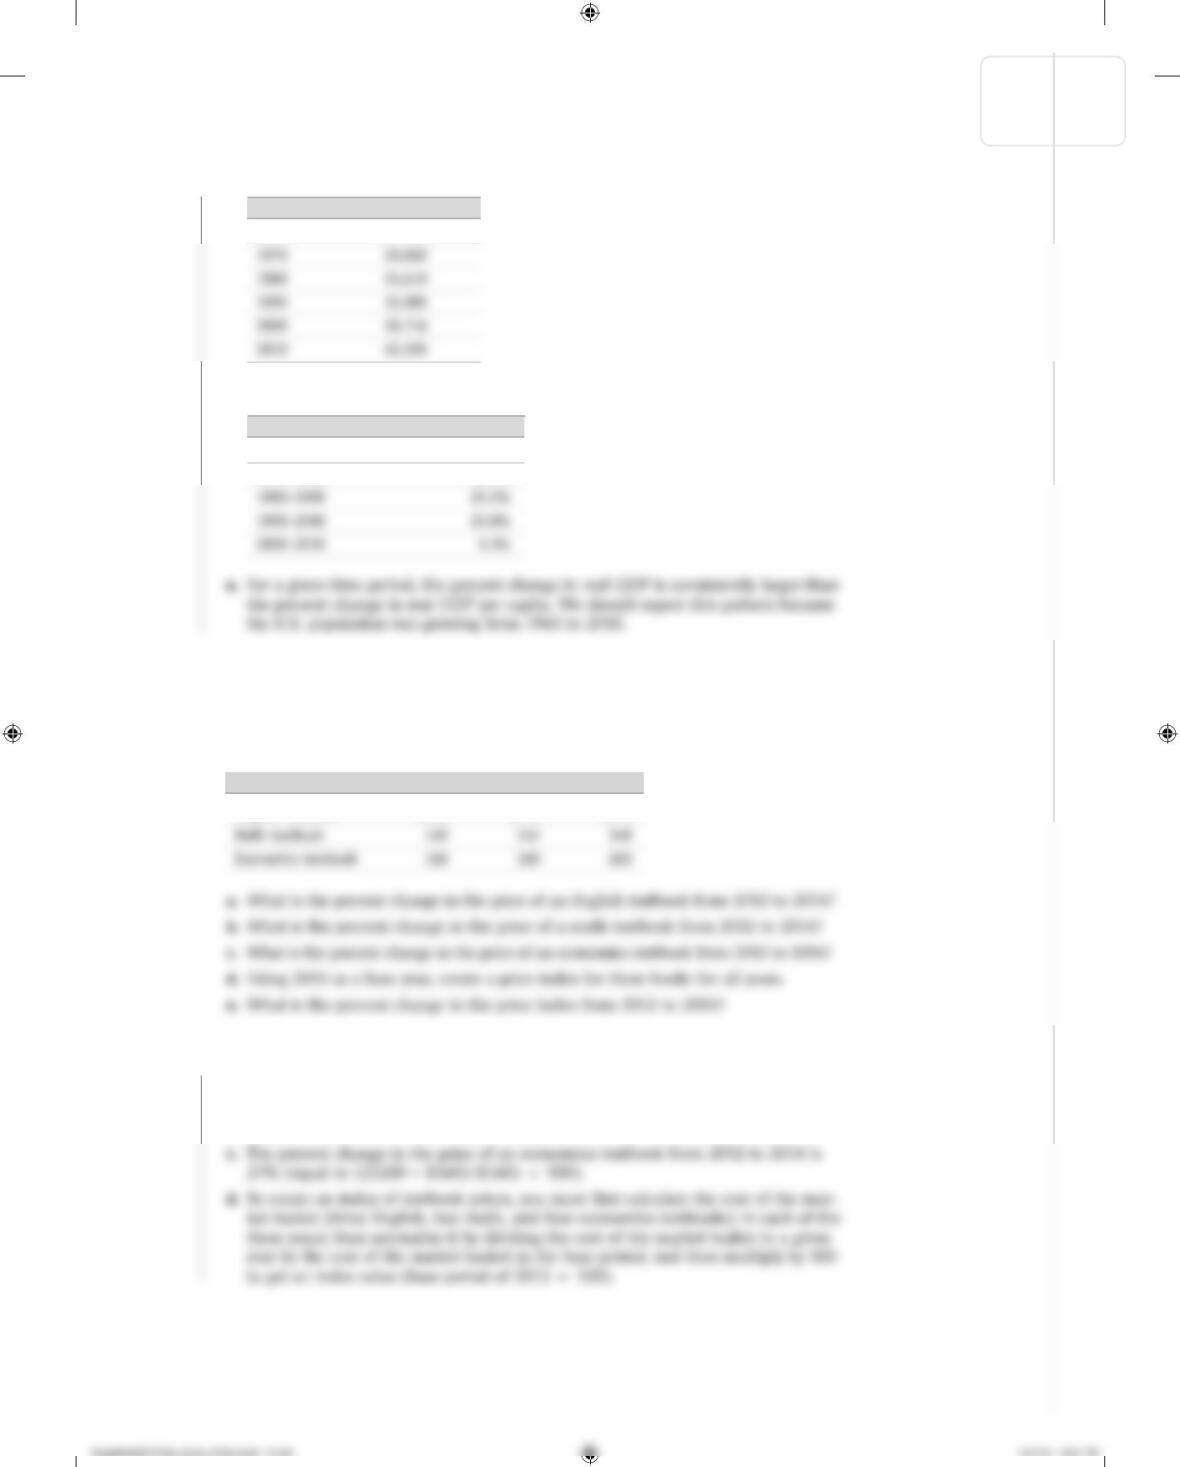
8. Eastland College is concerned about the rising price of textbooks that students must
purchase. To better identify the increase in the price of textbooks, the dean asks you,
the Economics Department’s star student, to create an index of textbook prices. The
average student purchases three English, two math, and four economics textbooks
per year. The prices of these books are given in the accompanying table.
8. a. The percent change in the price of an English textbook from 2012 to 2014 is
14.0% (equal to (($114 – $100)/$100) × 100).
b. The percent change in the price of a math textbook from 2012 to 2014 is 5.7%
(equal to (($148 – $140)/$140) × 100).
2012 2013 2014
English textbook $100 $110 $114
Real GDP per capita (2005 dollars)
1960 $15,648
Percent change in real GDP per capita
1960–1970 32.9%
1970–1980 23.2%
S-306 CHAPTER 22 GDP AND THE CPI: TRACKING THE MACROECONOMY
Solution
Cost of textbooks in 2012 = (3 × $100) + (2 × $140) + (4 × $160) =
$1,220
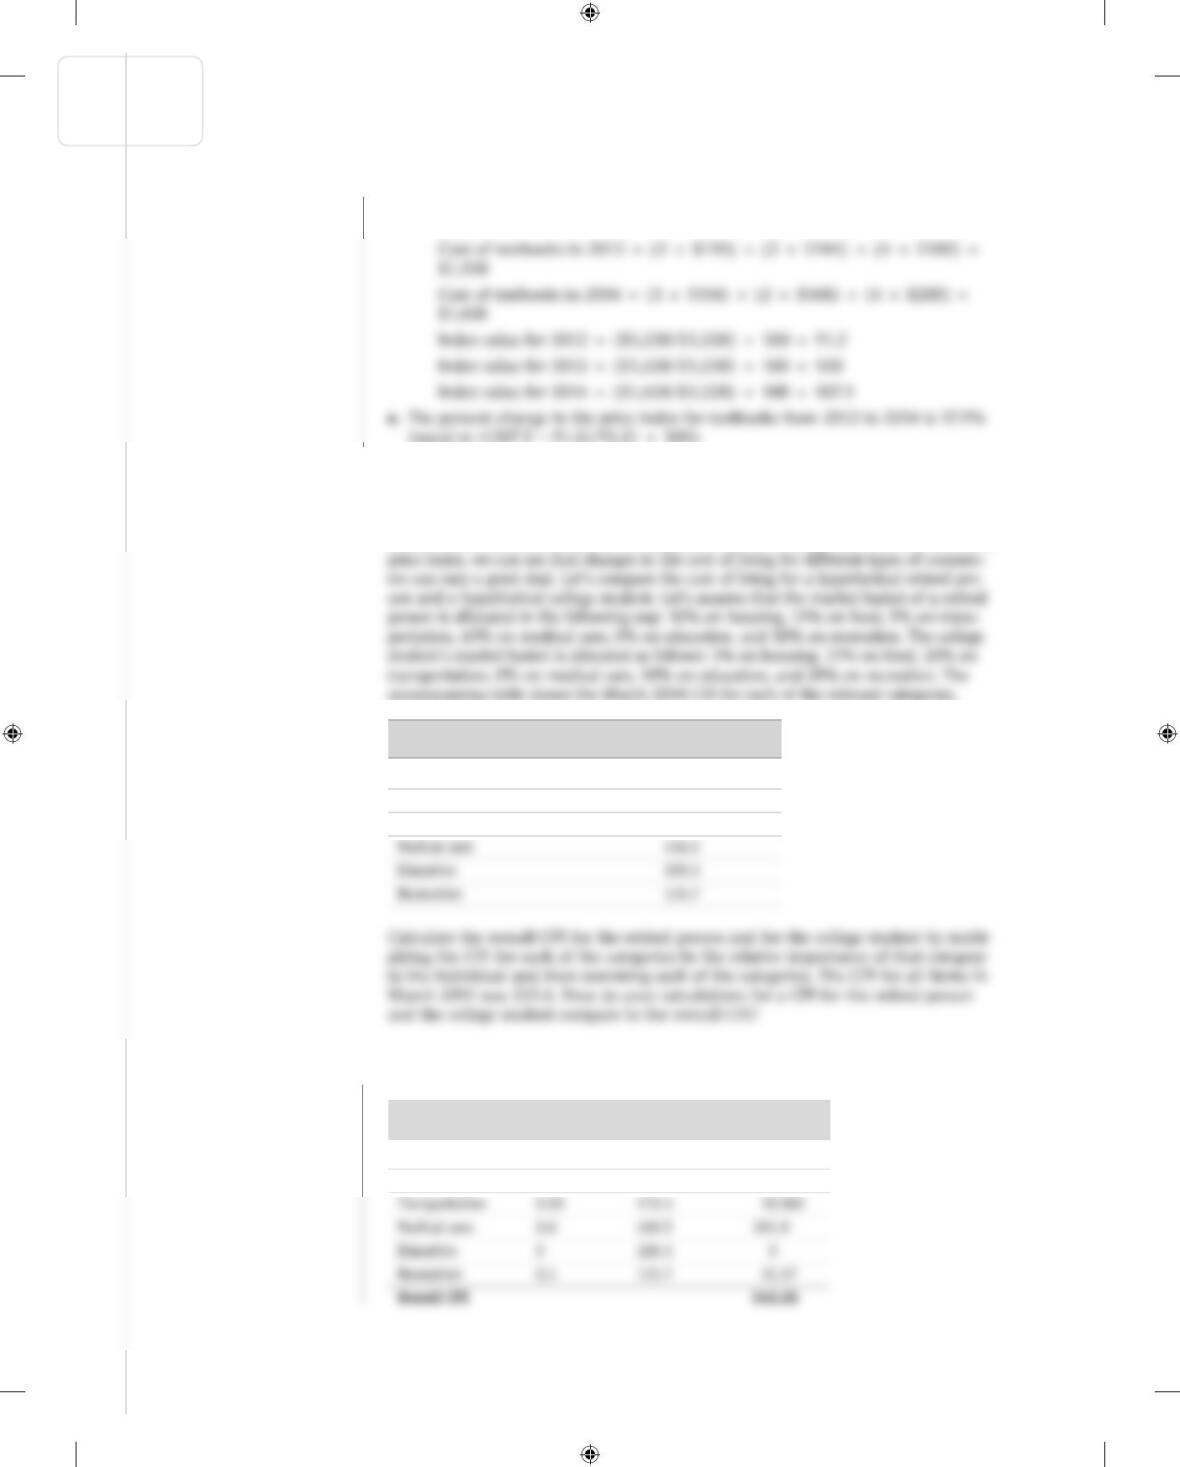
9. The consumer price index, or CPI, measures the cost of living for a typical urban house-
hold by multiplying the price for each category of expenditure (housing, food, and so
on) times a measure of the importance of that expenditure in the average consumer’s
market basket and summing over all categories. However, using data from the consumer
9. For the retired person:
CPI
March 2014
Housing 228.7
Food 239.7
Transportation 219.3
CPI CPI
Weight March 2014 Contribution
Housing 0.1 228.7 22.87
Food 0.15 239.7 35.955
KrugWellsECPS4e_Econ_CH22.indd S-306KrugWellsECPS4e_Econ_CH22.indd S-306 12/1/14 4:32 PM12/1/14 4:32 PM
CHAPTER 22 GDP AND THE CPI: TRACKING THE MACROECONOMY S-307
Solution
Solution
For the college student:
10. Go to The Bureau of Labor Statistics home page at www.bls.gov. Place the cursor over
the “Economic Releases” tab and then click on “Major Economic Indicators” in the
10. Answers will vary with the latest data. For July 2014, the CPI was 238.250; it rose 0.1%
from June 2014. The CPI was 2.0% higher than in July 2013.
11. The accompanying table provides the annual real GDP (in billions of 2009 dollars)
and nominal GDP (in billions of dollars) for the United States.
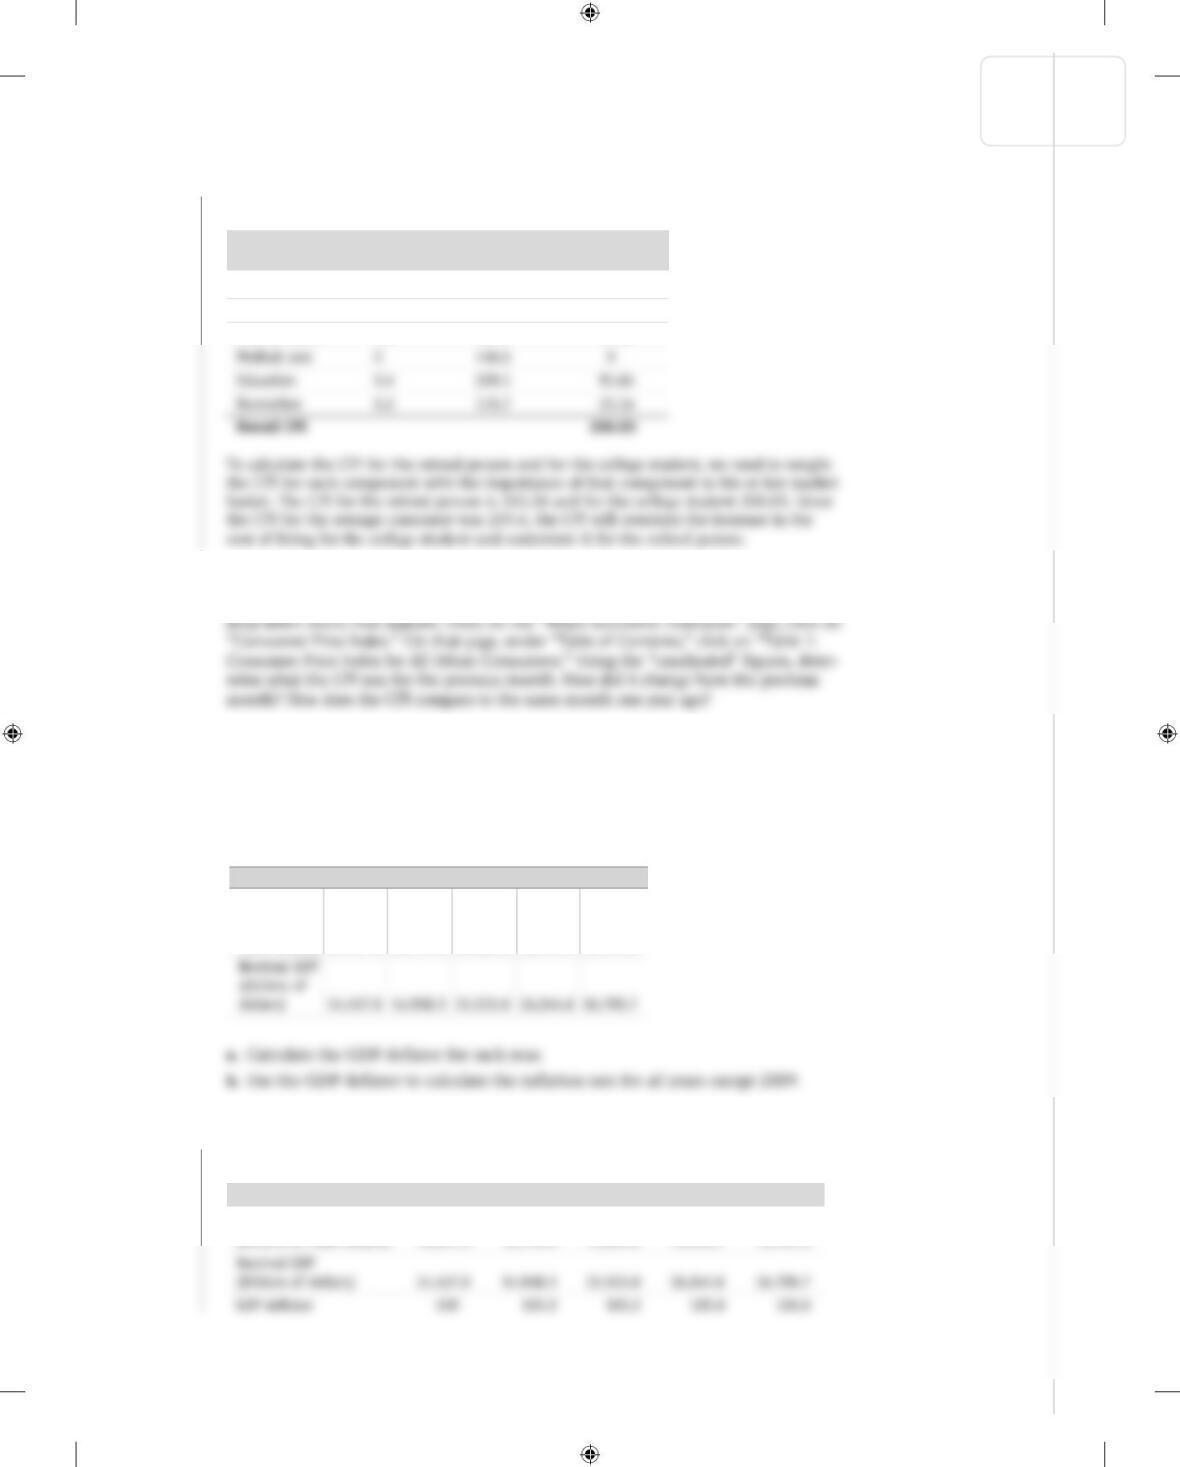
11. a. The GDP deflator in a given year is 100 times the ratio of nominal GDP to real
GDP, yielding the figures in the accompanying table.
2009 2010 2011 2012 2013
Real GDP
(billions of
2009 dollars) 14,417.9 14,779.4 15,052.4 15,470.7 15,761.3
CPI CPI
Weight March 2014 Contribution
Housing 0.05 228.7 11.435
Food 0.15 239.7 35.955
Transportation 0.2 219.3 43.86
2009 2010 2011 2012 2013
Real GDP
(billions of 2009 dollars) 14,417.9 14,779.4 15,052.4 15,470.7 15,761.3
KrugWellsECPS4e_Econ_CH22.indd S-307KrugWellsECPS4e_Econ_CH22.indd S-307 12/1/14 4:32 PM12/1/14 4:32 PM
S-308 CHAPTER 22 GDP AND THE CPI: TRACKING THE MACROECONOMY
Solution
b. The inflation rate obtained by using the GDP deflator is calculated using the for-
mula ((current GDP deflator – GDP deflator in the previous year)/(GDP deflator
in the previous year)) × 100, yielding the figures in the accompanying table.
12. The accompanying table contains two price indexes for the years 2011, 2012, and
2013: the GDP deflator and the CPI. For each price index, calculate the inflation rate
from 2011 to 2012 and from 2012 to 2013.
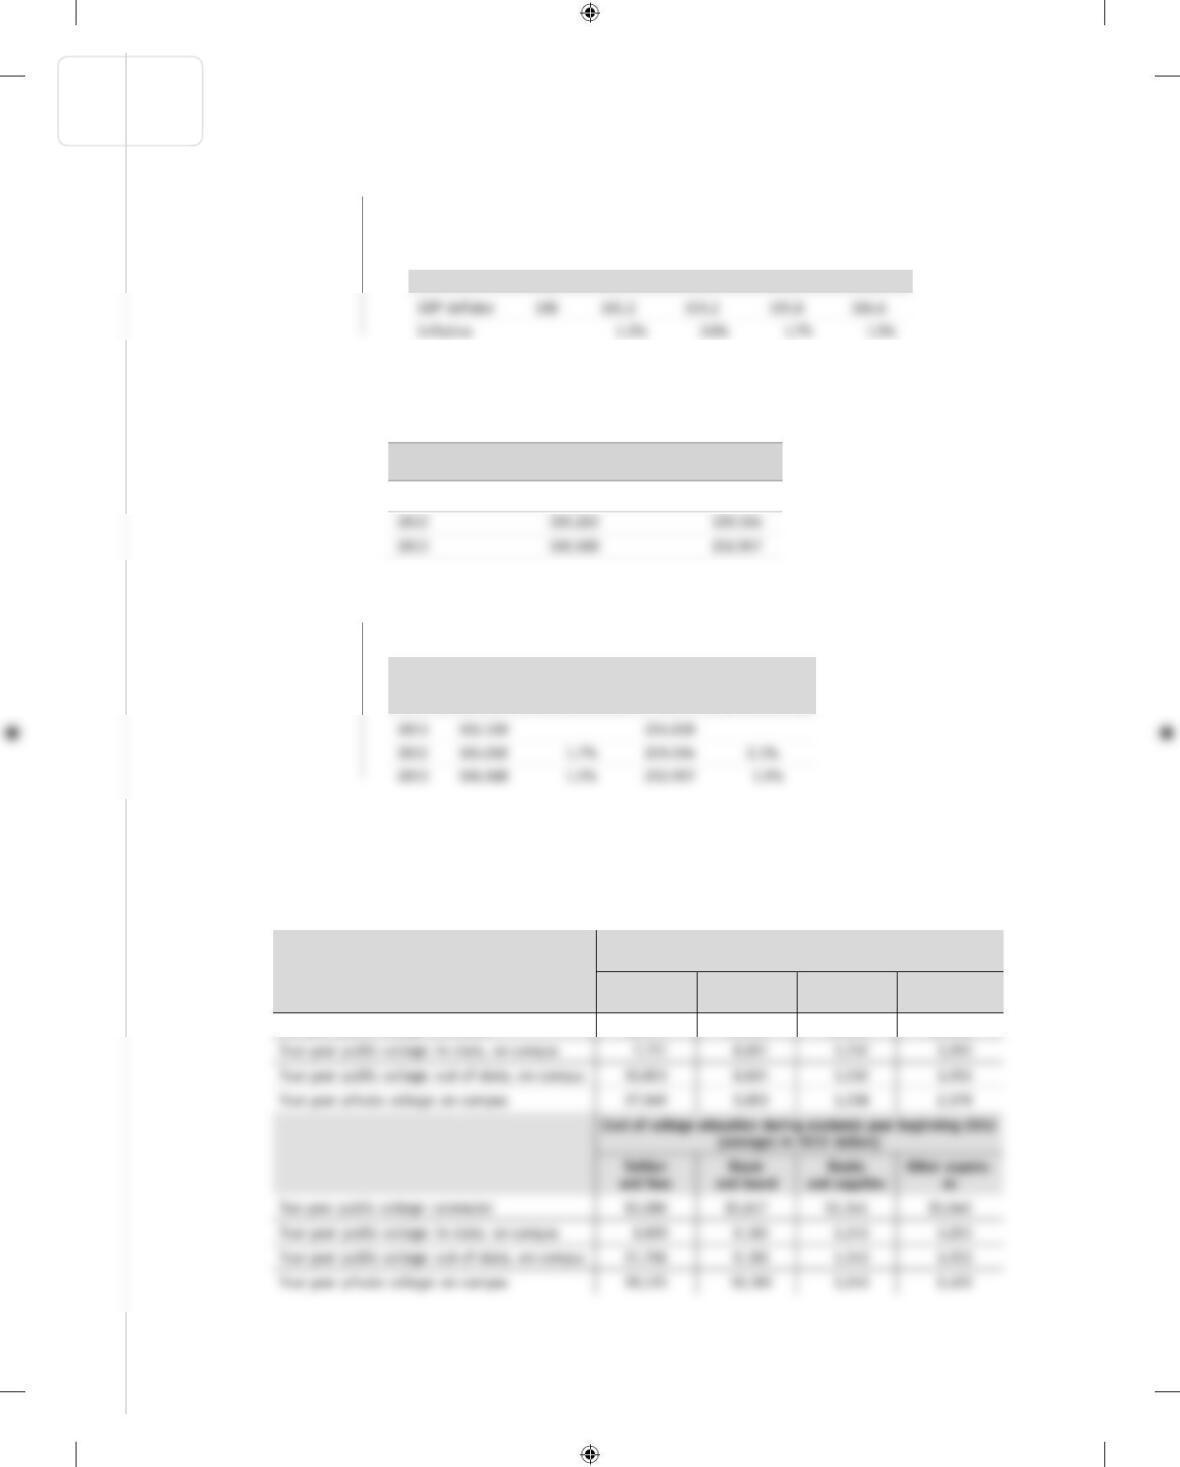
12. The accompanying table calculates the inflation rates based on the GDP deflator and
on the CPI.
13. The cost of a college education in the United States is rising at a rate faster than
inflation. The following table shows the average cost of a college education in the
United States during the academic year that began in 2011 and the academic year
that began in 2012 for public and private colleges. Assume the costs listed in the
table are the only costs experienced by the various college students in a single year.
GDP
Year deflator CPI
2011 103.199 224.939
Cost of college education during academic year beginning 2011
(averages in 2011 dollars)
Tuition
and fees
Room
and board
Books
and supplies
Other expens-
es
Two-year public college: commuter $2,970 $5,552 $1,314 $2,988
2009 2010 2011 2012 2013
Inflation rate
GDP (based on Inflation rate
Year deflator GDP deflator) CPI (based on CPI)
KrugWellsECPS4e_Econ_CH22.indd S-308KrugWellsECPS4e_Econ_CH22.indd S-308 12/1/14 4:32 PM12/1/14 4:32 PM
CHAPTER 22 GDP AND THE CPI: TRACKING THE MACROECONOMY S-309
Solution
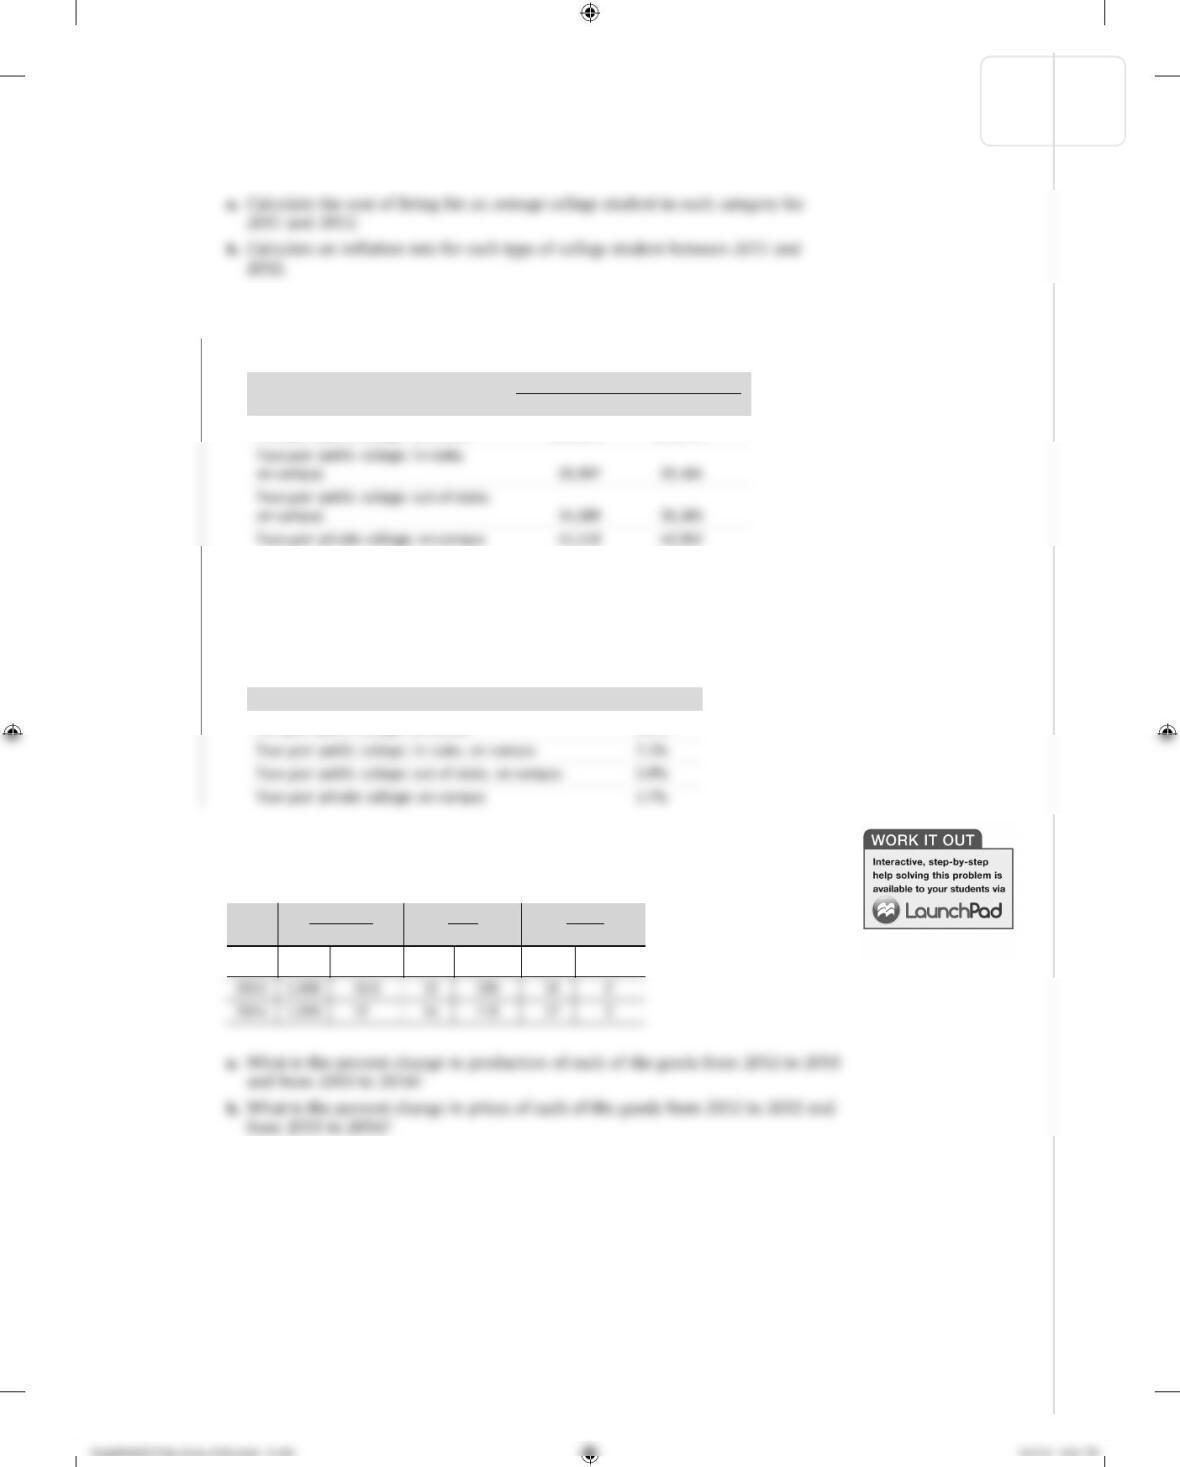
13. a. To calculate the cost of living, we add all the costs in each category. The cost of
living for each type of student is calculated in the accompanying table.
b. The inflation rate for each type of student is calculated as follows: ((price index
in 2012 − price index in 2011)/(price index in 2011)) × 100. Because each type
of student consumes the same goods and services in 2011 and 2012, the cost of
living can be used as a price index. Using the formula, the inflation rates are cal-
culated in the following table.
14. The economy of Britannica produces three goods: computers, DVDs, and pizza. The
accompanying table shows the prices and output of the three goods for the years
2012, 2013, and 2014.
c. Calculate nominal GDP in Britannica for each of the three years. What is the per-
cent change in nominal GDP from 2012 to 2013 and from 2013 to 2014?
d. Calculate real GDP in Britannica using 2012 prices for each of the three years. What
is the percent change in real GDP from 2012 to 2013 and from 2013 to 2014?
Computers DVDs Pizzas
Year Price Quantity Price Quantity Price Quantity
2012 $900 10 $10 100 $15 2
Average cost of attendance in dollars
2011 2012
Two-year public college: commuter $12,824 $13,278
Inflation rate
Two-year public college: commuter 3.5%


