12
Present Value $3,482.14 $3,109.06 $2,775.94 $2,478.52 $2,212.96 $1,975.86 $1,764.16
Total PV $5,446.43 $6,487.56 $7,108.24 $7,338.05 $7,116.91 $6,531.31 $5,654.98
ANSWER 7.10
The income statement and balance of XYZ company are shown in
Table 7.11 and Table 7.12 (in text), respectively. The income
statement and balance sheet of Superior Technologies are listed
in Table 7.A1 and 7.A2 (in text), respectively.
For the year 2002, the NOPAT for XYZ is -$36,000,000 and its
invested capital is $361,000,000 (=$434,000,000 – $73,000,000).
The Company’s EVA = -$36,000,000 – 0.1235* $361,000,000 =
-$80,583,500.
ANSWER 7.11
Since the income statement and balance sheet of Buffalo Best
are given, it is rather straight forward to compute the
financial ratios for the years involved. Table 7.38 lists the
results of 14 ratios which indicate liquidity, activity and
profitability, including applicable comments.
13
The company’s uses and sources of funds are studied using
data available in the income statement and balance sheet of the
years 2000-2001. The results are shown in Table 7.39.
TABLE 7.38. FINANCIAL RATIOS
1. Liquidity Year 2001 Year 2000 Comments
Current Ratio 0.674 0.628 Poor liquidity, with current ratio less than 2.0
and negative working capital
2. Activity
Collection Period (days) 300 212 Poor credit policy and accounts management
practices.
3. Profitability
Gross Margin to Sales Ratio 0.389 0.382 This ratio is reasonably good, indicating
adequate production cost management.
14
EBIT to Sales Ratio 0.111 0.106 Low ratio indicates a need for better controlling
company’s general expenses.
TABLE 7.39. FUNDS FLOW ANALYSIS
Funds Flow Analysis 2000 – 2001
Sources of Funds Percenage
Decrease in Cash & Securities $10,00,000 9.50%
Depreciation $10,00,000 9.50%
Use of Funds
Increase in Accounts Receivables 50,00,000 47.48%
Increase in Inventory 27,00,000 25.64%
The company’s EVA results are shown in Table 7.40.
TABLE 7.40. EVA ANALYSIS
EVA(2001) = -21,70,000
EVA(2000) = -24,60,000
ANSWER 7.12
Data given in this problem are cost items typically
contained in the income Statement as well as the funds flow
TABLE 7.41. INCOME STATEMENT
Sales 15,00,000
Manufacturing costs
Direct Materials 1,50,000
Direct Labor 2,00,000
Overhead 1,00,000
Net Income 4,08,000 Answer (c)
To determine the working capital requirement, the funds flow
statement must be constructed as shown in Table 7.42.
TABLE 7.42. FUNDS FLOW ANALYSIS
SOURCES OF FUNDS
Borrowing 2,00,000
16
TOTAL SOURCES 2,50,000
USES OF FUNDS
Equipment Purchase 4,00,000
TOTAL USES 5,40,000
The uses of funds exceed the sources by $290,000. This is the
amount which must be provided through working capital – Answer
(a).
ANSWER 7.13
In the absence of any debt, the company’s assets must be in
balance with its equity.
A. The net present value of this project is NPV = -110,000 + 210,000
= $100,000. This is the amount which will be added to the assets side
of the company balance sheet.
ANSWER 7.14
Let Ke = Cost of common equity
Kp = Cost of preferred equity
17
ANSWER 7.15
The contribution margin is defined as revenue minus cost of goods
sold divided by revenue.
ANSWER 7.16
Cash flow is defined as net income after tax plus depreciation.
Using the straight-line method, the annual depreciation is 93,000 =
ANSWER 7.17
The stock price of Superior Technologies is defined as follows:
A. Net Asset Value = Total asset – Total liability – Dividends for
preferred stocks.
18
C. Assume a P/E ratio of 10 for the industry.
Superior Technologies earning after preferred stock dividend =
14,143 – 3,265 = 10,878
Earning per common Share = EPS = 10,878/3,915 = 2.7785
Answer 7.18
The key data of Company A are summarized in Table 7.43.
TABLE 7.43 CAPTTAL STRUCTURE AND RELATED DATA
Capitalization ($ Million)
2003 2002 2001 2000 1999 1998
Long term debit 113 114 75 83 57 57
Preferred Stock 82 82 82 82 0 0
A. The company’s dividend payout ratio to common stock holders has
been in the range of 48% to 60%. It is apparent that the company
wants to provide a steady stream of dividends to stockholders in order
to keep them continuously interested in investing in the company.
Implicitly in this policy is the determination that it will be better
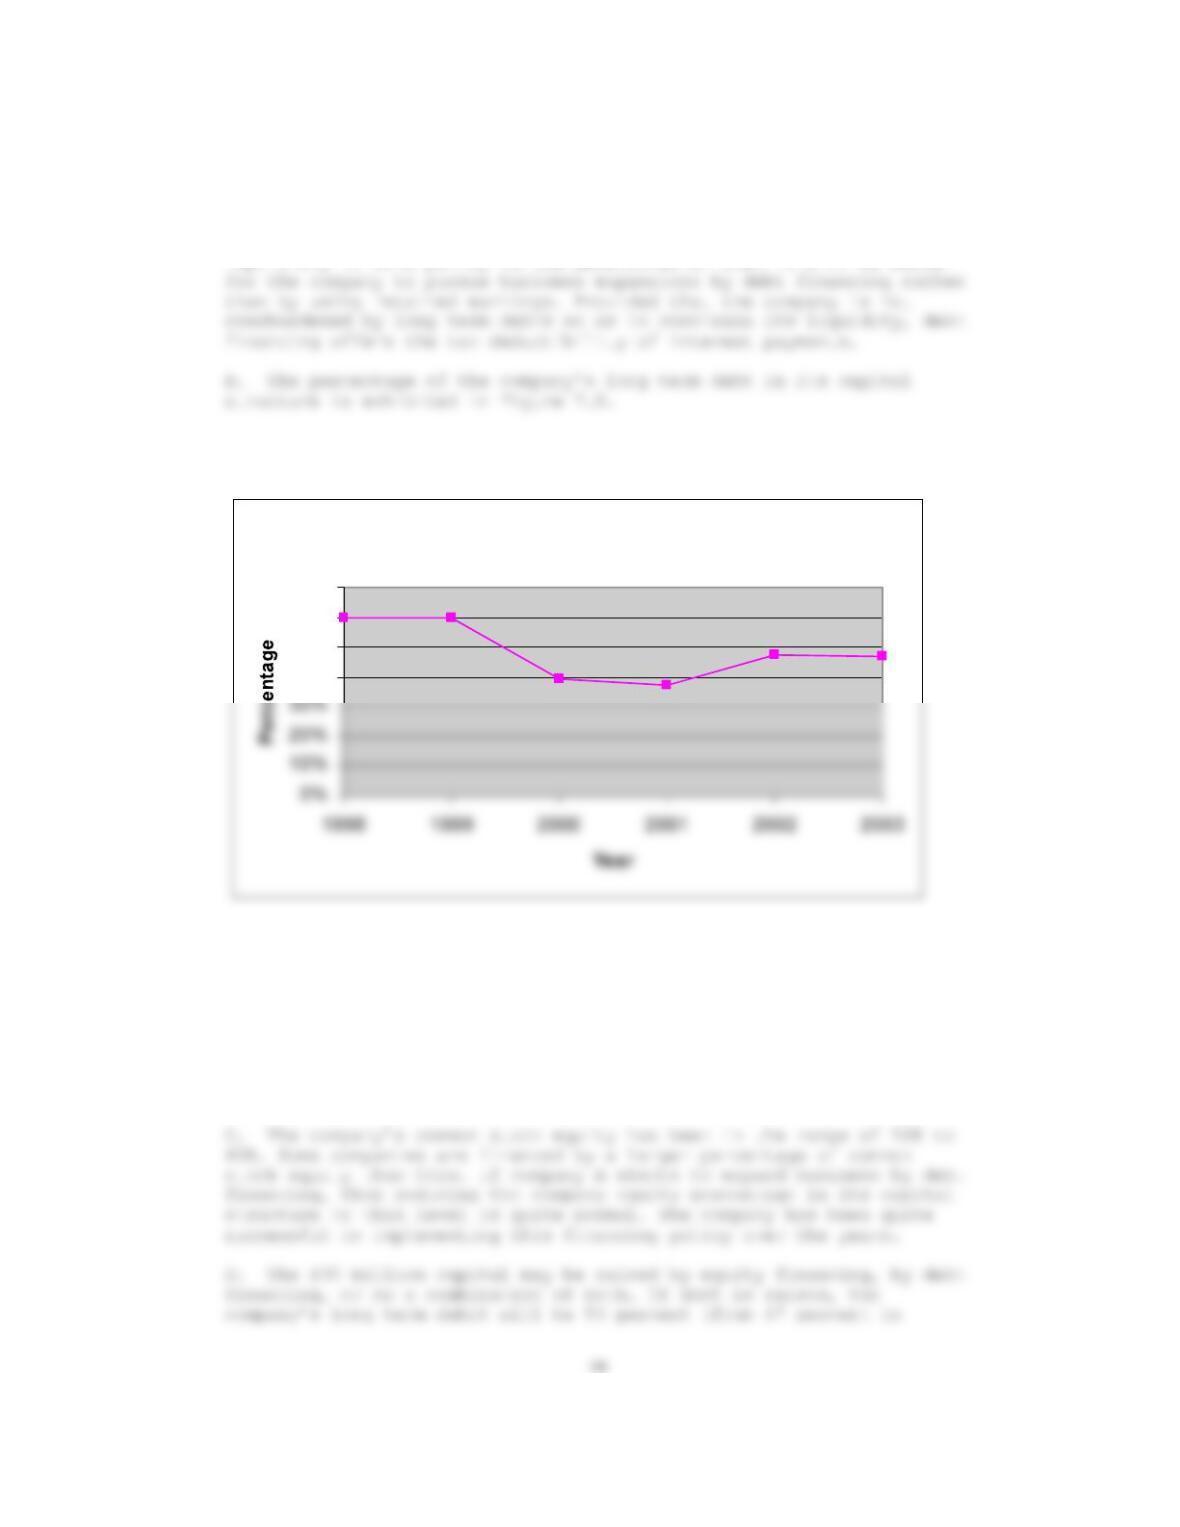
FIGURE 7.8 LONG TERM DEBT AS PERCENTAGE OF TOTAL CAPITAL
Long Term Debt as Perce ntage of Capitalization
40%
50%
60%
70%
The company’s long term debt has been in the range of 37 percent to 60
percent. The annual interest payment for the long term debt is still
reasonably small in comparison to the annual net income generated by
the company. Since long-term debt provides the benefit of the tax
deductibility for the interest payments, companies should acquire as
much long term debt as they can reasonably afford without losing their
financial flexibility. This is apparently the case here. The
percentage of the company’s long term debt in its capital structure
appears to be as expected.
20
ANSWER 7.19
This problem is centered on comparing the relative impact of
preferred stocks and long term debt on the company performance as
measured by the return on common stock equity. Table 7.44
delineates the calculations required to arrive at the target ratios.
TABLE 7.44 IMPACT OF ALTERNATIVE FINANCIING OPTIONS
Base Case Option A Option B
Capitalization $3,00,00,000 $3,00,00,000 $3,00,00,000
Common Stock Equity 3,00,00,000 60,00,000 60,00,000
Preferred Stock Equity 0 2,40,00,000 0
Long Term Debt 0 0 2,40,00,000
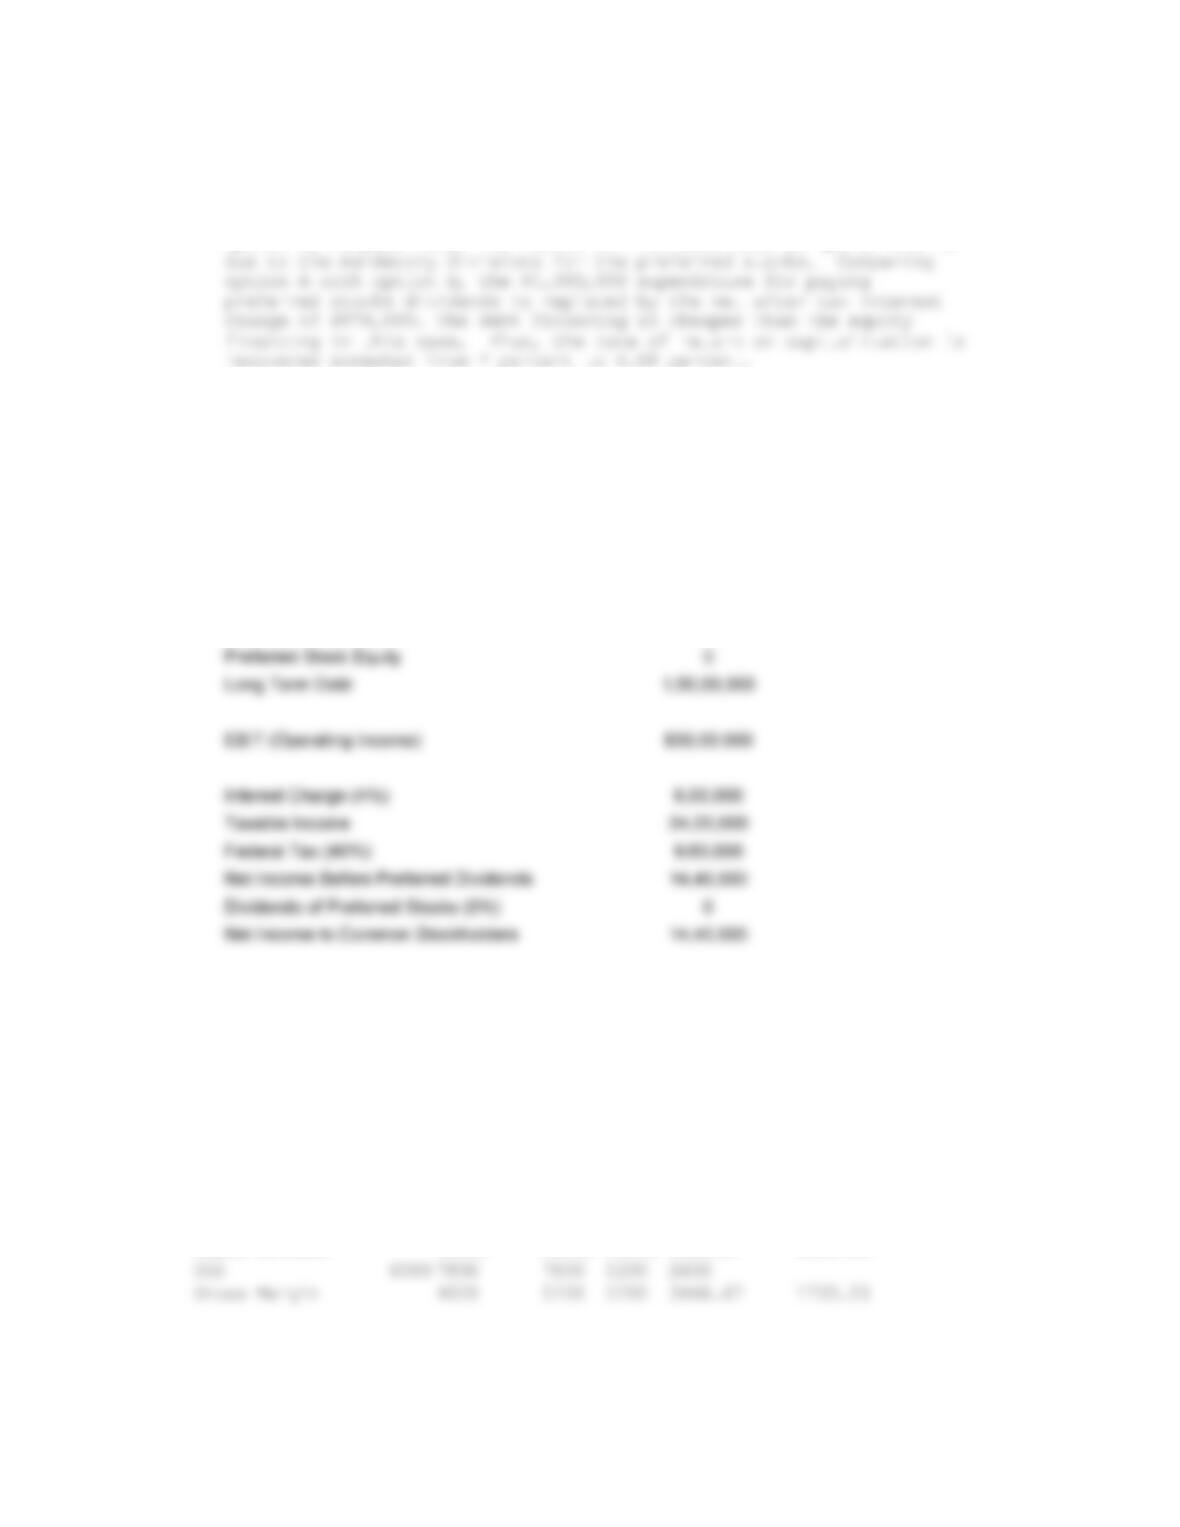
A. The return of common stock equity increases from 6 percent, to 10
percent and then to 20.4 percent. The increase from the base case to
option A is due to the smaller percentage of common stock equity in
the company’s capital structure. For the same company EBIT, each
common stock holder part-shares a larger percentage of the realized
net income. The increase from 10 percent to 20.4 percent from option
21
B. The rate of return on capitalization is changing from 6 percent,
to 2 percent and to 4.08 percent from the base case, option A and
option B, respectively. The reduction from base case to option one is
C. Among the three cases studied, none should be recommended to the
company. Instead, the company should pursue option C which limits the
long term debt to no more than 50 percent of capitalization. For such
a case the resulting return on common stock equity is 9.6 percent; see
Table 7.45.
TABLE 7.45 RECOMMENDED FINANCING OPTION
Option C
Capitalization $3,00,00,000
Common Stock Equity 1,50,00,000
Return on Capital 4.80%
Return on Common Stock Equity 9.60%
ANSWER 7.20
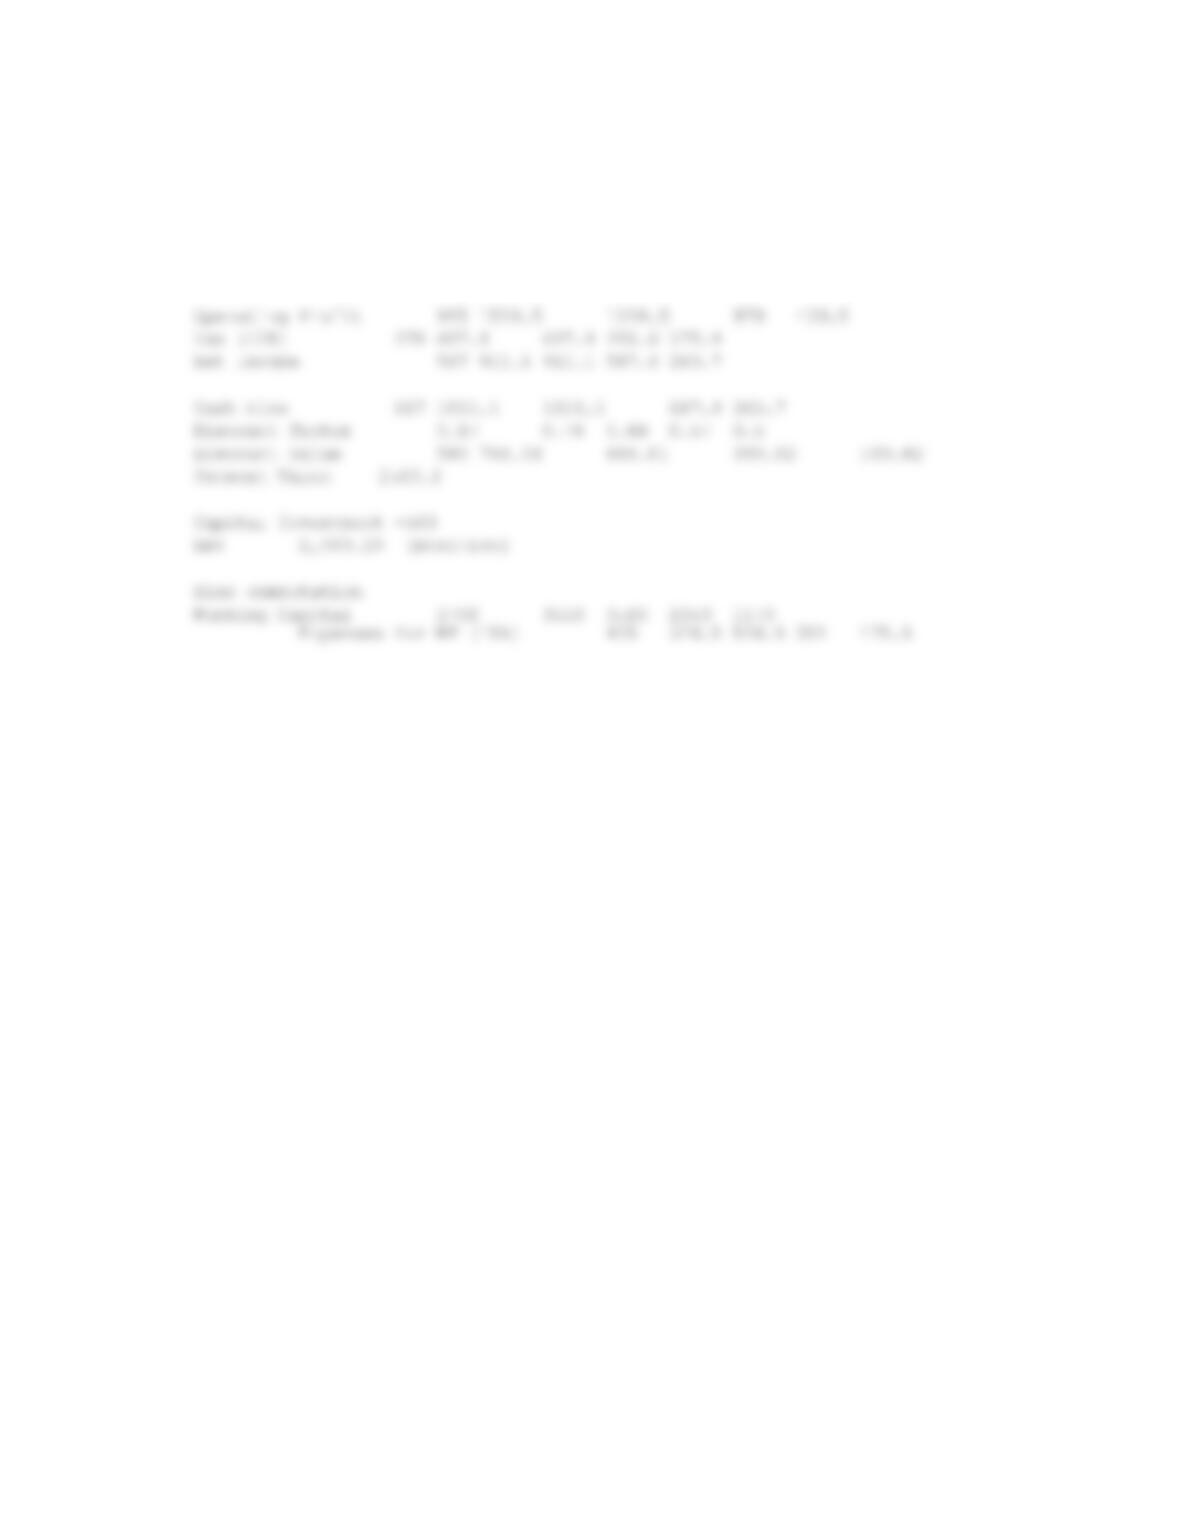
The multi-year income statement is contained in Table 7.46. The net
present value of the new service is estimated to be $ 2.08 Million.
The company should introduce the new service.
Table 7.46 Multi-Year Income Statement of Company X ($1000)
Items Present Year 1 Year 2 Year 3 Year 4 Year 5
Sales revenue 10000 13000 13000 8666.67 4333.33
22
SG&A 2350 3055 3055 2036.67 1018.33
Depreciation 100 100 100 100 100
Product Intro 200 0 0 0 0
Interest charges (WC) 405 526.5 526.5 351 175.5