1
ANSWERS TO CHAPTER 7 QUESTIONS
ANSWER 7.1
T-accounts are readily set up and the transactions a to q
are entered as follows:
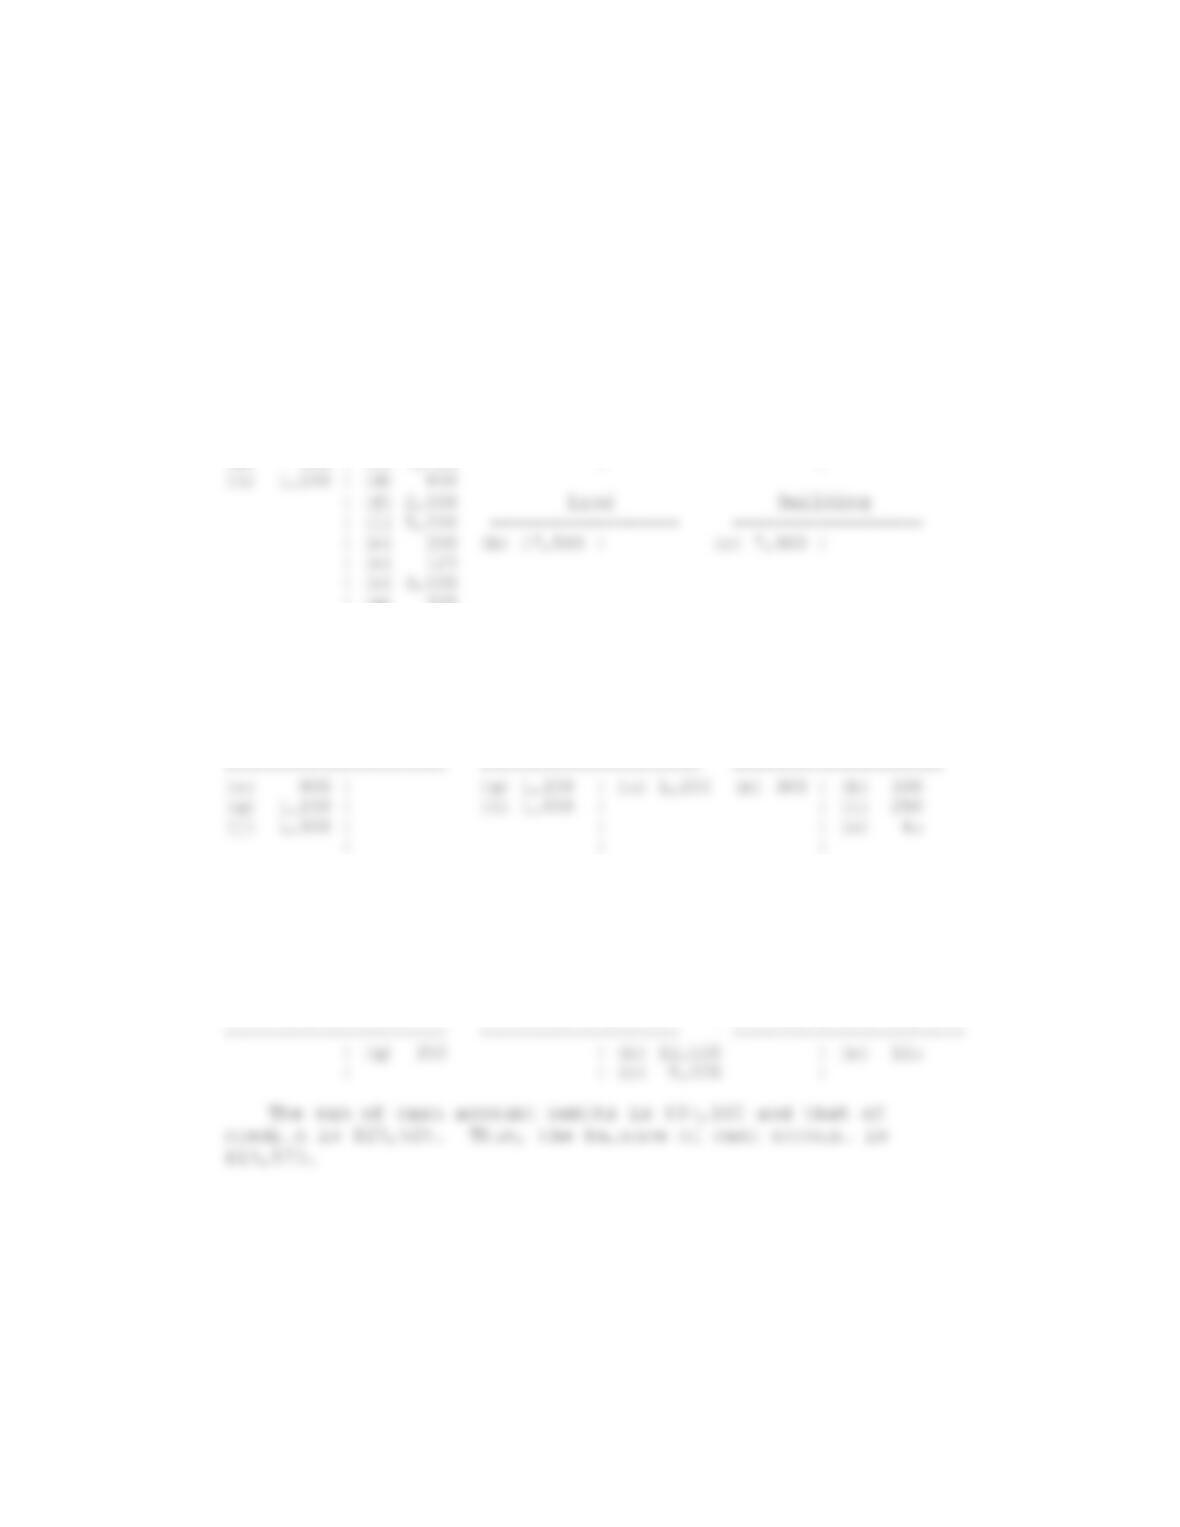
Jerry Brown Jerry Brown
Cash Withdrawals Capital
——————— ——–————- ——————
(a) 35,000 | (b) 5,000 (o) 65 | | (a) 59,700
(e) 900 | (c) 7,000 | |
| (q) 300
Office Supplies Test Equipment Special Machine Rental
——————— ——————- ———-———-
(h) 300 | (m) 300 (f) 10,000 | | (i) 250
| | |
Sales Revenue Accounts Receivable Accounts Payable
Prepaid Insurance Office Equipment Instrumentation
——————— ——————- ———-———-
(d) 800 | (a) 1,200 | (a) 23,500 |
| | |
Instrumentation
Maintenance Notes Payable Test Equipment Repairs
2
ANSWER 7.2
A funds flow analysis of XYZ Company is shown in Table
7.31.
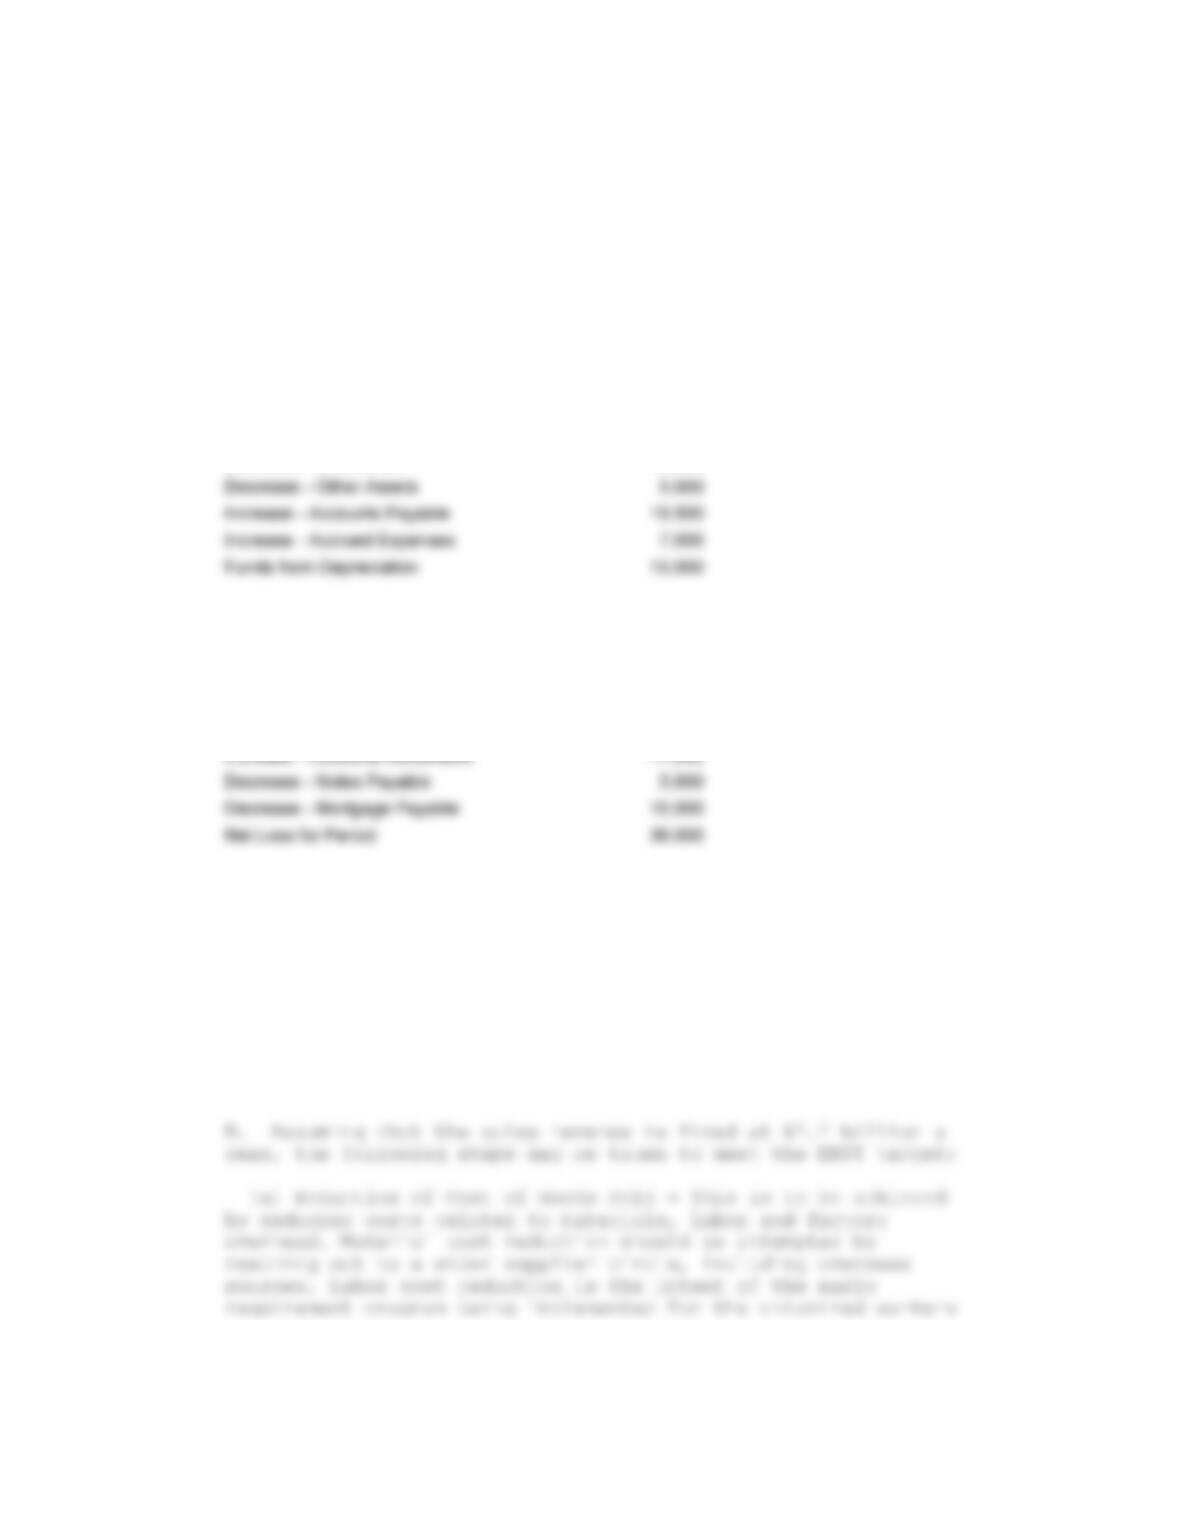
TABLE 7.31 FUNDS FLOW ANALYSIS
SOURCES OF FUNDS 2001 – 2002
Decrease – Marketable Securities 5,000
Decrease – Inventories 15,000
TOTAL SOURCES 63,500
USES OF FUNDS
Increase – Cash 1,500
TOTAL USES 63,500
ANSWER 7.3
There are a number of steps the XYZ Company management can
take to meet all three financial targets:
A. Acquire new customers and offer additional products to load
the plant more fully. This may be difficult to achieve in the
short term.
3
at the plant. Consolidating plant operations and reducing
management staff for factory operations should also be
considered.
(b) Reduction of Corporate Overhead – Overhead may be whittled
away by using one or more of the following tactics: (1) scaling
C. Take the following steps with respect to interest payment
and tax payables in order to achieve the net income target of
having 5 percent of sales revenue:
(a) Renegotiate for a term extension and/or a lower interest
rate for the current loans.
D. Take the following steps to reduce plant assets in order to
reach the set ROA target:
(a) Minimize inventory (e.g. number of products as well as
product cost per unit).
ANSWER 7.4
4
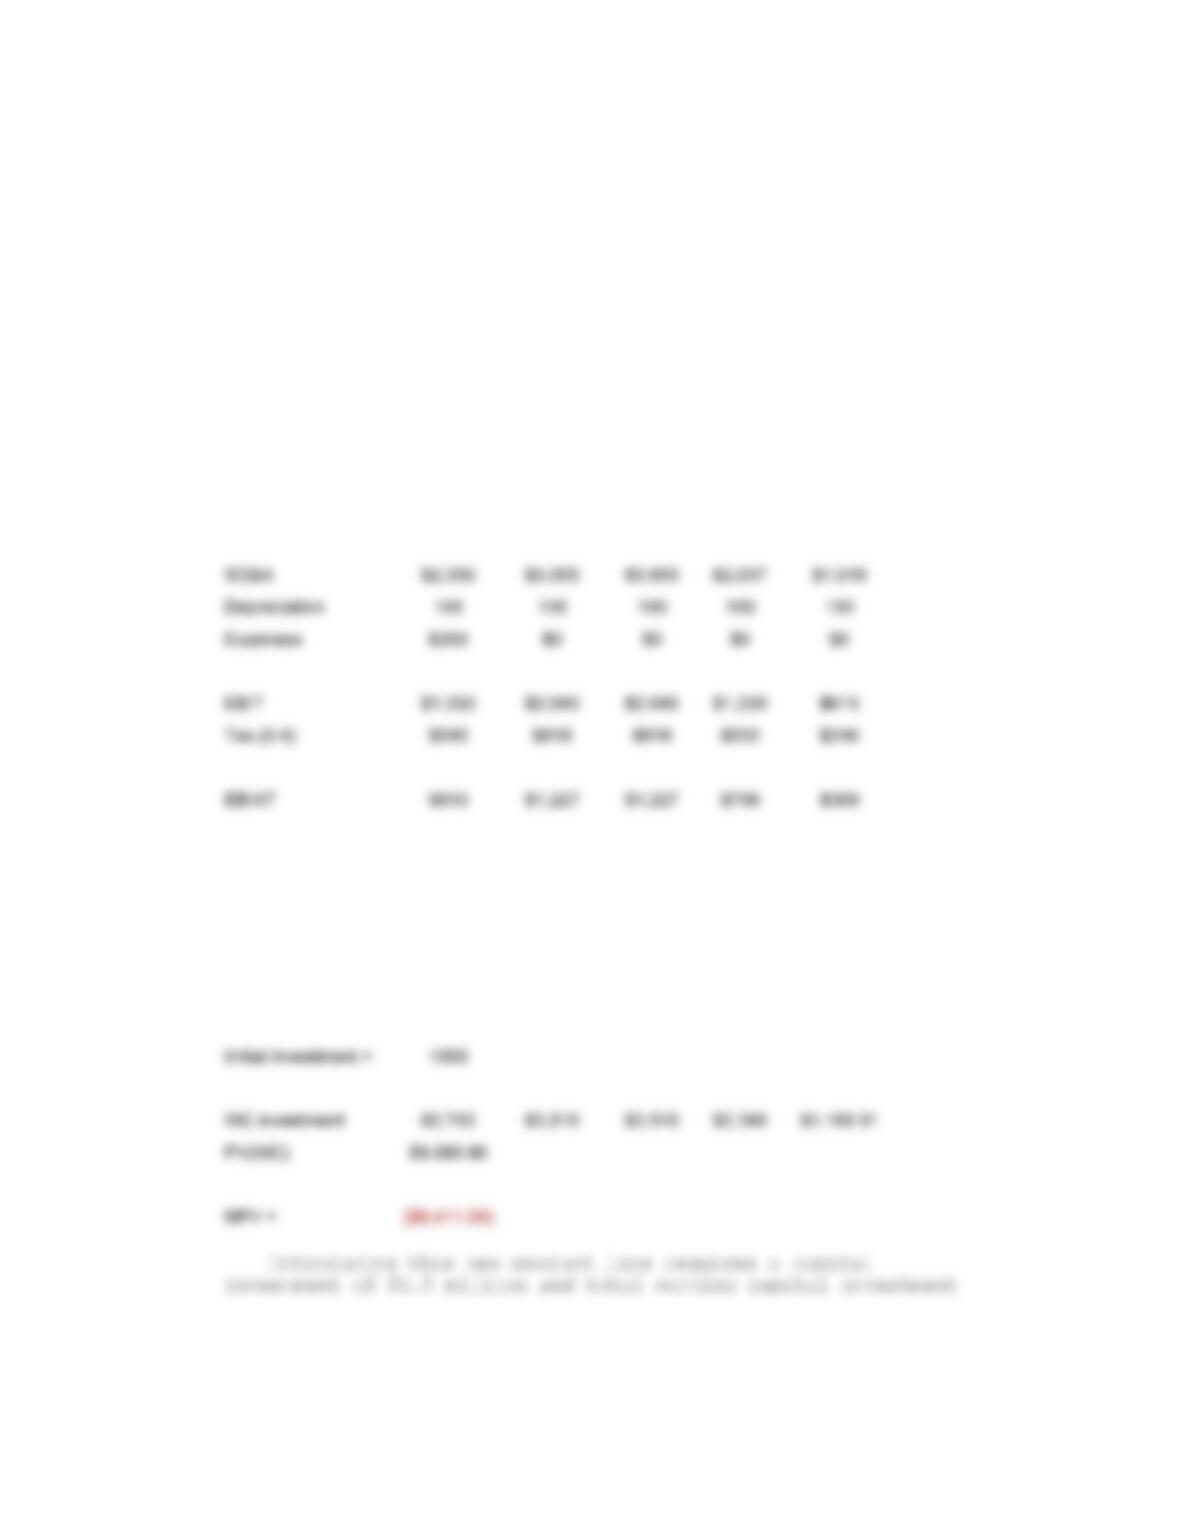
Table 7.32 presents the expected cash flow from year 1 to
year 5. Its present value is $3.07 million.
TABLE 7.32 MULTIYEAR INCOME STATEMENT
Interest Rate = 0.2
($ 000s)
Year 1 Year 2 Year 3 Year 4 Year 5
Sales $10,000 $13,000 $13,000 $8,667 $4,333
CGS $6,000 $7,800 $7,800 $5,200 $2,600
Gross Margin $4,000 $5,200 $5,200 $3,467 $1,733
Cash Flow $910 $1,327 $1,327 $898 $469
Present Values $758.33 $921.53 $767.94 $433.08 $188.47
PV (Cash Flows) $3,069.35
5
of $6.425 million over five years. Thus, the net present value
of this new product line is estimated to be -$4,855,680.
The new product line should not be introduced because of its
poor profitability.
ANSWER 7.5
The following equations are used to determine current assets
and working capital:
1. Increase in inventory: $ 10,000
Increase in accounts payable: $ 10,000
CR = 335 / 140 = 2.39 (down by 0.11)
WC = unchanged.
2. Increase in cash: $5,000
Decrease in accounts receivable: $5,000
5. Decrease in fixed assets: $80,000 (no effect)
Decrease in accumulated depreciation: $50,000 (no effect)
Decrease in surplus: 20,000 (no effect)
Increase in cash: 10,000
CR = 335/130 = 2.58 (up by 0.08)
WC = $205,000 (up by $10,000)
6. Decrease in cash: $10,000
7. Increase in cash: $10,000
Increase in note payable: 30,000
8. Decrease in inventories: $7,000
Decrease in organizational expense: $5,000 (no effect)
Decrease in surplus 12,000 (no effect)
CR = 318/130 = 2.45 (down by 0.5)
WC = $188,000 (down by $7,000)
9. Decrease in profit & loss: $12,000 (no effect)
Decrease in cash: 15,000
10. Increase in accounts receivable: $41,667
Decrease in inventory: 25,000
CR = 341,667/130,000 = 2.62 (up by 0.12)
WC = $211,667 (up by $16,667)
ANSWER 7.6
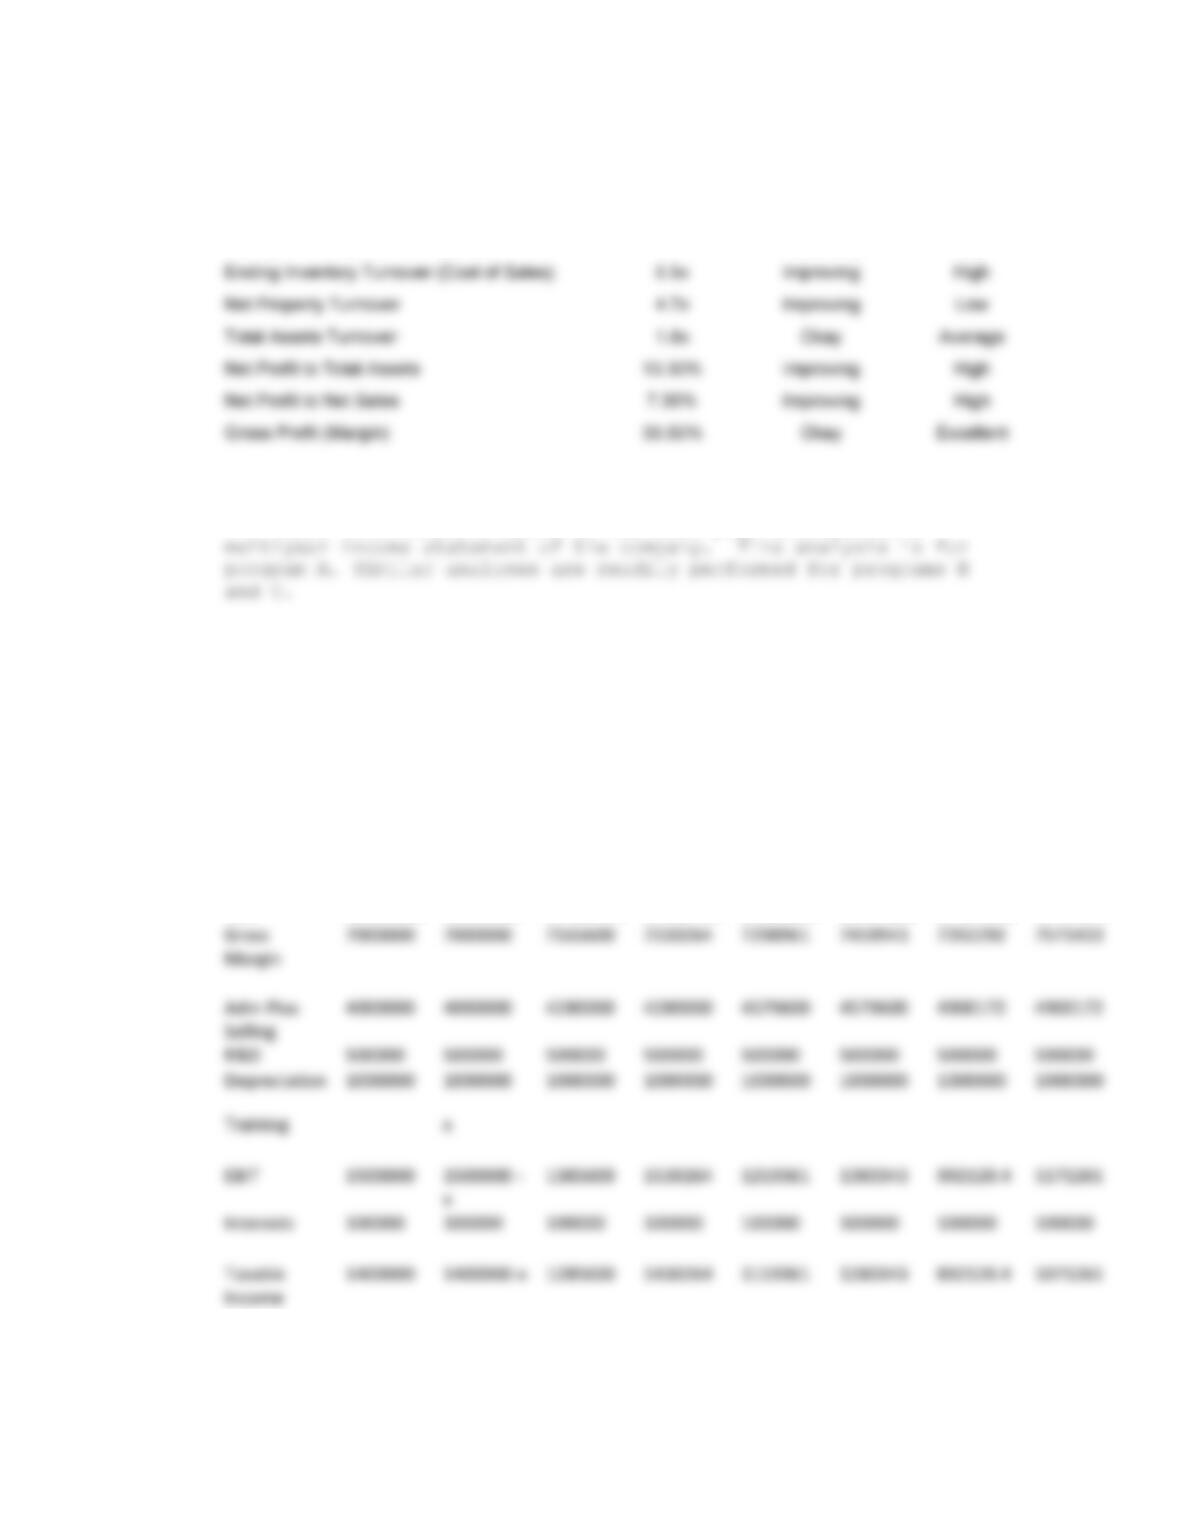
The performance ratios for Superior Technologies (2002) are
shown in Table 7.33. Internal benchmarking refers to the
TABLE 7.33 PERFORMANCE RATIOS
Superior Technologies Internal External
Year 2002 Benchmarking Benchmarking
Current Ratio 1.7 Low Low
7
Days Receivables 54.1 Days Improving High
Ending Inventory Turnover (Sales) 8.3x Improving High
ANSWER 7.7
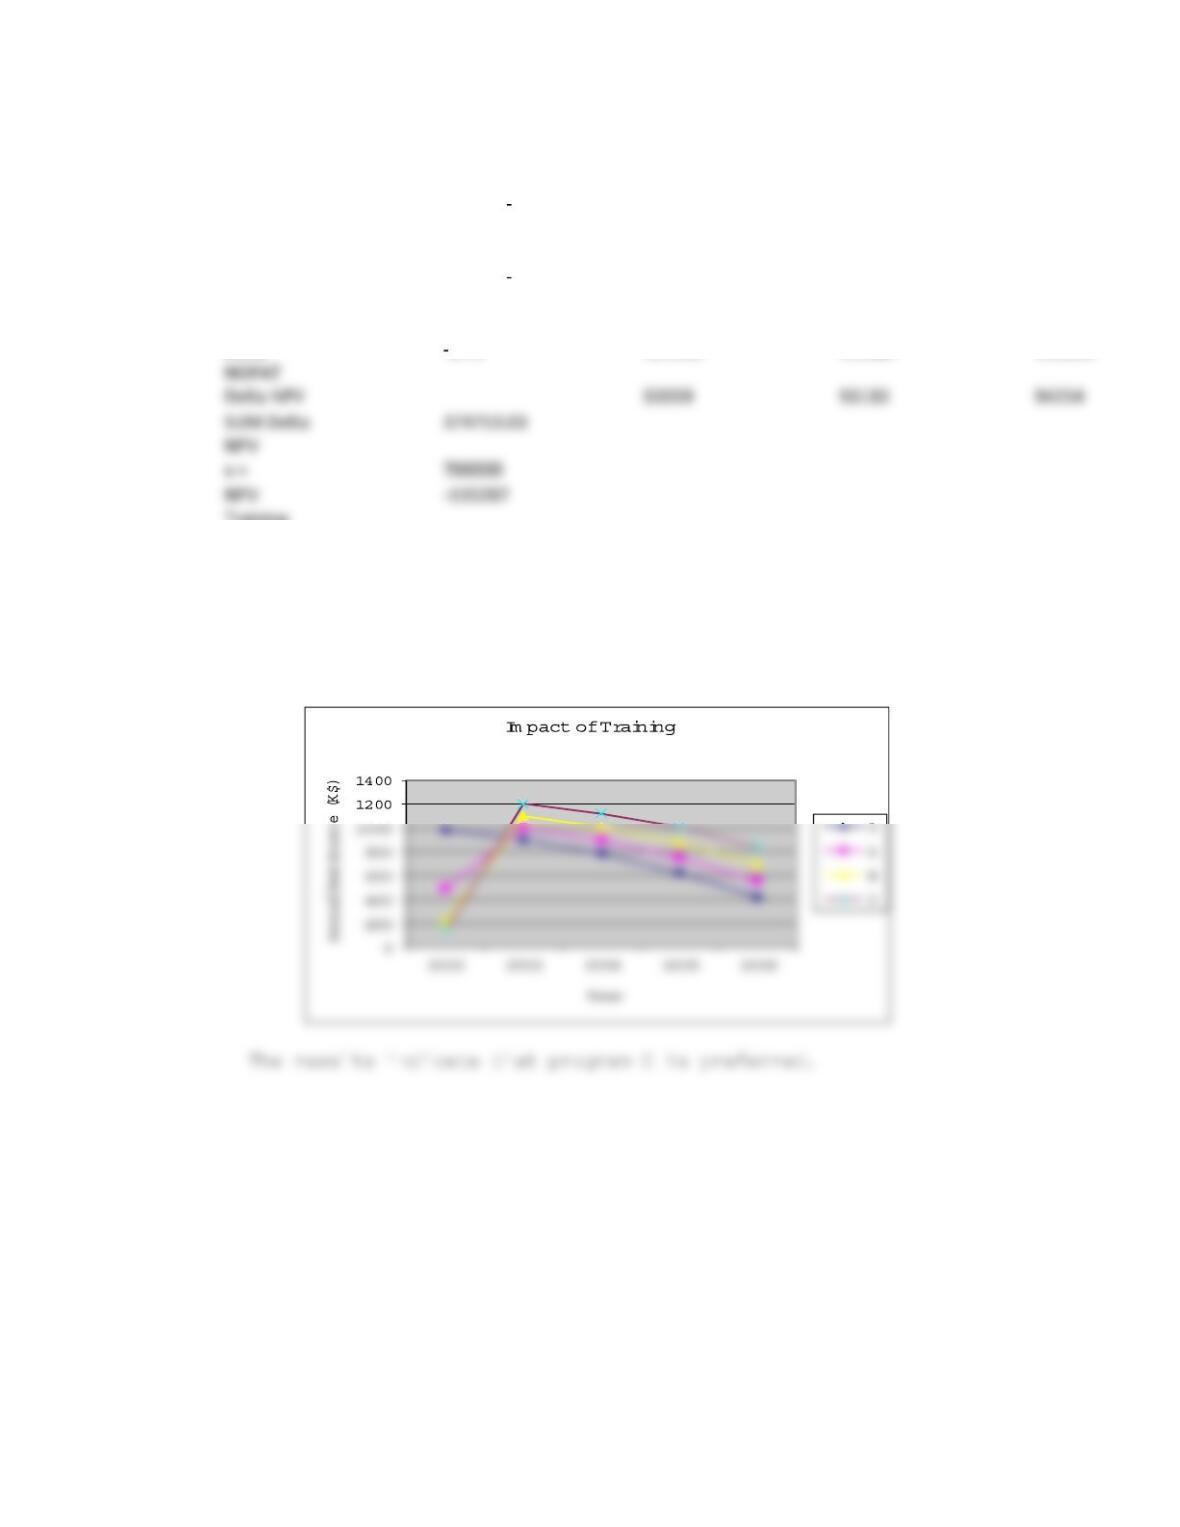
Table 7.34 which is shown on the next page illustrates a
TABLE 7.34. MULTIYEAR INCOME STATEMENT
Buffalo Best Corporation for Option A (Program A: x = $700,000; 1% cost reduction)
2002 2002A 2003 2003A 2004 2004A 2005 2005A
Price/Unit 10,000 10400 10816 11248.64
#Unit 2000 2080 2163.2 2249.728
Cost/Unit 6500 6955 7441.85 7962.78
Sales 20000000 20000000 21632000 21632000 23397171 23397171 25306380 25306380
CGS 13000000 13000000 14466400 14321736 16098210 15937228 17914088 17734947
8
tax (30%) 420000 420000
0.3x
385680 429079.2 335808.4 384103 267636.1 321378.4
NOPAT 980000 980000
0.7x
899920 1001185 783552.9 896240.4 624484.3 749882.9
Delta
0.7x 101265 112687 125399
Training
In Figure 7.6, the curve designated by 0 refers to the
option of “doing nothing” along with those for programs A, B.
and C.
FIGURE 7.6. COMPARISON OF OPTIONS
ANSWER 7.8
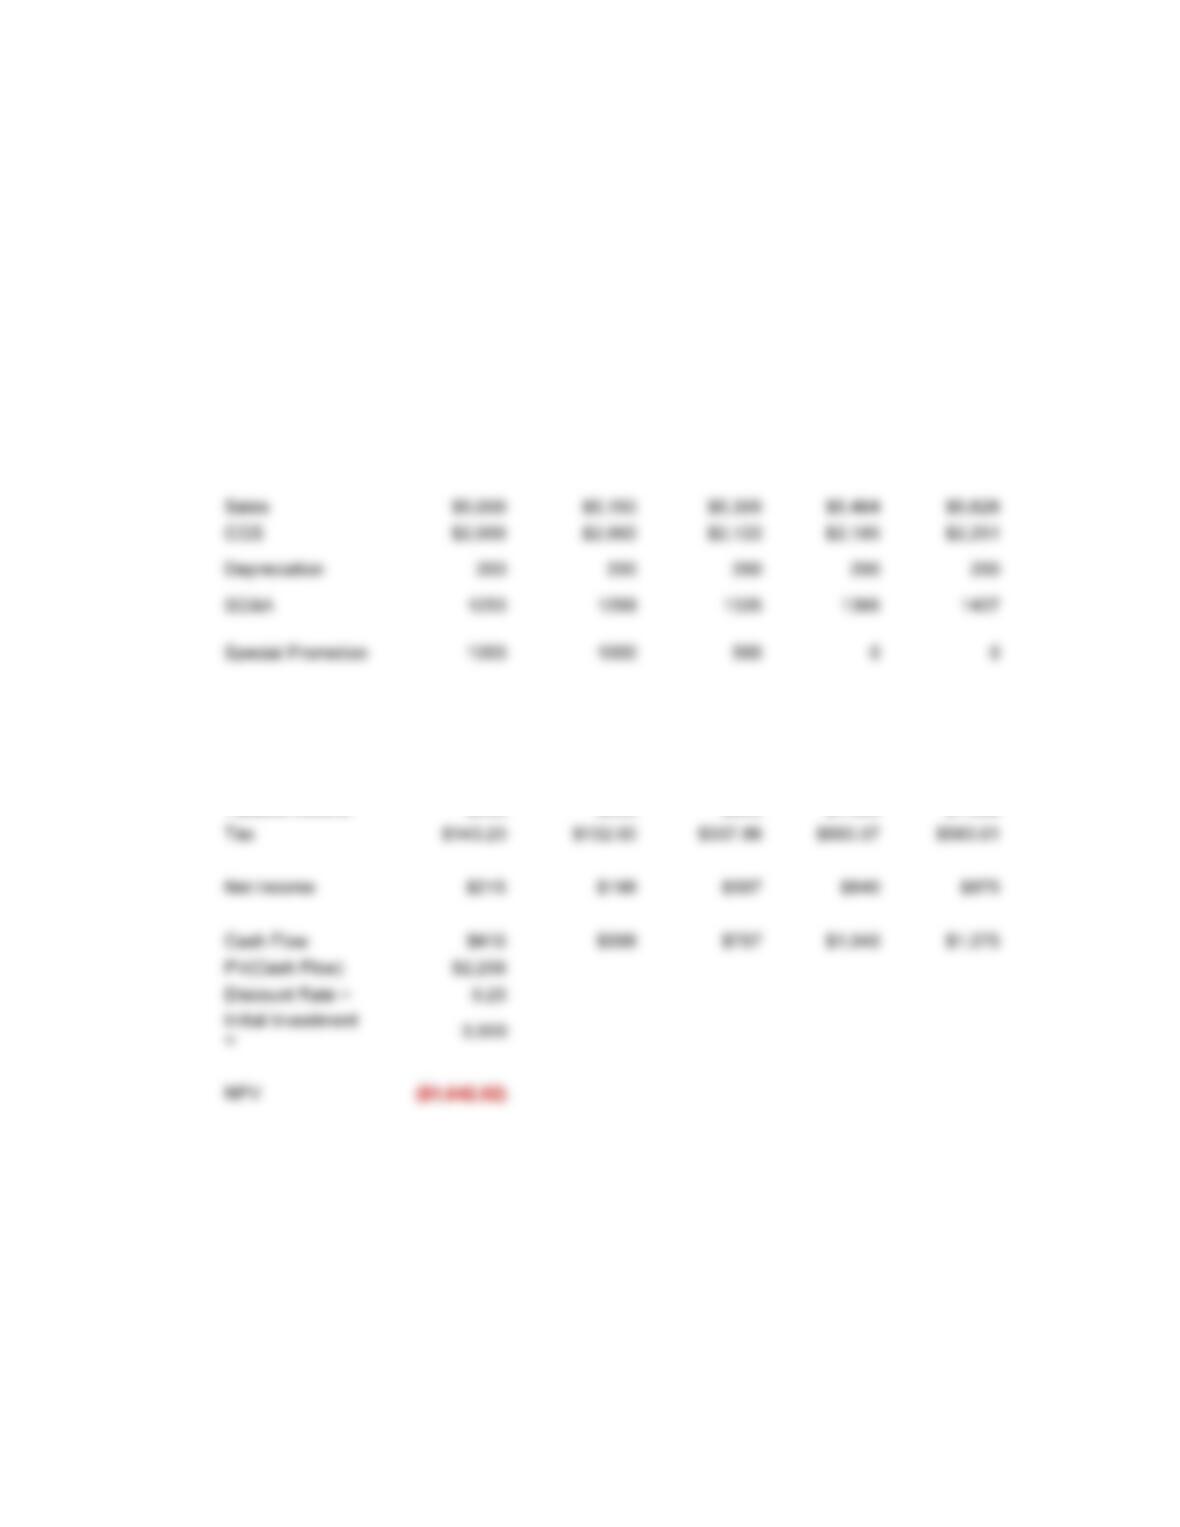
For the proposed marketing initiative, an income statement
(see Table 7.35) can be formulated to demonstrate its economical
viability while also taking into account all stated assumptions.
9
TABLE 7.35.INCOME STATEMENT
Income Statement for the Increased Sales Operations (all number in thousands,
except unit price) Dr. C. M. Chang
1998 1999 2000 2001 2002
Units 250 250 250 250 250
Unit Price $20.00 $20.60 $21.22 $21.85 $22.51
Unit Cost $8.00 $8.24 $8.49 $8.74 $9.00
EBIT $550 $602 $1,157 $1,712 $1,770
Interest $192 $272 $312 $312 $312
Taxable Income $358 $330 $845 $1,400 $1,458
Since the NPV for the proposed marketing initiative is negative
at the hurtle rate of 0.25, it should not be approved for
implementation.
ANSWER 7.9
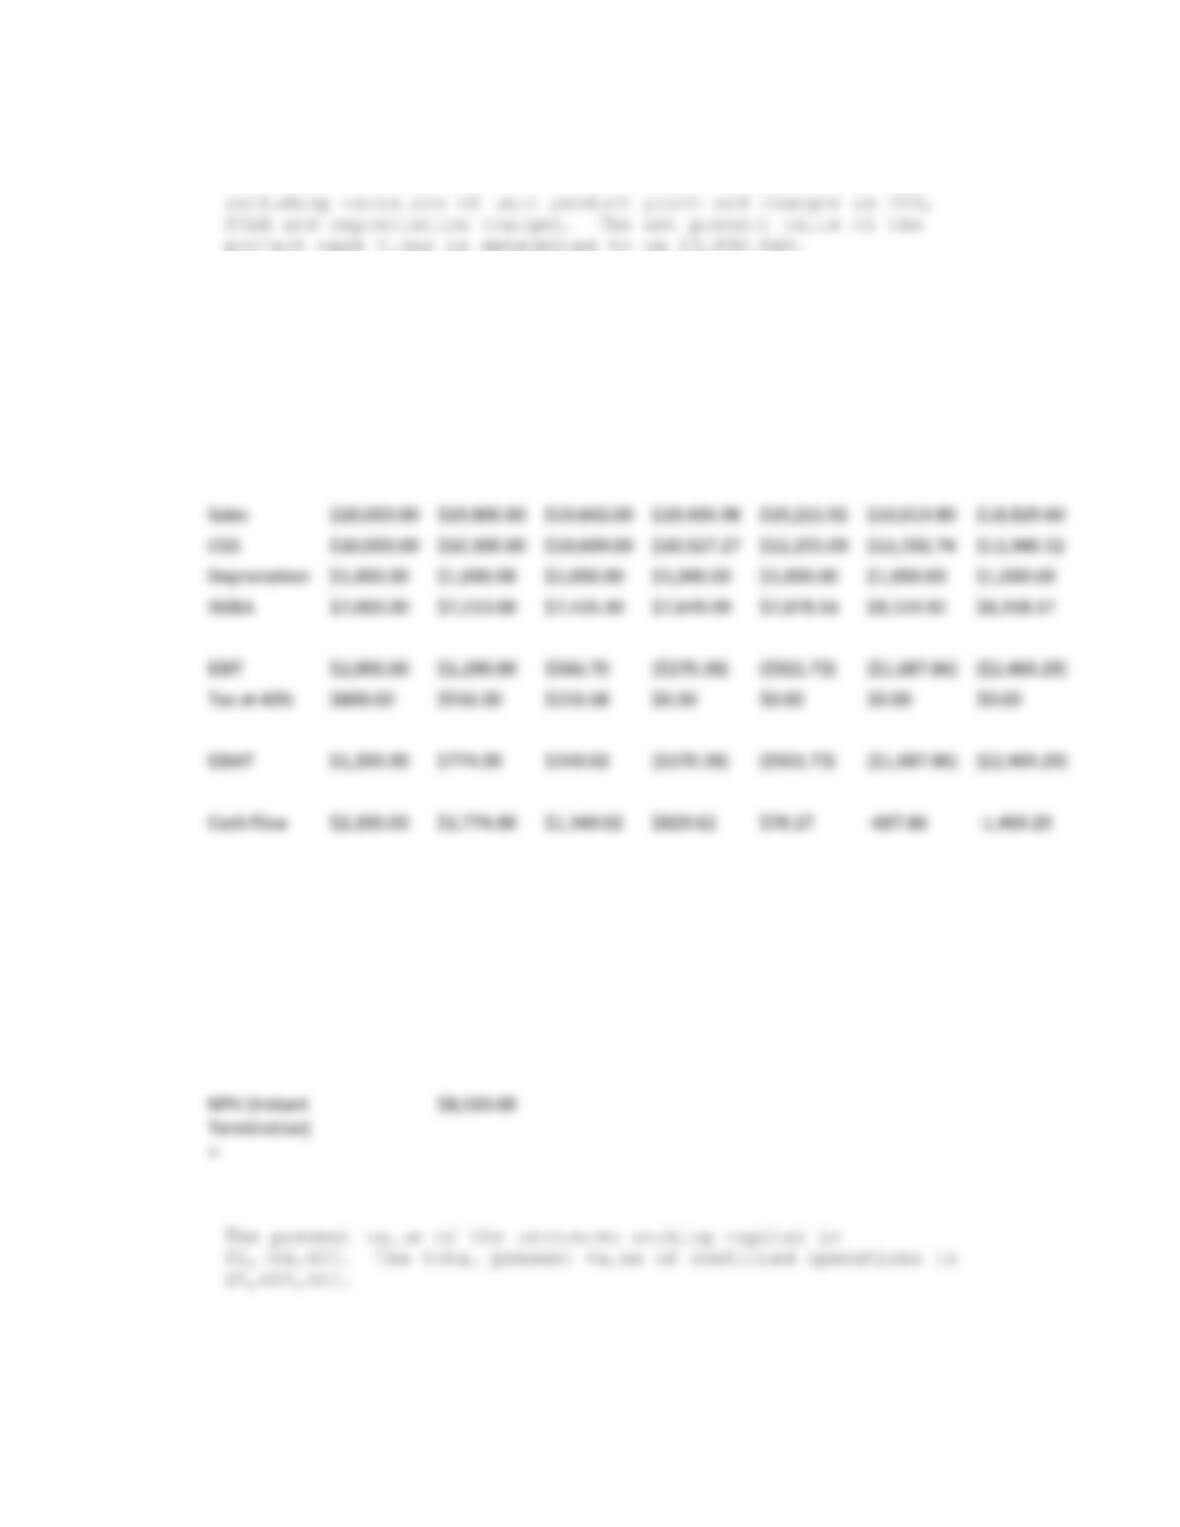
The multiyear income statement for the product line is
displayed in Table 7.36, which is shown on the next page,
10
Table 7.36 Income Statement ($ Thousands)
Discount
Rate =
0.12
1998 1999 2000 2001 2002 2003 2004
Units (000s) 1,000 1,000 1,000 1,000 1,000 1,000 1,000
Unit Price $20.00 $19.80 $19.60 $19.41 $19.21 $19.02 $18.83
NPV (Cash
flow) =
$3,890.84
NPV
(Working
Capital) =
$1,764.16
NPV
(Continued
Operation) =
$5,655.00
11
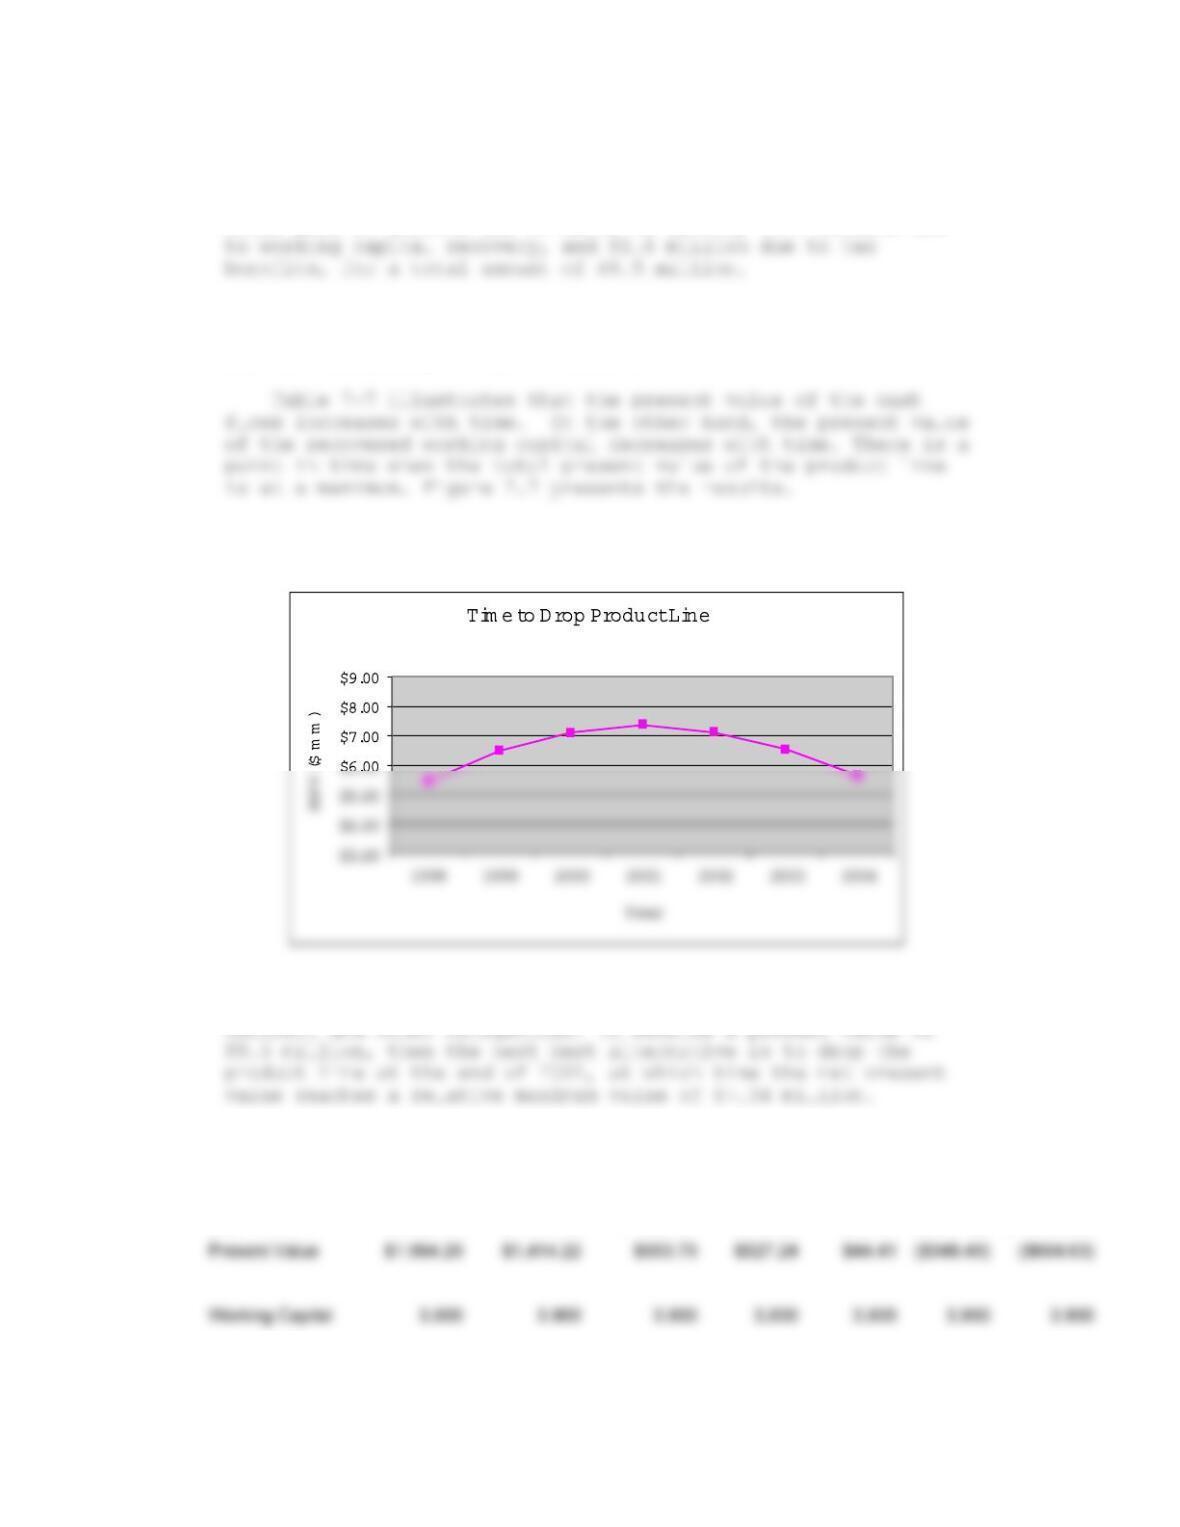
If the company were to discontinue this product line, it
would gain $3 million due to sales of assets, $3.9 million due
Based on above-described project economics, the company
should favor shutting down the product line at the end of 1997
and not continuing to run it until 2004.
FIGURE 7.7 OPTIMIUM TIME TO DROP PRODUCT LINE
Thus, if the company does not elect to drop the product line
at the end of 1997 for non-economic reasons (e.g., union
TABLE 7.37 CASH FLOW ANALYSIS
1998 1999 2000 2001 2002 2003 2004
Cash Flow $2,200.00 $1,774.00 $1,340.00 $829.62 $78.27 ($687.86) ($1,469.29)