121
rkets
WHAT’S NEW IN THE SIXTH EDITION:
There are no major changes to this chapter.
LEARNING OBJECTIVES:
By the end of this chapter, students should understand:
➢ the link between buyers’ willingness to pay for a good and the demand curve.
CONTEXT AND PURPOSE:
Chapter 7 is the first chapter in a three-chapter sequence on welfare economics and market efficiency.
Chapter 7 employs the supply and demand model to develop consumer surplus and producer surplus as a
measure of welfare and market efficiency. These concepts are then utilized in Chapters 8 and 9 to
determine the winners and losers from taxation and restrictions on international trade.
and quantity is also the one that maximizes welfare.
7
CONSUMERS, PRODUCERS, AND
THE EFFICIENCY OF MARKETS
122 ❖ Chapter 7/Consumers, Producers, and the Efficiency of Markets
KEY POINTS:
• Consumer surplus equals buyers’ willingness to pay for a good minus the amount they actually pay
for it, and it measures the benefit buyers get from participating in a market. Consumer surplus can
be computed by finding the area below the demand curve and above the price.
CHAPTER OUTLINE:
I. Definition of welfare economics: the study of how the allocation of resources affects
economic well-being.
II. Consumer Surplus
A. Willingness to Pay
1. Definition of willingness to pay: the maximum amount that a buyer will pay for a
good.
Students often are confused by the use of the word “welfare.” Remind them that we
are talking about social well-being and not public assistance.
Chapter 7/Consumers, Producers, and the Efficiency of Markets ❖ 123
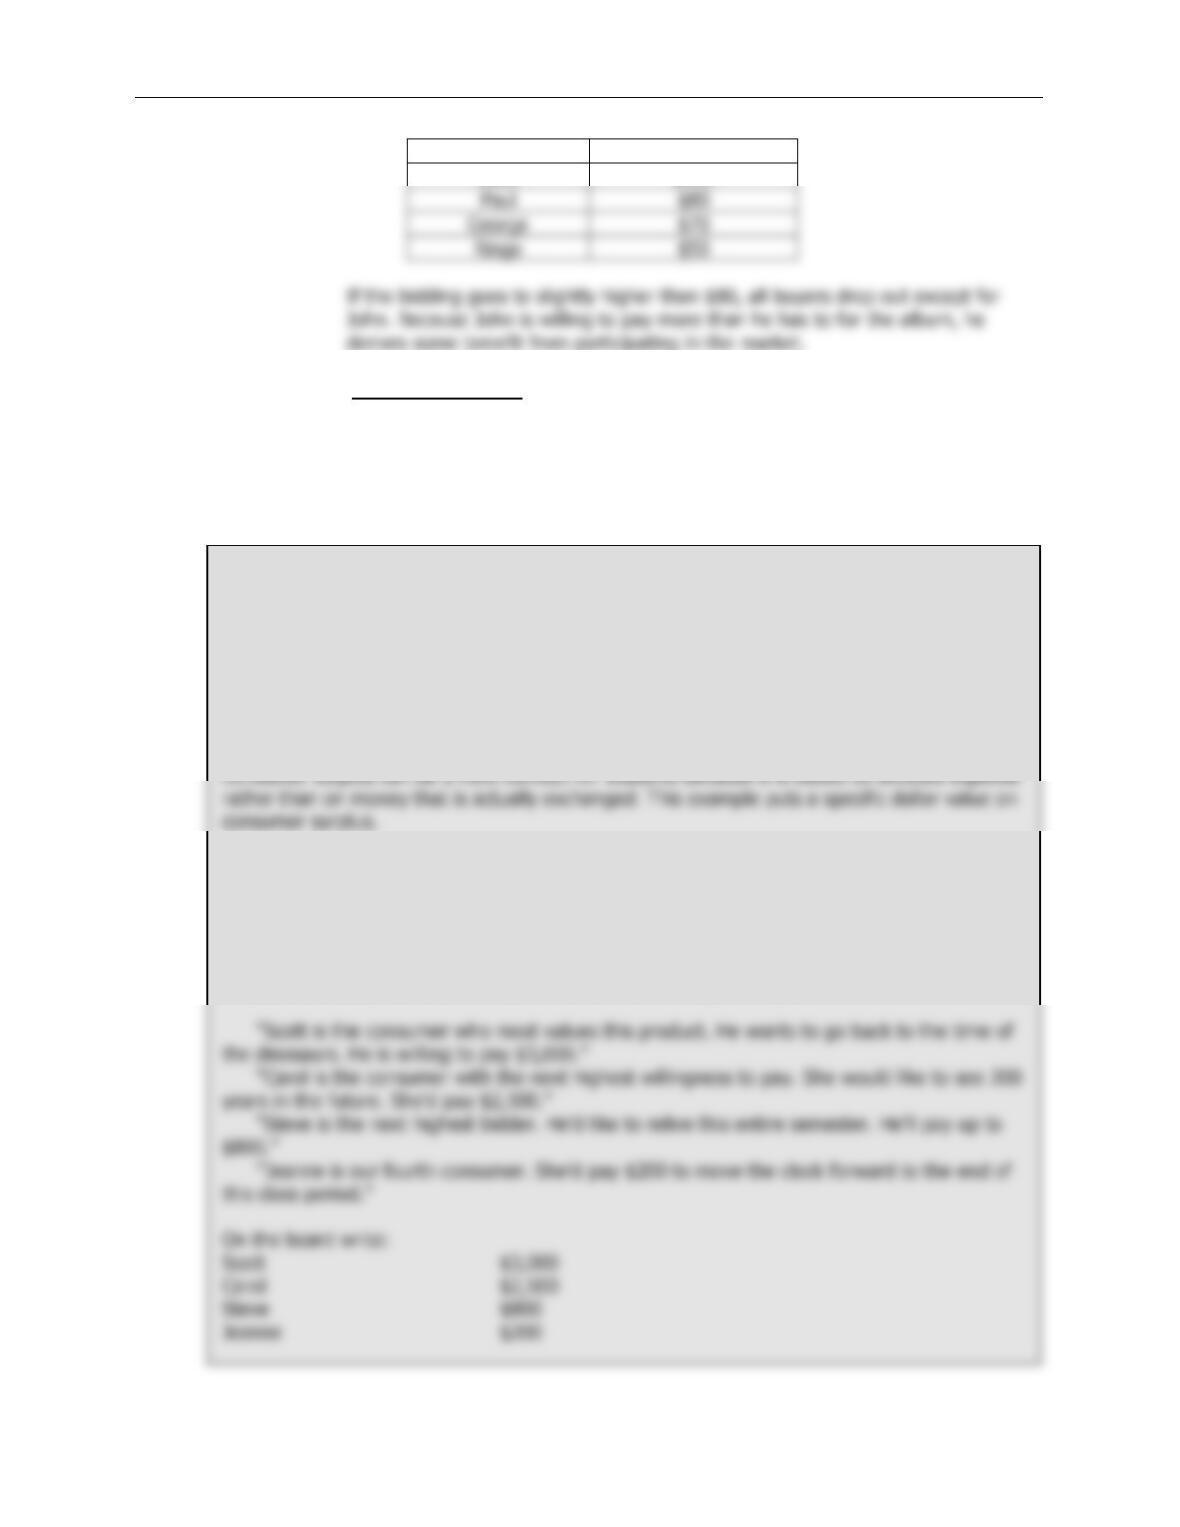
Buyer
Willingness to Pay
John
$100
3. Definition of consumer surplus: the amount a buyer is willing to pay for a good
minus the amount the buyer actually pays for it.
4. Note that if you had more than one copy of the album, the price in the auction would end up
being lower (a little over $70 in the case of two albums) and both John and Paul would gain
consumer surplus.
Activity 1—Value of a Time Machine
Type: In-class demonstration
Topics: Consumer surplus
Materials needed: None
Time: 10 minutes
Class limitations: Works in any size class
Purpose
Instructions
Tell the class, “A new technology has been developed that allows individuals to travel
backward or forward in time. We want to identify the value this time machine provides to
consumers. Let’s assume the four consumers who most desire this product are in this class.”
Choose four student names and use them in the following example:
124 ❖ Chapter 7/Consumers, Producers, and the Efficiency of Markets
B. Using the Demand Curve to Measure Consumer Surplus
1. We can use the information on willingness to pay to derive a demand curve for the rare Elvis
Presley album.
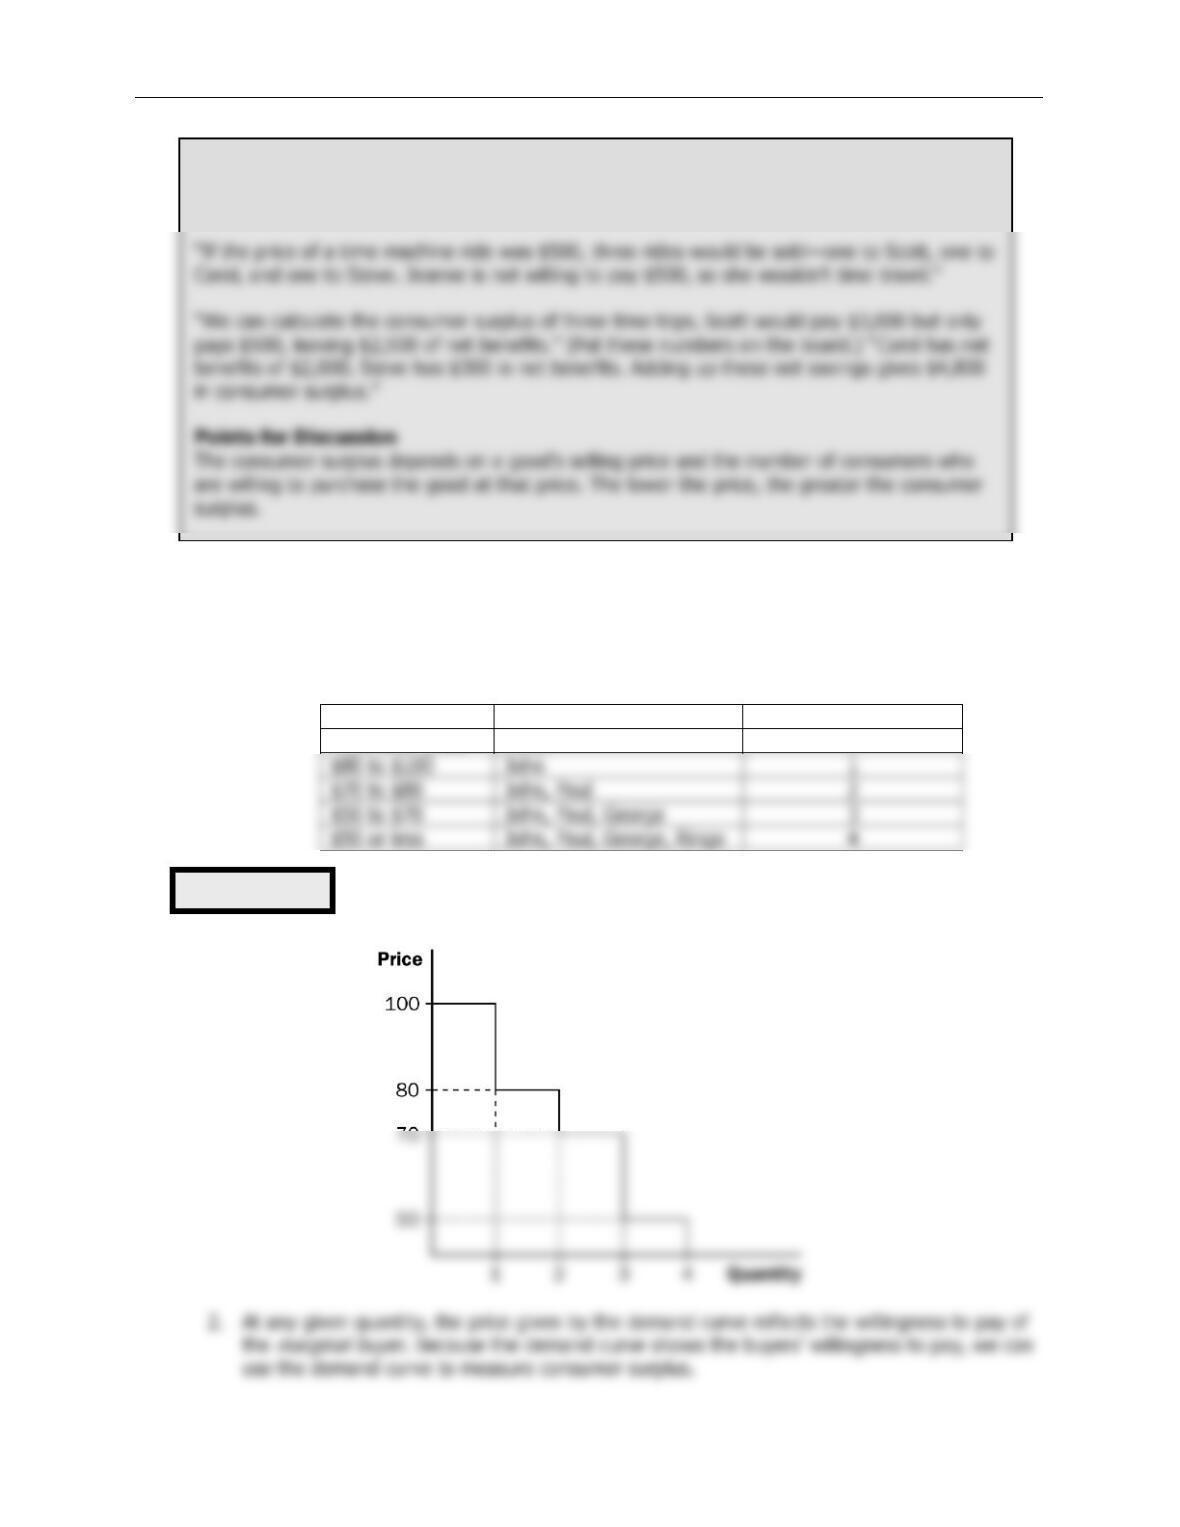
Price
Buyers
Quantity Demanded
More than $100
None
0
Figure 1
“This represents the demand curve for the time machine. Consumer surplus is the difference
between what consumers are willing to pay and the amount they actually have to pay. The
market price will determine who uses the time machine and how much surplus they keep.”
$80 to $100
John
1
$70 to $80
John, Paul
2
$50 to $70
John, Paul, George
3
$50 or less
John, Paul, George, Ringo
4
Chapter 7/Consumers, Producers, and the Efficiency of Markets ❖ 125
3. Consumer surplus can be measured as the area below the demand curve and above the
price.
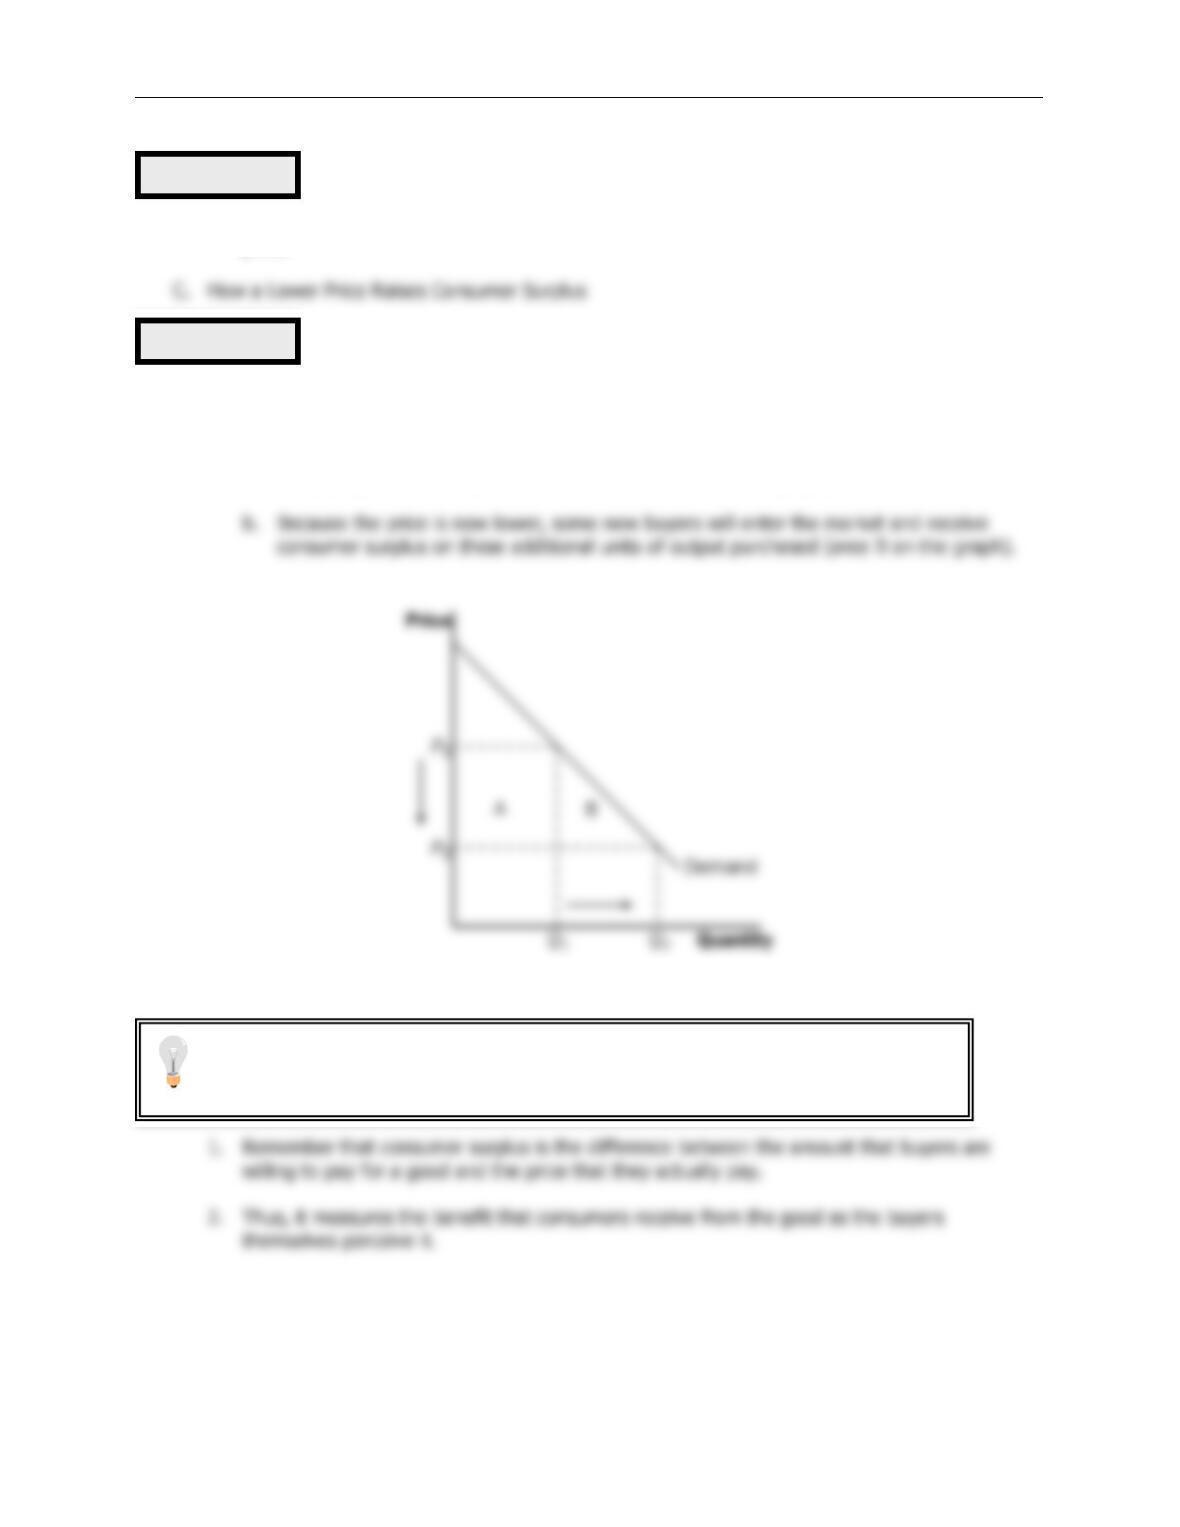
1. As price falls, consumer surplus increases for two reasons.
a. Those already buying the product will receive additional consumer surplus because they
are paying less for the product than before (area A on the graph).
D. What Does Consumer Surplus Measure?
Figure 2
Figure 3
It is important to stress that consumer surplus is measured in monetary terms.
Consumer surplus gives us a way to place a monetary cost on inefficient market
outcomes (due to government involvement or market failure).
126 ❖ Chapter 7/Consumers, Producers, and the Efficiency of Markets
III. Producer Surplus
A. Cost and the Willingness to Sell
1. Definition of cost: the value of everything a seller must give up to produce a good.
2. Example: You want to hire someone to paint your house. You accept bids for the work from
3. Bidding will stop when the price gets to be slightly below $600. All sellers will drop out except
for Grandma. Because Grandma receives more than she would require to paint the house,
she derives some benefit from producing in the market.
4. Definition of producer surplus: the amount a seller is paid for a good minus the
seller’s cost of providing it.
ALTERNATIVE CLASSROOM EXAMPLE:
Review the material on price ceilings from Chapter 6. Redraw the market for two-bedroom
apartments in your town. Draw in a price ceiling below the equilibrium price.
You will need to take some time to explain the relationship between the producers’
Chapter 7/Consumers, Producers, and the Efficiency of Markets ❖ 127
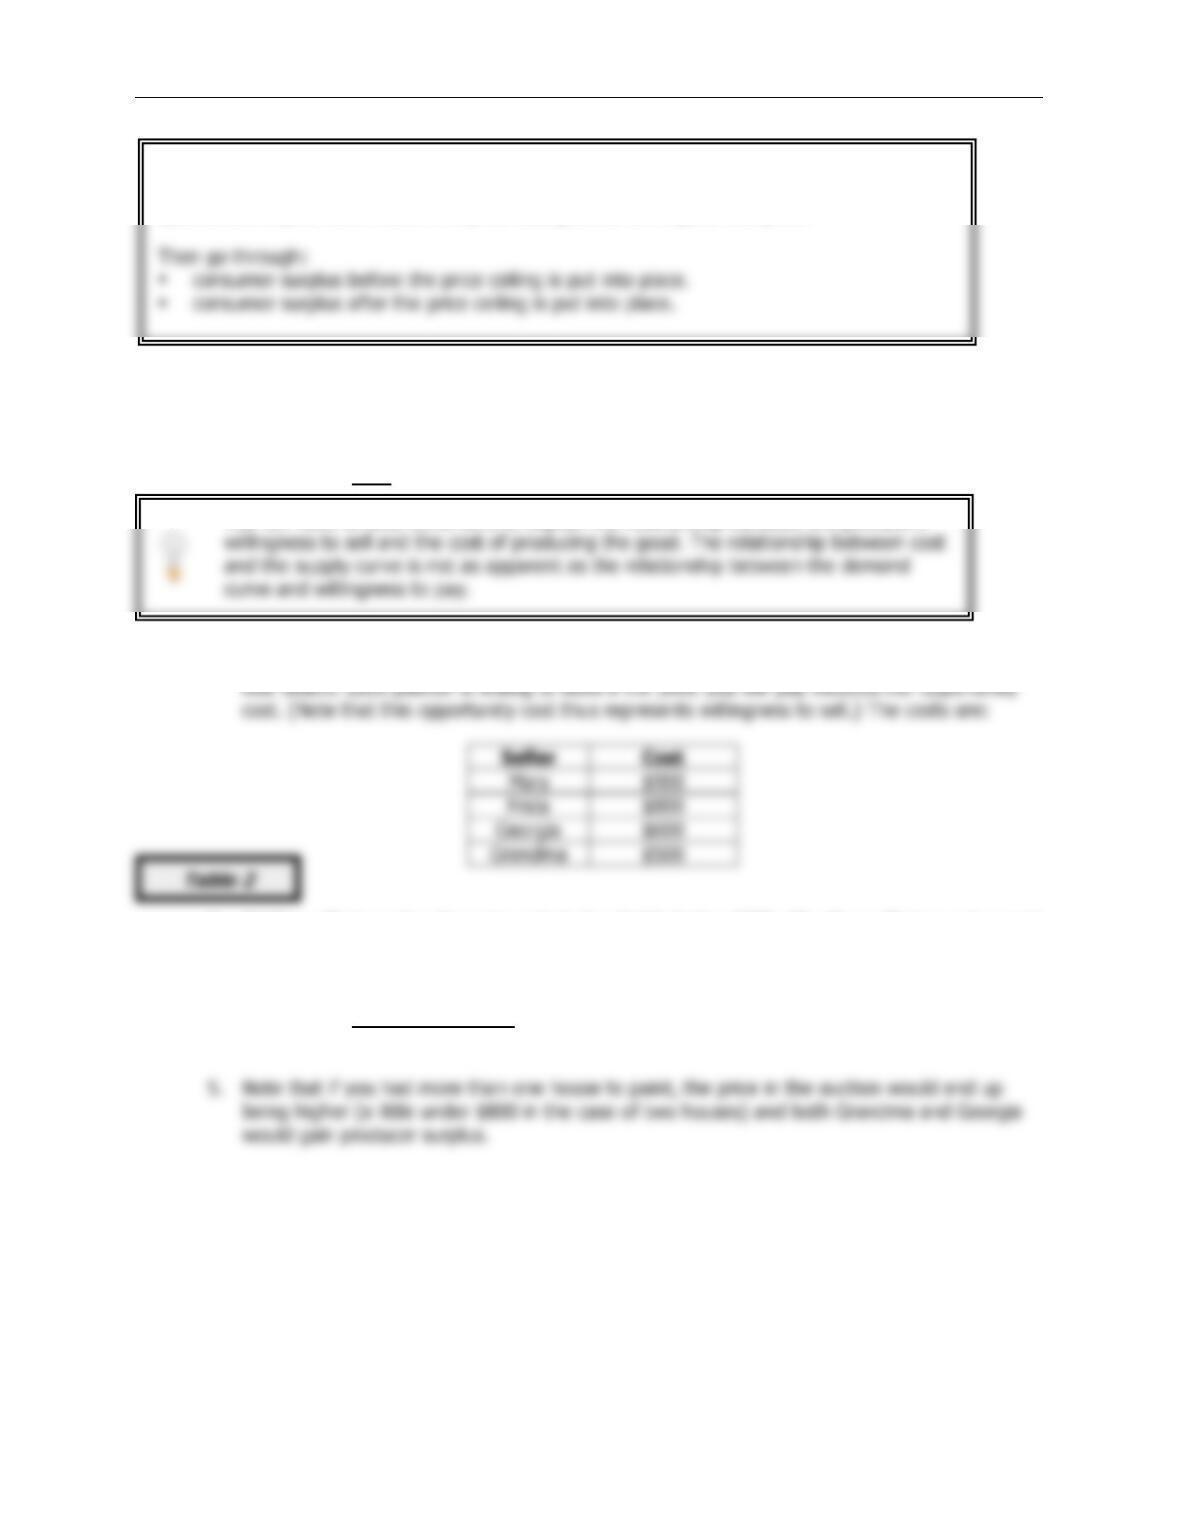
B. Using the Supply Curve to Measure Producer Surplus
1. We can use the information on cost (willingness to sell) to derive a supply curve for house
painting services.
Price
Sellers
Quantity Supplied
$900 or more
Mary, Frida, Georgia, Grandma
4
2. At any given quantity, the price given by the supply curve represents the cost of the
marginal
seller
. Because the supply curve shows the sellers’ cost (willingness to sell), we can use the
supply curve to measure producer surplus.
Figure 5
Figure 4
$800 to $900
Frida, Georgia, Grandma
3
$600 to $800
Georgia, Grandma
2
$500 to $600
Grandma
1
less than $500
None
0
128 ❖ Chapter 7/Consumers, Producers, and the Efficiency of Markets
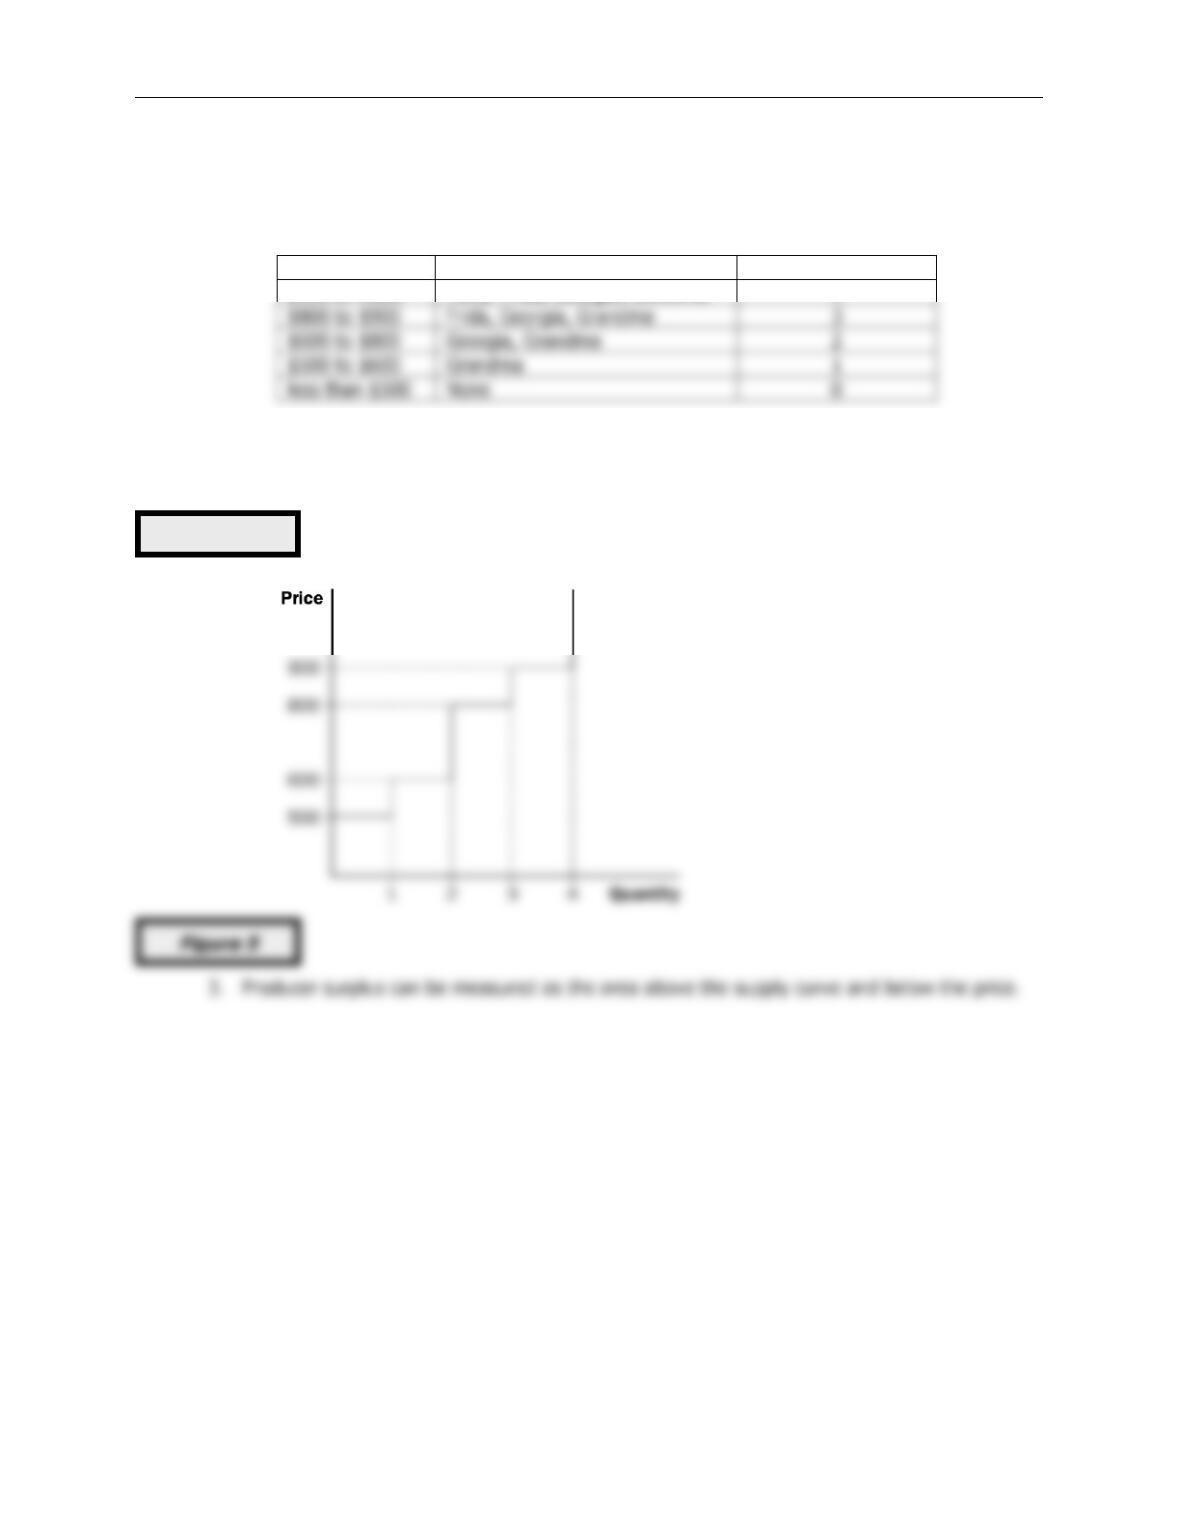
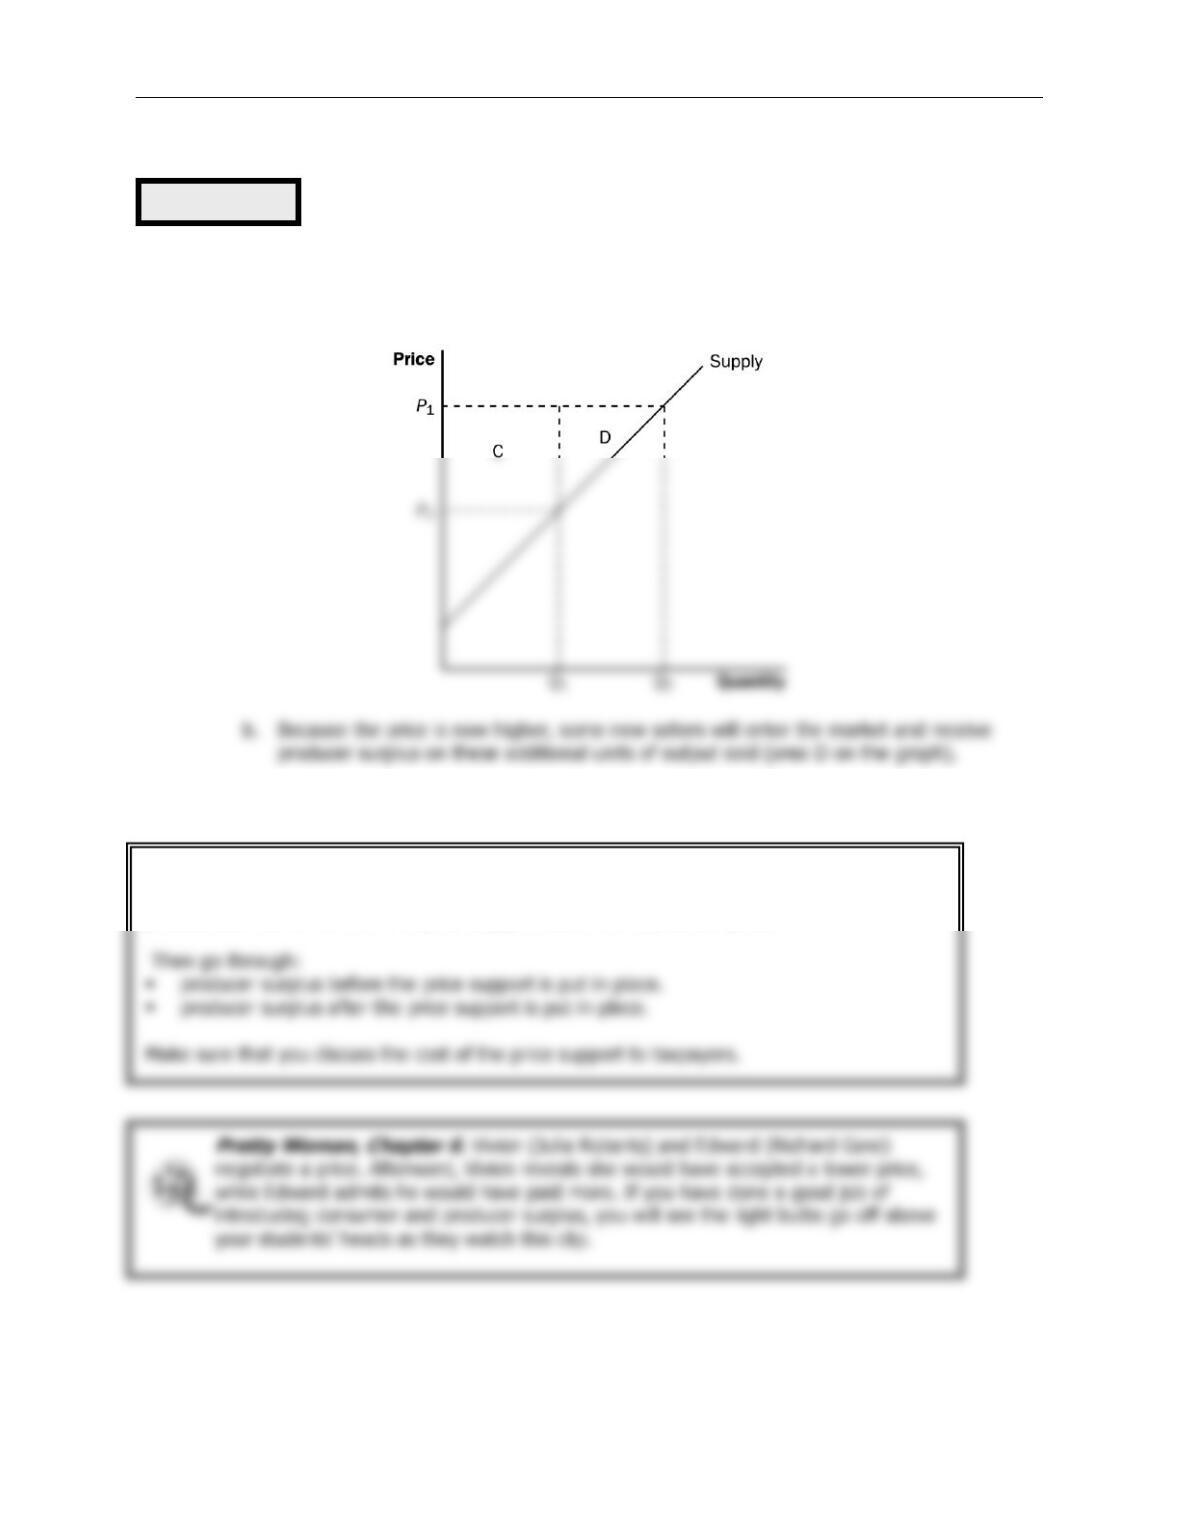
C. How a Higher Price Raises Producer Surplus
1. As price rises, producer surplus increases for two reasons.
a. Those already selling the product will receive additional producer surplus because they
are receiving more for the product than before (area C on the graph).
D. Producer surplus is used to measure the economic well-being of producers, much like consumer
surplus is used to measure the economic well-being of consumers.
Figure 6
ALTERNATIVE CLASSROOM EXAMPLE:
Review the material on price floors from Chapter 6. Redraw the market for an agricultural
product such as corn. Draw in a price support above the equilibrium price.
Chapter 7/Consumers, Producers, and the Efficiency of Markets ❖ 129
IV. Market Efficiency
A. The Benevolent Social Planner
1. The economic well-being of everyone in society can be measured by total surplus, which is
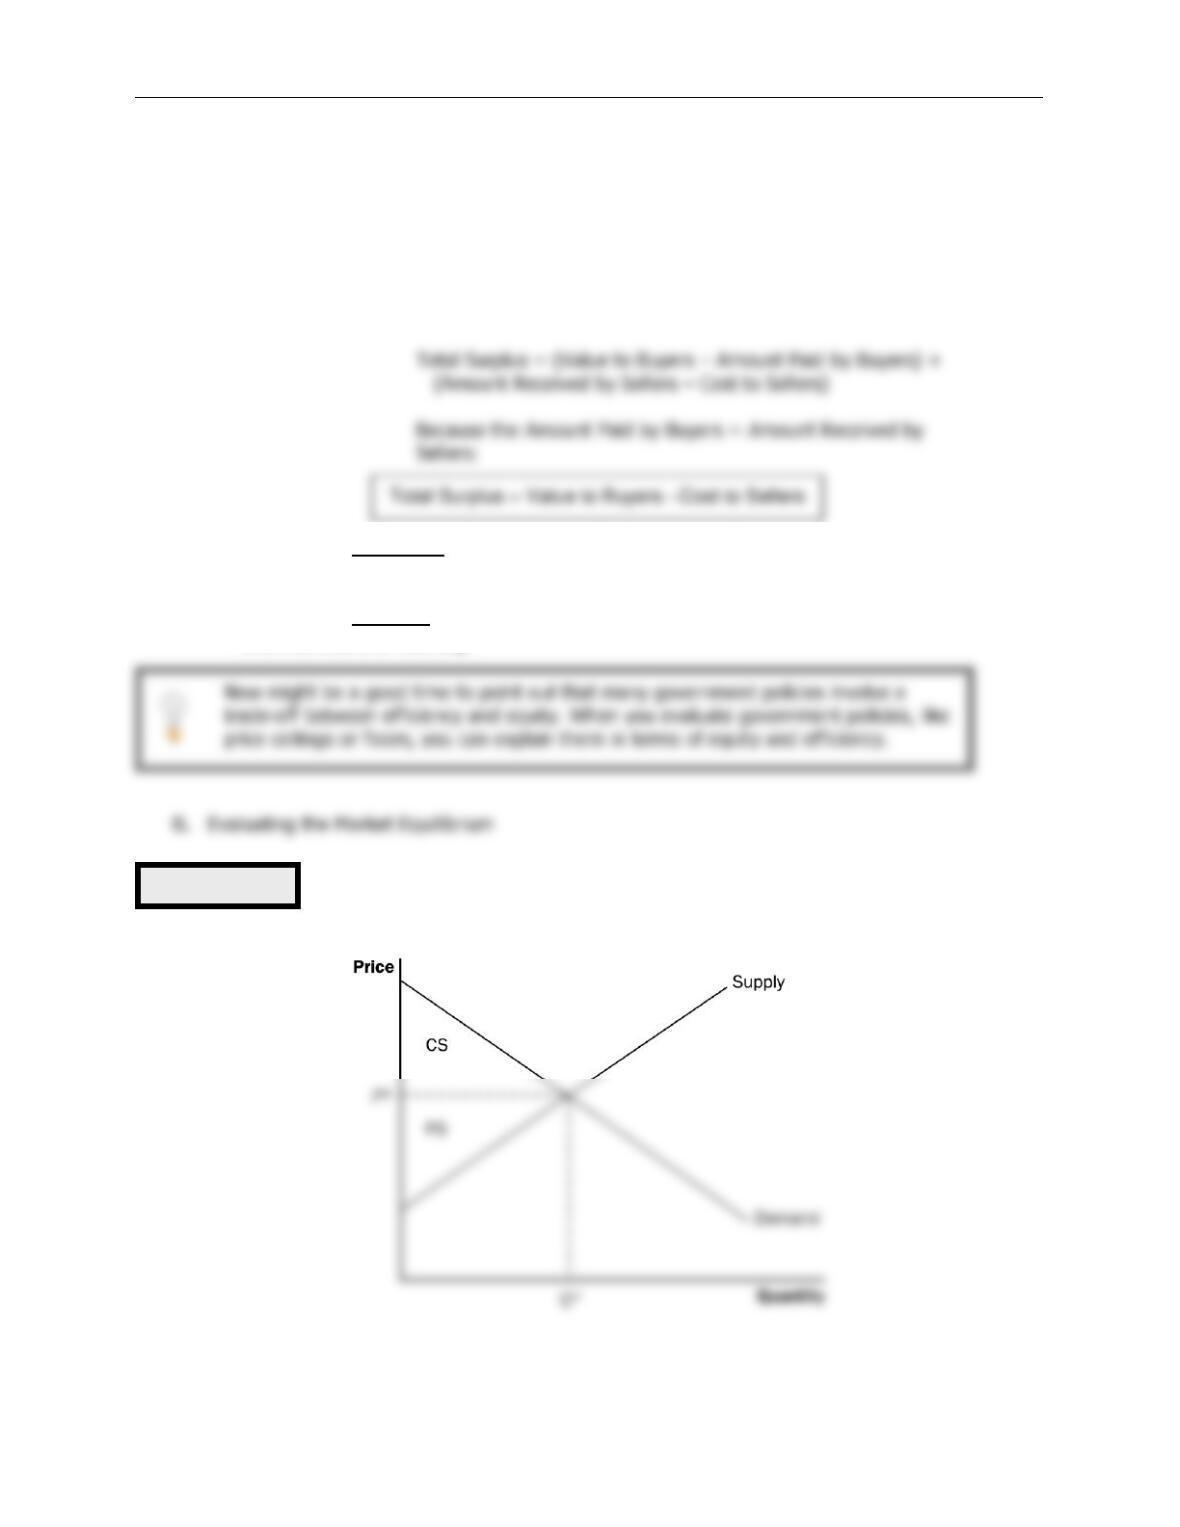
the sum of consumer surplus and producer surplus:
Total Surplus = Consumer Surplus + Producer Surplus
2. Definition of efficiency: the property of a resource allocation of maximizing the
total surplus received by all members of society.
3. Definition of equality: the property of distributing economic prosperity uniformly
the members of society.
Figure 7
130 ❖ Chapter 7/Consumers, Producers, and the Efficiency of Markets
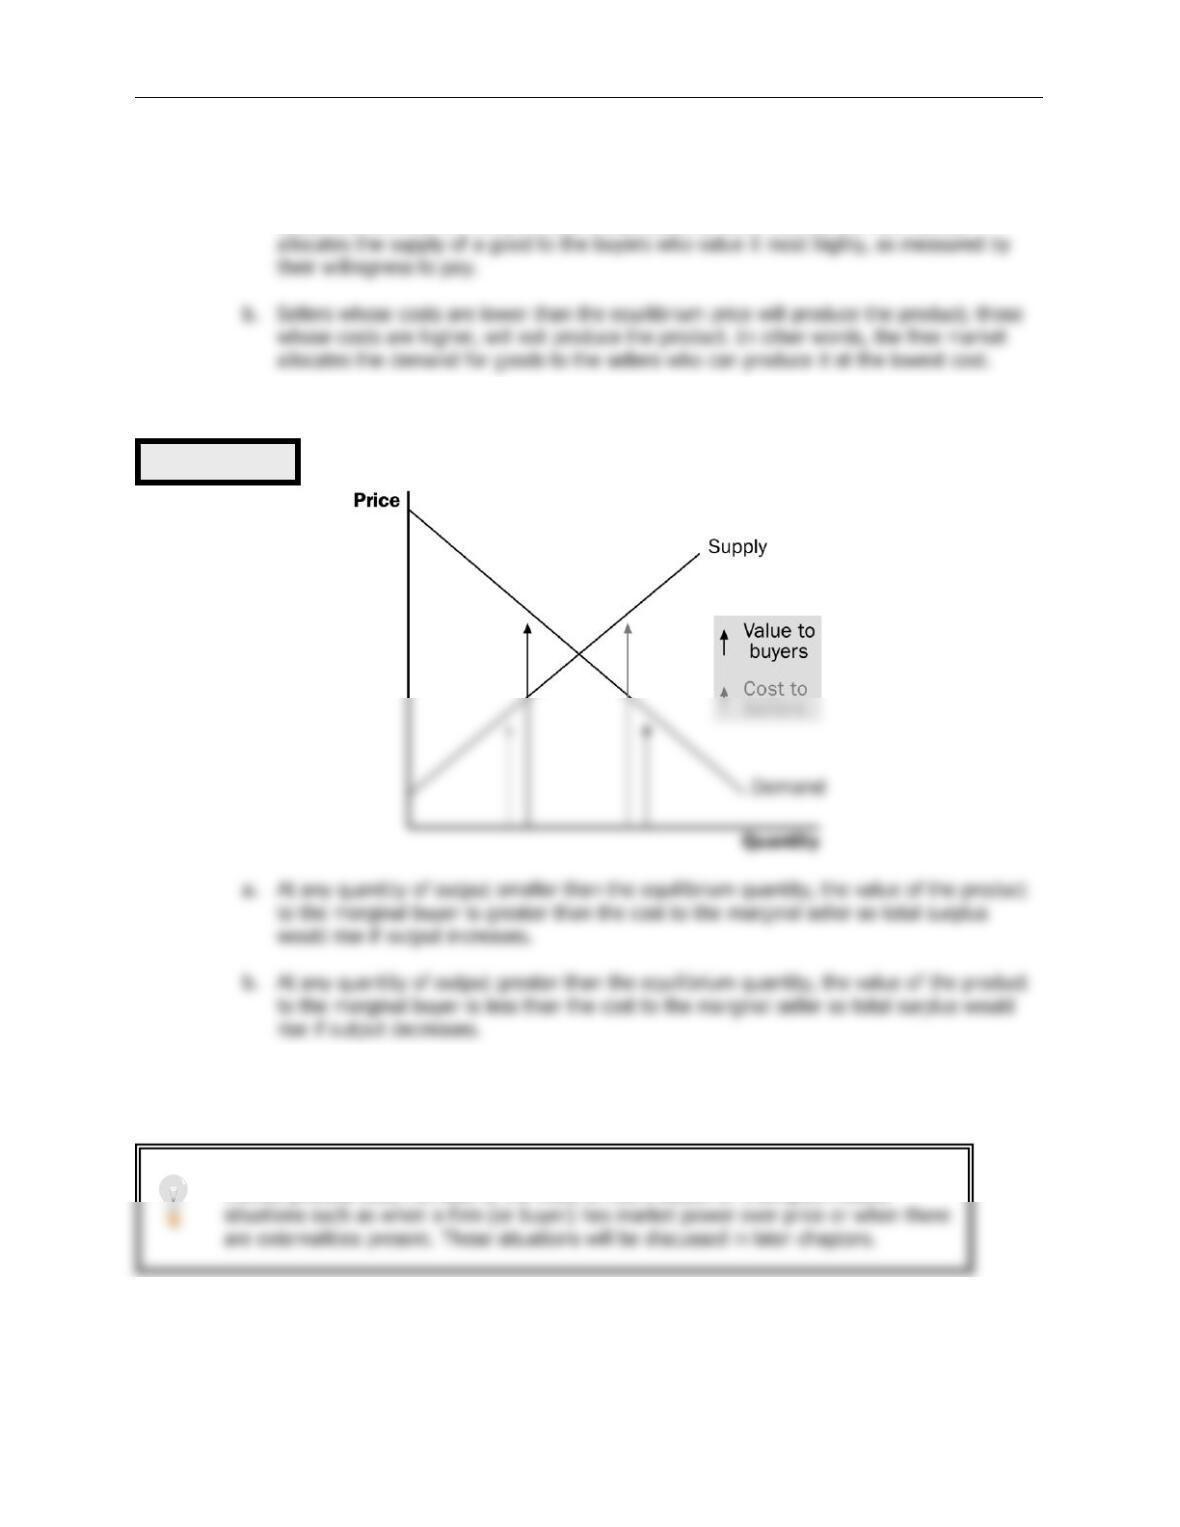
1. At the market equilibrium price:
a. Buyers who value the product more than the equilibrium price will purchase the product;
those who do not, will not purchase the product. In other words, the free market
2. Total surplus is maximized at the market equilibrium.
3. Note that this is one of the reasons that economists believe Principle #6: Markets are usually
a good way to organize economic activity.
Figure 8
It would be a good idea to remind students that there are circumstances when the
market process does not lead to the most efficient outcome. Examples include
Chapter 7/Consumers, Producers, and the Efficiency of Markets ❖ 131
C.
In the News: Ticket Scalping
1. Ticket scalping is an example of how markets work to achieve an efficient outcome.
D.
Case Study: Should There Be a Market in Organs?
1. As a matter of public policy, people are not allowed to sell their organs.
a. In essence, this means that there is a price ceiling on organs of $0.
V. Market Efficiency and Market Failure
A. To conclude that markets are efficient, we made several assumptions about how markets
worked.
1. Perfectly competitive markets.
132 ❖ Chapter 7/Consumers, Producers, and the Efficiency of Markets
SOLUTIONS TO TEXT PROBLEMS:
Quick Quizzes
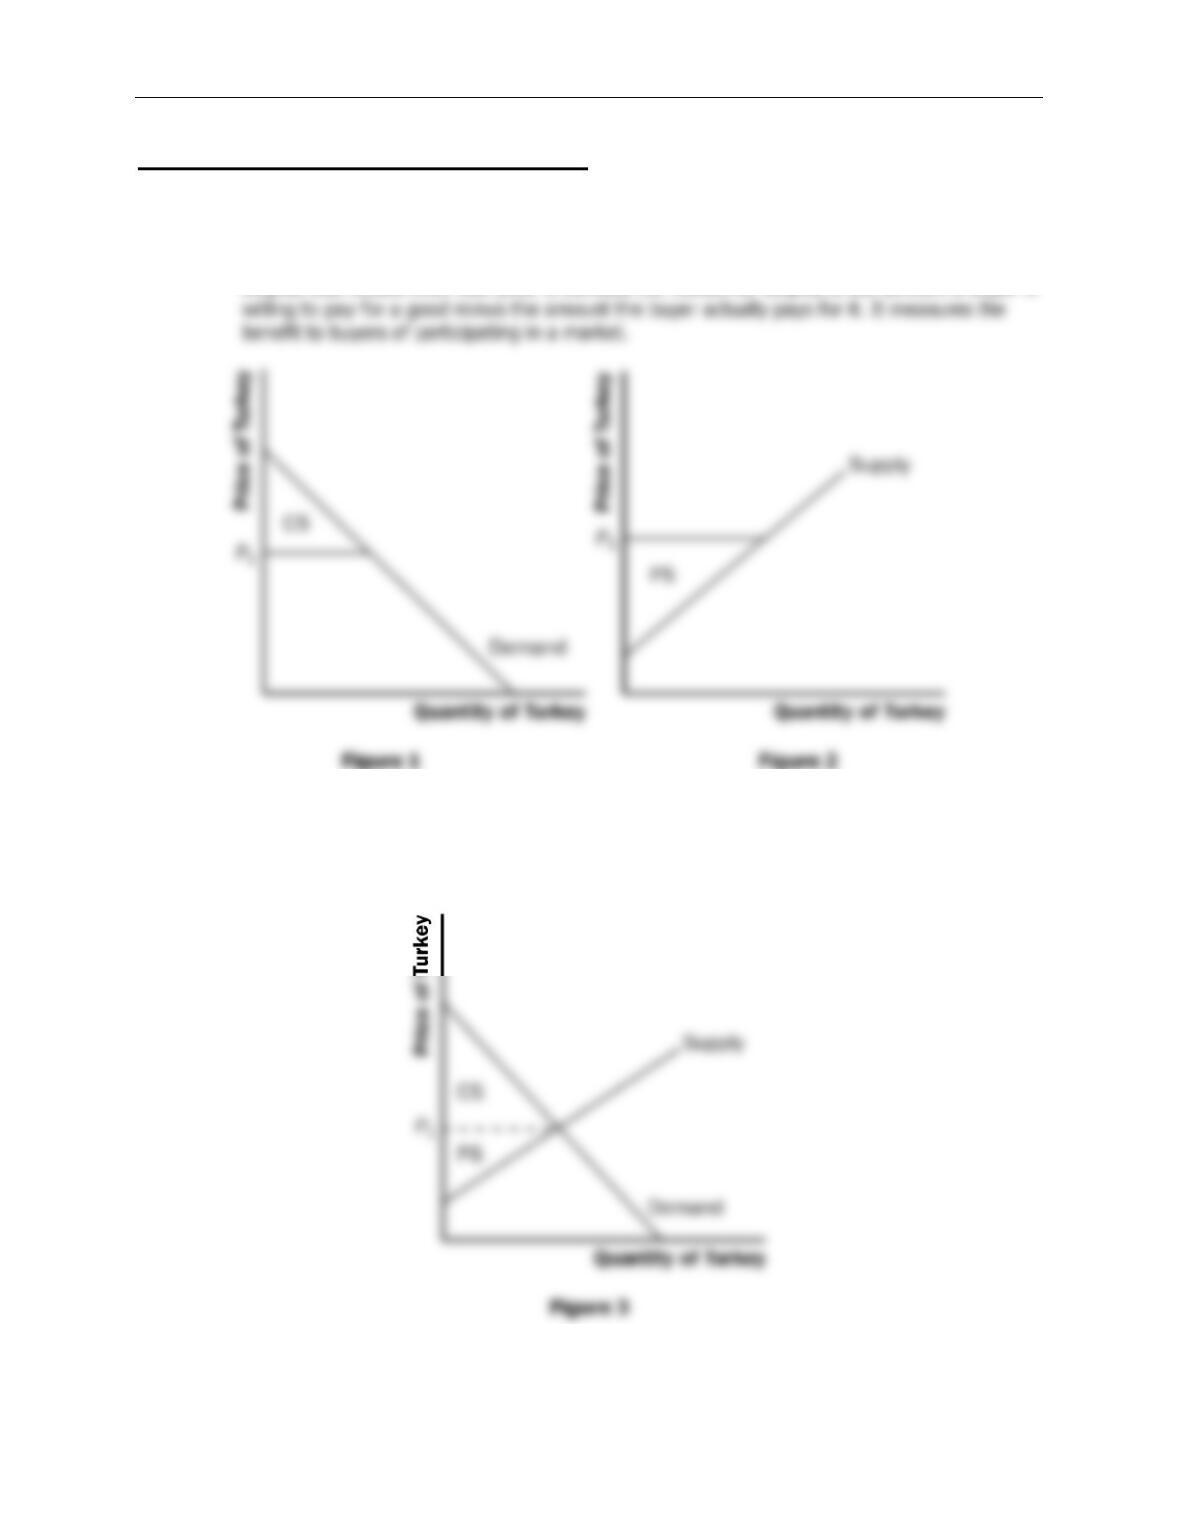
1. Figure 1 shows the demand curve for turkey. The price of turkey is
P
1 and the consumer
surplus that results from that price is denoted CS. Consumer surplus is the amount a buyer is
2. Figure 2 shows the supply curve for turkey. The price of turkey is
P
1 and the producer
surplus that results from that price is denoted PS. Producer surplus is the amount sellers are
paid for a good minus the sellers’ cost of providing it (measured by the supply curve). It
measures the benefit to sellers of participating in a market.
3. Figure 3 shows the supply and demand for turkey. The price of turkey is
P
1, consumer
surplus is CS, and producer surplus is PS. Producing more turkeys than the equilibrium