132 ❖ Chapter 7/Consumers, Producers, and the Efficiency of Markets
Quick Check Multiple Choice
Problems and Applications
1. a. Consumer surplus is equal to willingness to pay minus the price paid. Therefore,
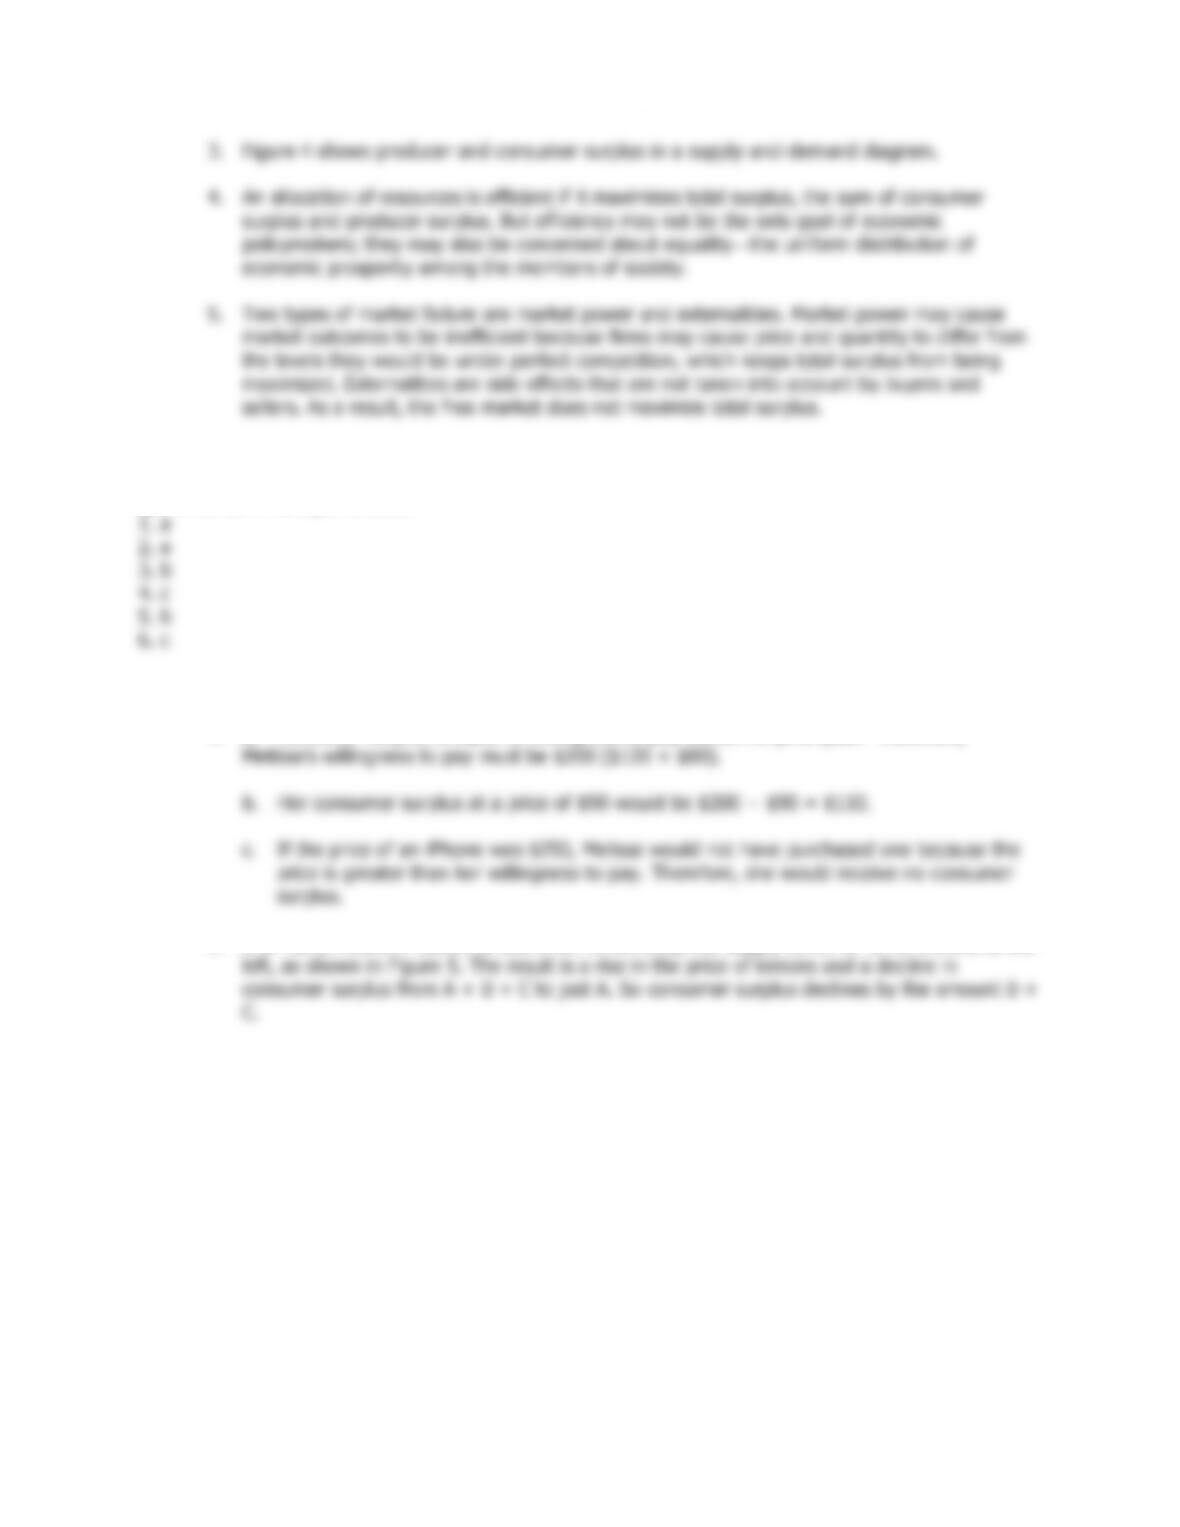
2. If an early freeze in California sours the lemon crop, the supply curve for lemons shifts to the
Chapter 7/Consumers, Producers, and the Efficiency of Markets ❖ 133
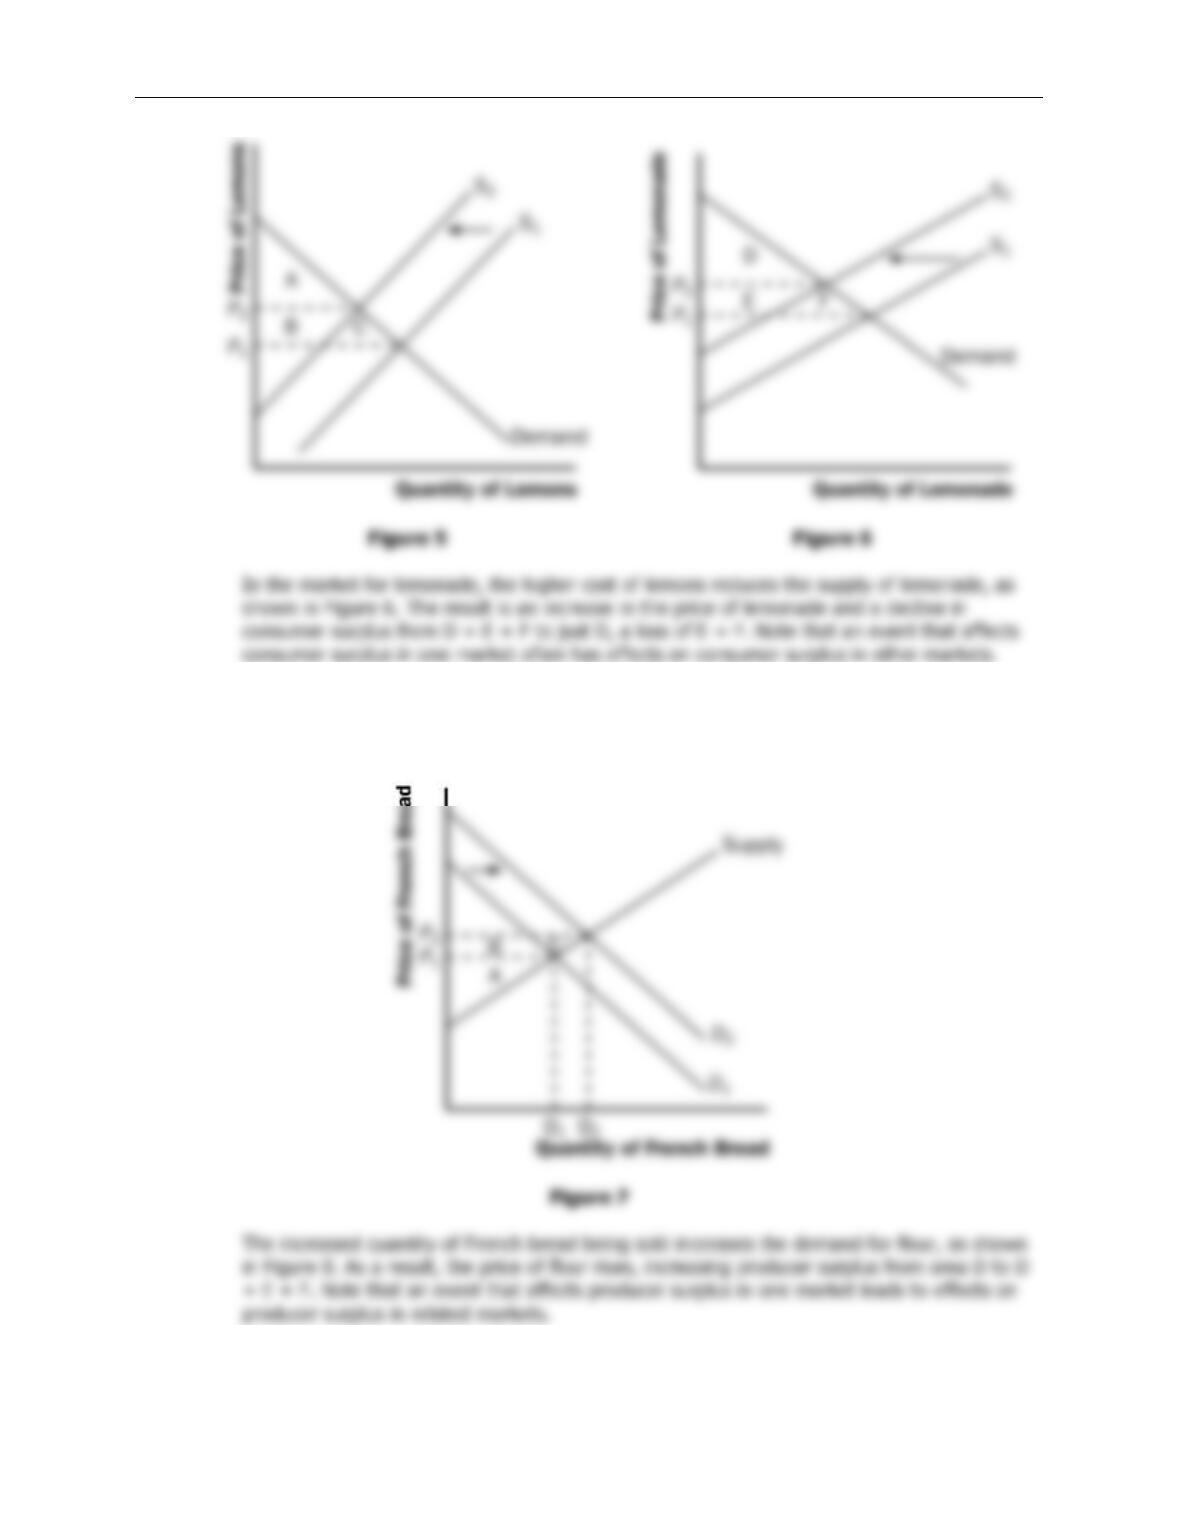
3. A rise in the demand for French bread leads to an increase in producer surplus in the market
for French bread, as shown in Figure 7. The shift of the demand curve leads to an increased
price, which increases producer surplus from area A to area A + B + C.
134 ❖ Chapter 7/Consumers, Producers, and the Efficiency of Markets
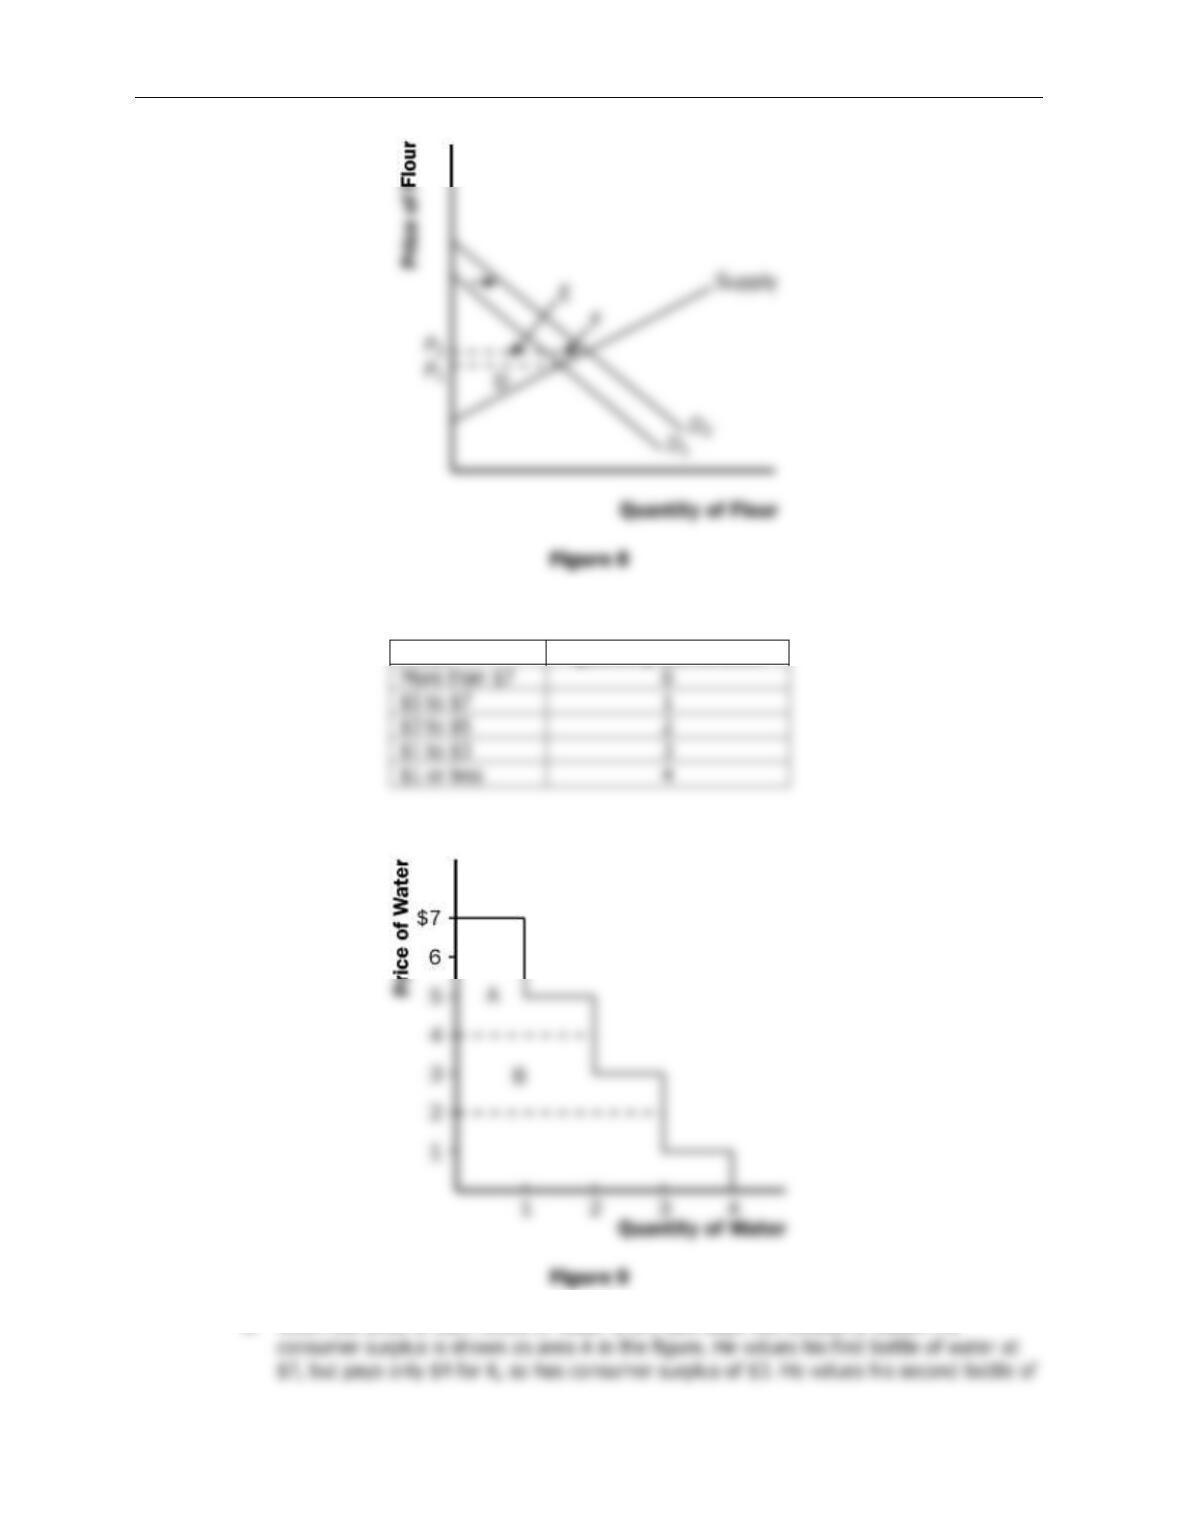
4. a. Bert’s demand schedule is:
Price
Quantity Demanded
Bert’s demand curve is shown in Figure 9.
b. When the price of each bottle of water is $4, Bert buys two bottles of water. His
Chapter 7/Consumers, Producers, and the Efficiency of Markets ❖ 135
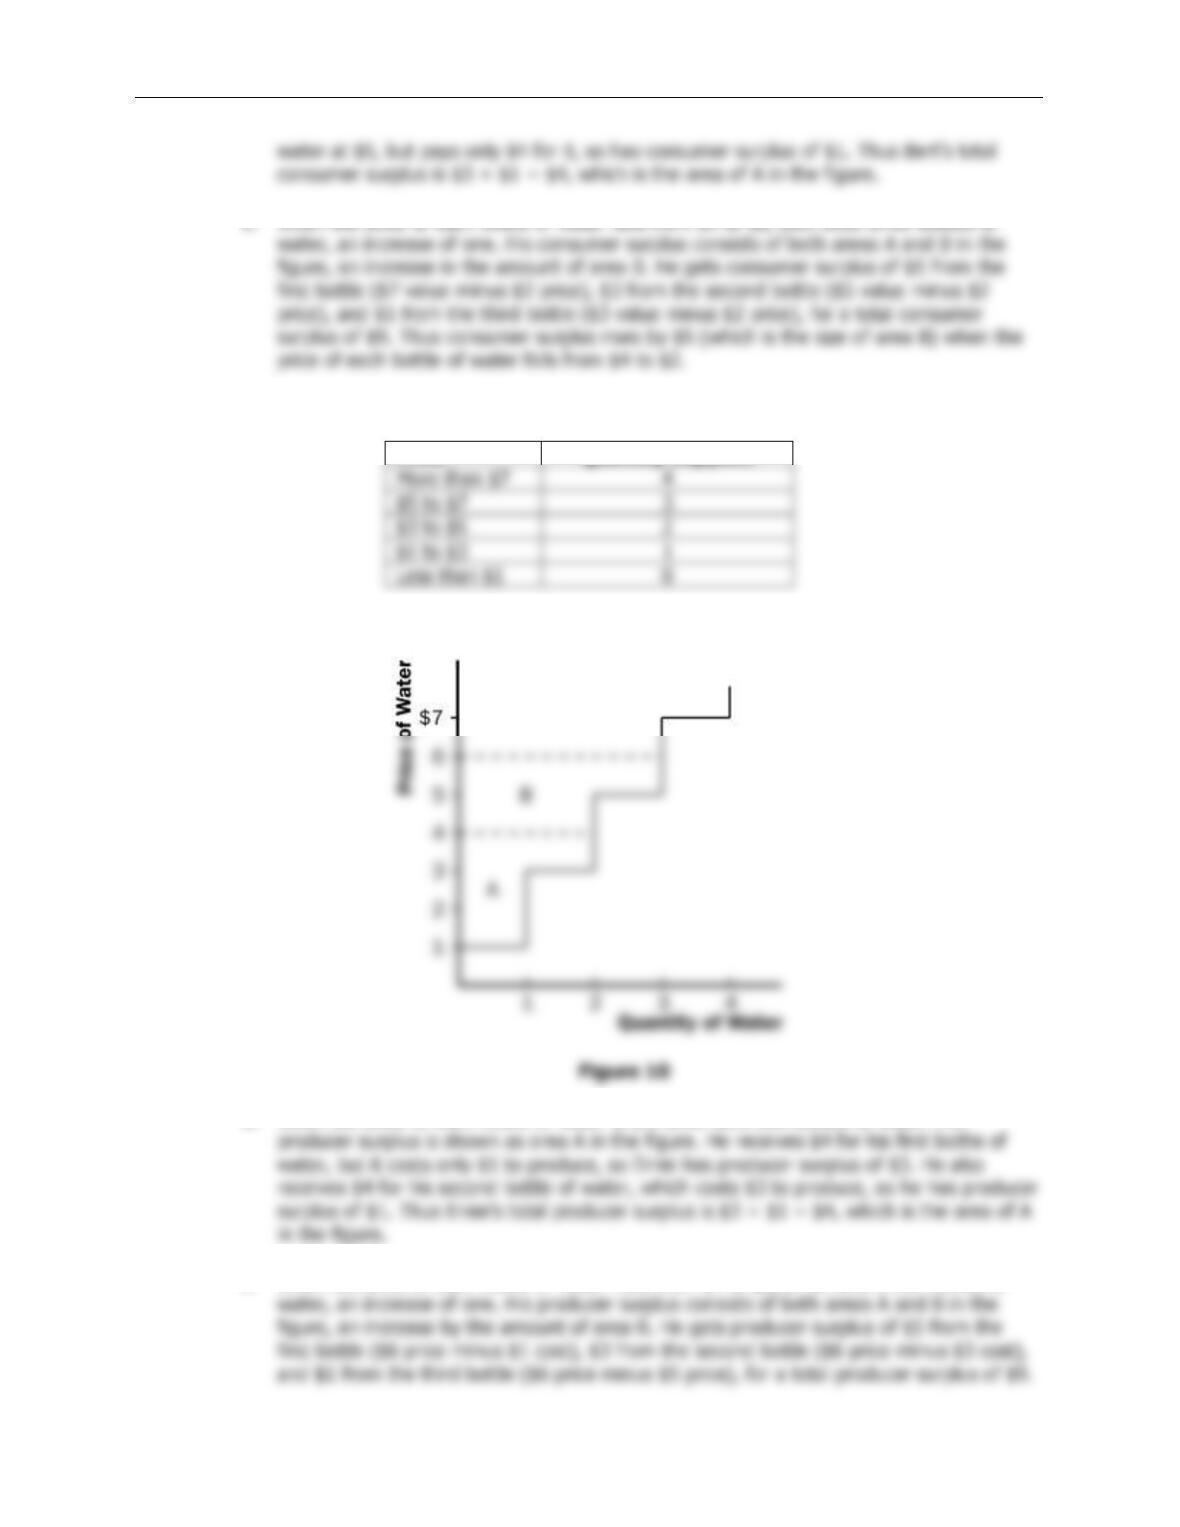
5. a. Ernie’s supply schedule for water is:
Price
Quantity Supplied
Ernie’s supply curve is shown in Figure 10.
b. When the price of each bottle of water is $4, Ernie sells two bottles of water. His
c. When the price of each bottle of water rises from $4 to $6, Ernie sells three bottles of
136 ❖ Chapter 7/Consumers, Producers, and the Efficiency of Markets
6. a. From Ernie’s supply schedule and Bert’s demand schedule, the quantity demanded and
supplied are:
Price
Quantity Supplied
Quantity Demanded
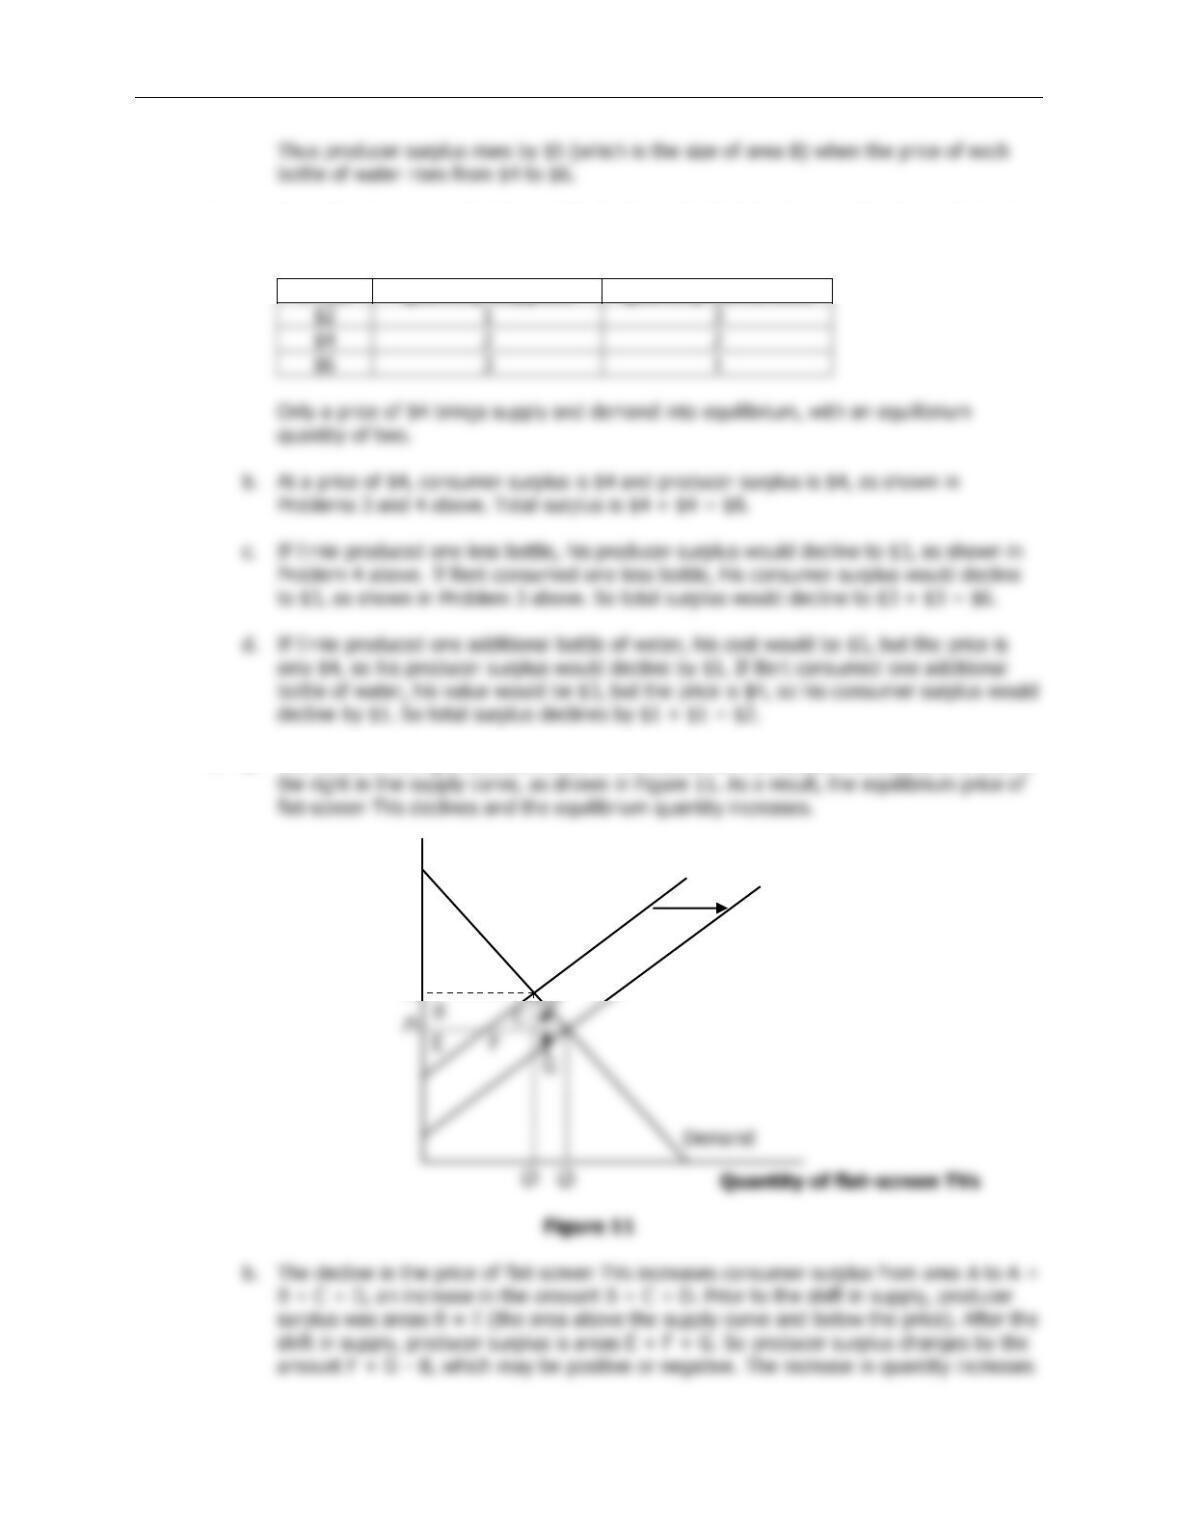
7. a. The effect of falling production costs in the market for flat-screen TVs results in a shift to
Quantity of flat-screen TVs
Q
B
F
C
D
Price of flat-screen
TVs
S2
S1
P
1
A
Chapter 7/Consumers, Producers, and the Efficiency of Markets ❖ 137
Demand
Quantity of flat-screen TVs
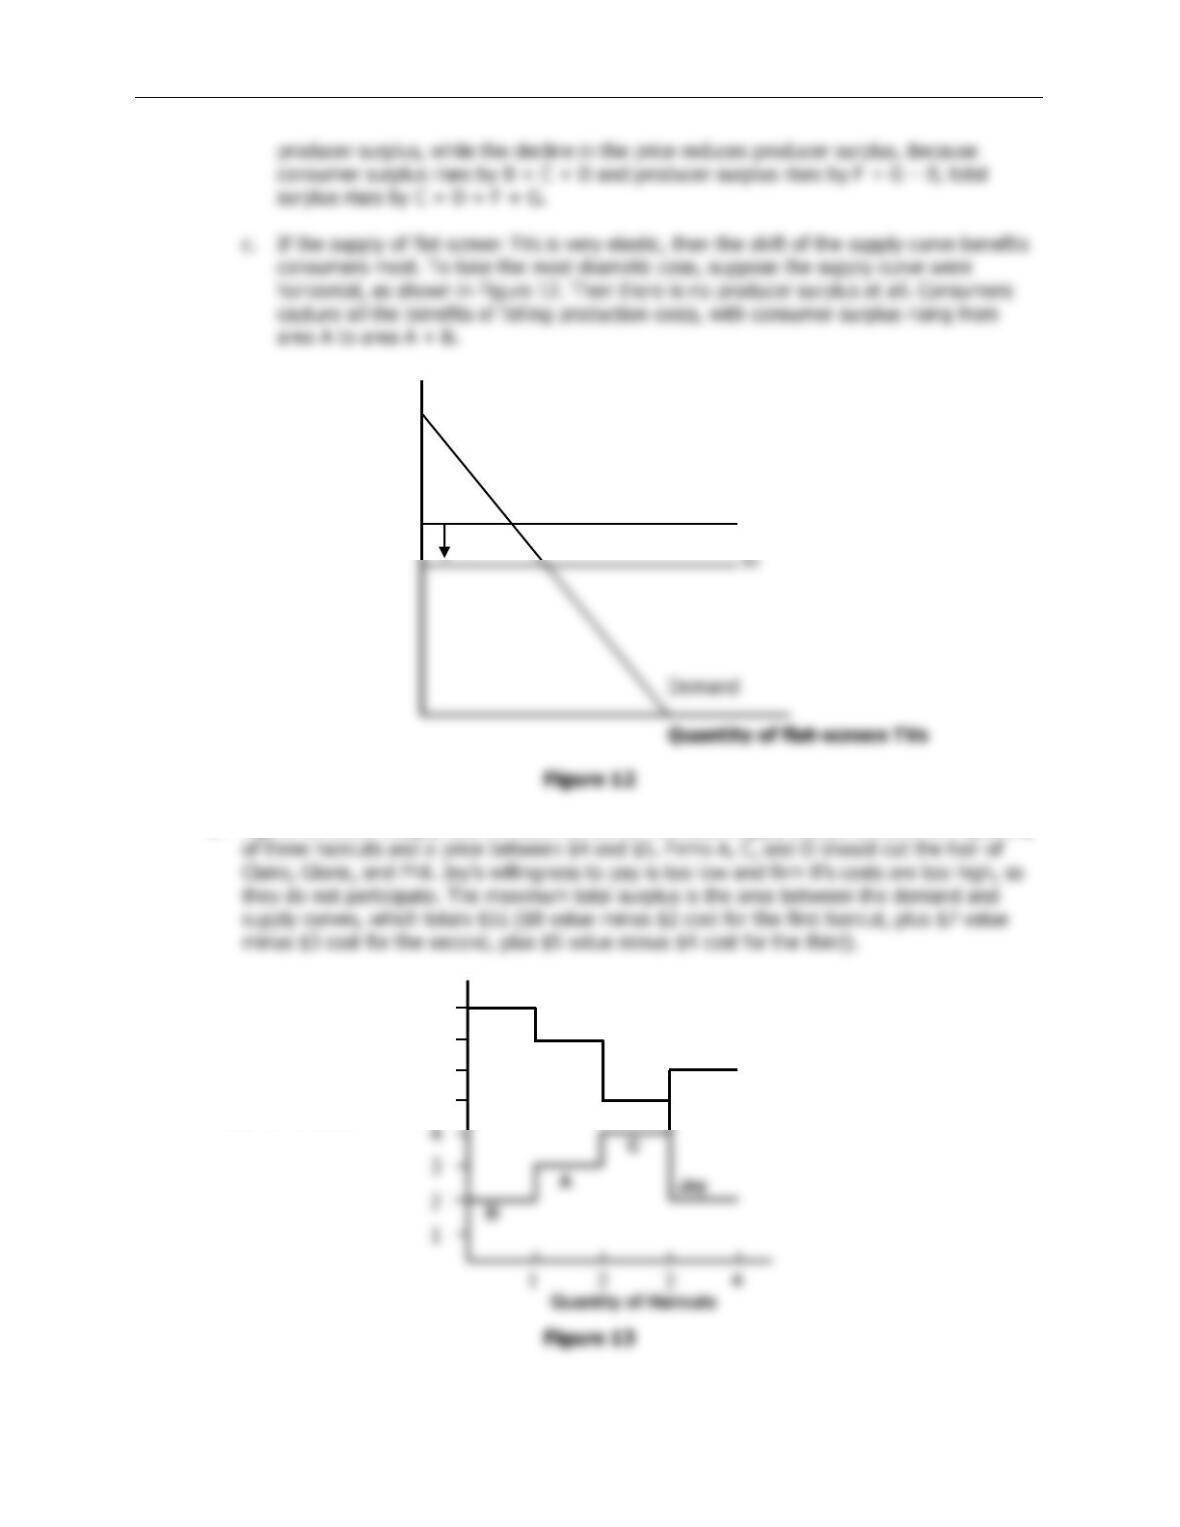
8. Figure 13 shows supply and demand curves for haircuts. Supply equals demand at a quantity
1
2
3
4
1
2
3
4
Quantity of Haircuts
D
A
C
5
6
7
8
Price of Haircuts
Claire
Gloria
Phil
B
A
B
S1
Price of flat-screen TVs
138 ❖ Chapter 7/Consumers, Producers, and the Efficiency of Markets
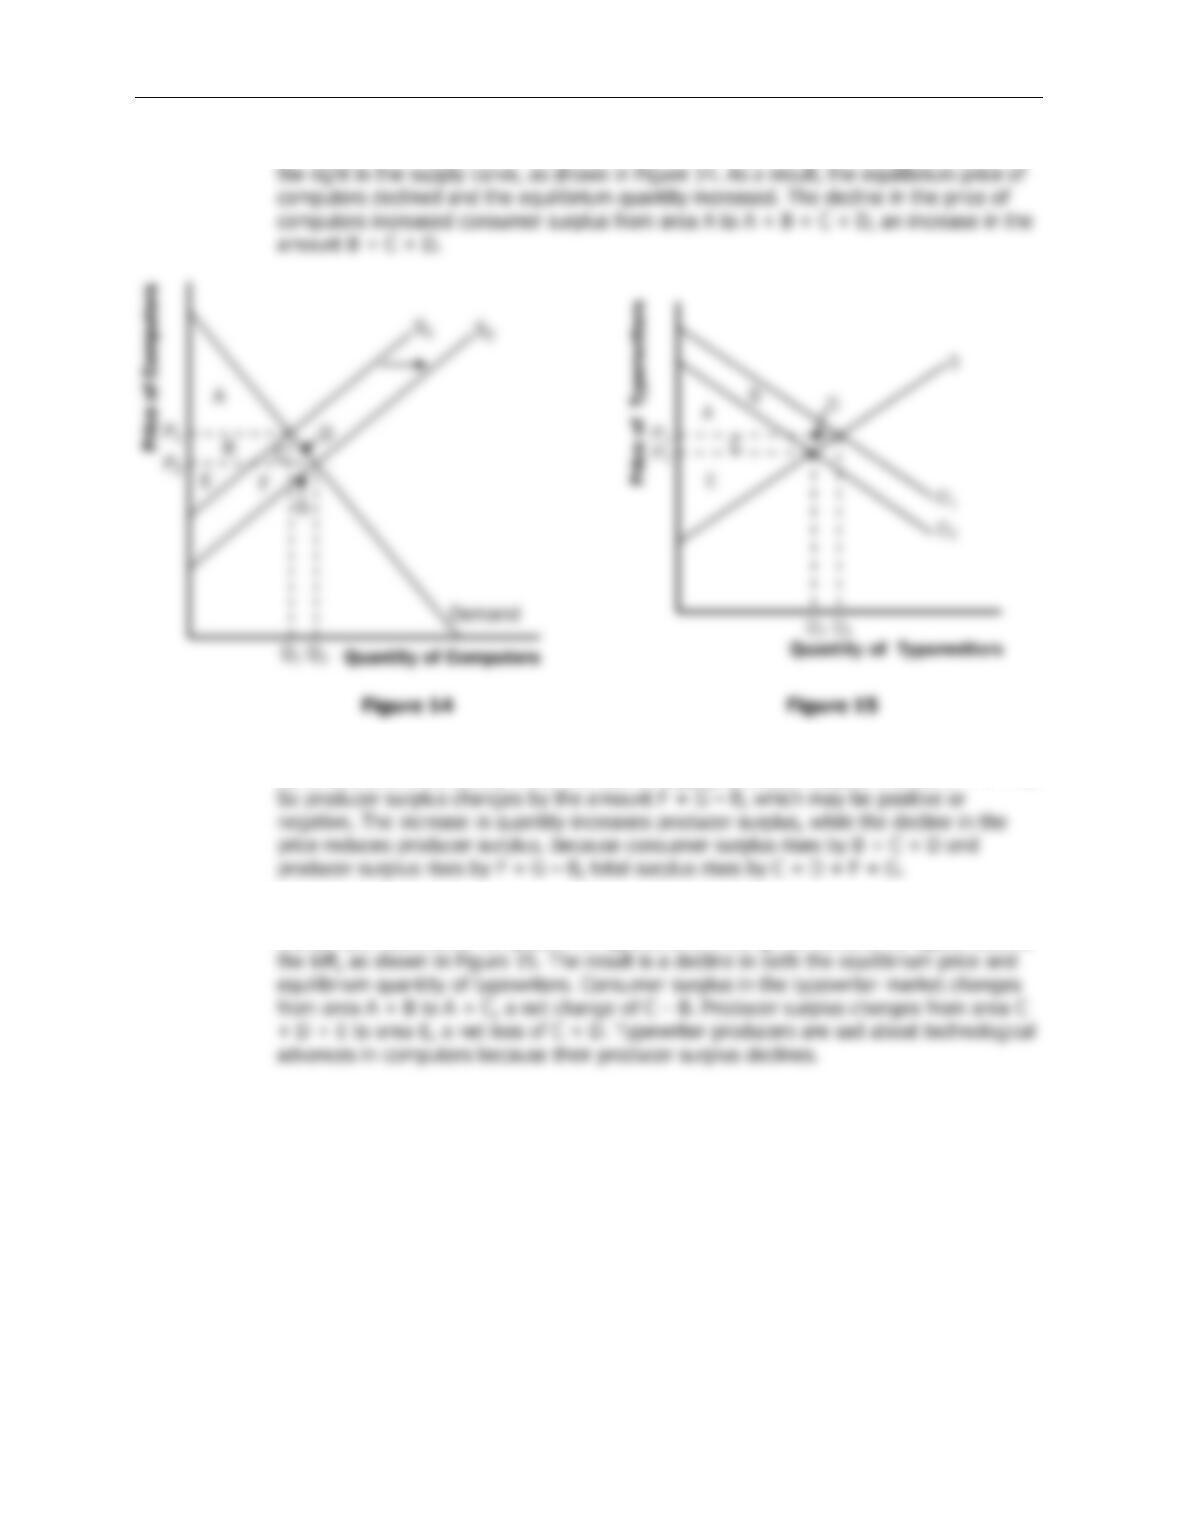
9. a. The effect of falling production costs in the market for computers resulted in a shift to
Prior to the shift in supply, producer surplus was areas B + E (the area above the supply
curve and below the price). After the shift in supply, producer surplus is areas E + F + G.
b. Typewriters and computers are substitutes. The decline in the price of computers means
that people substituted computers for typewriters, shifting the demand for typewriters to
Chapter 7/Consumers, Producers, and the Efficiency of Markets ❖ 139
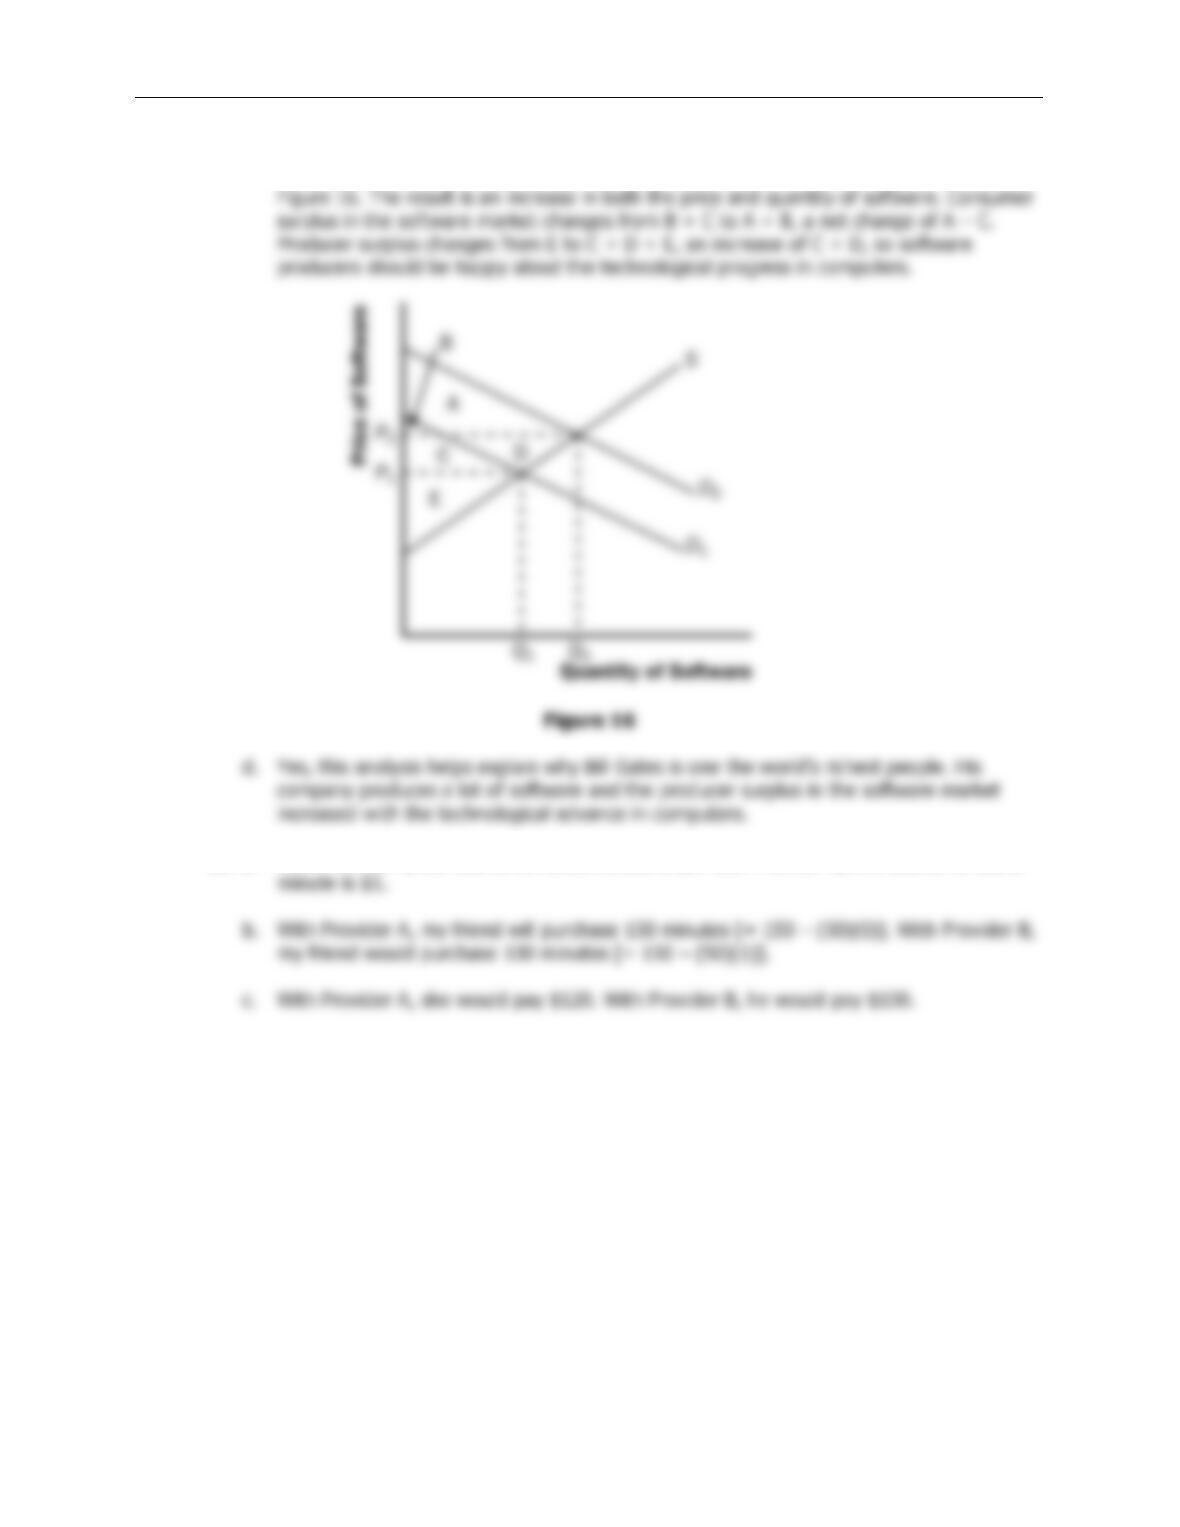
c. Software and computers are complements. When the price of computers decreases, the
demand for software increases. The demand for software shifts to the right, as shown in
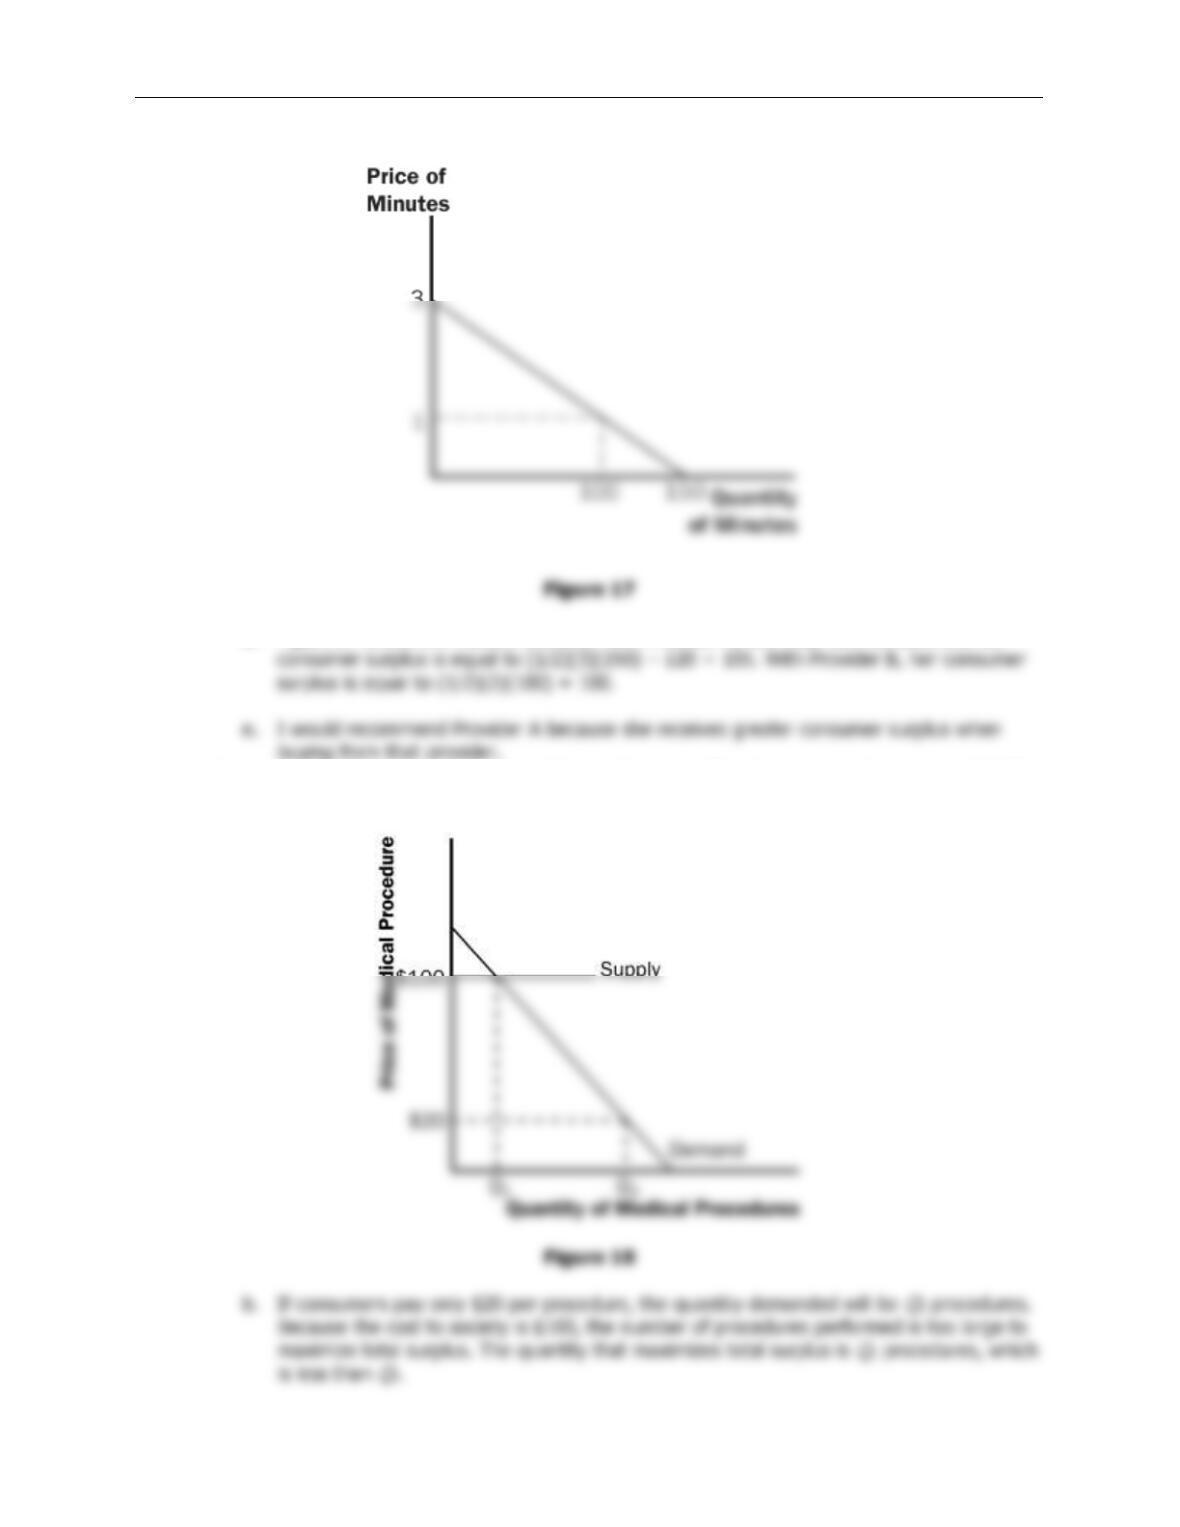
10. a. With Provider A, the cost of an extra minute is $0. With Provider B, the cost of an extra
140 ❖ Chapter 7/Consumers, Producers, and the Efficiency of Markets
d. Figure 17 shows the friend’s demand. With Provider A, she buys 150 minutes and her
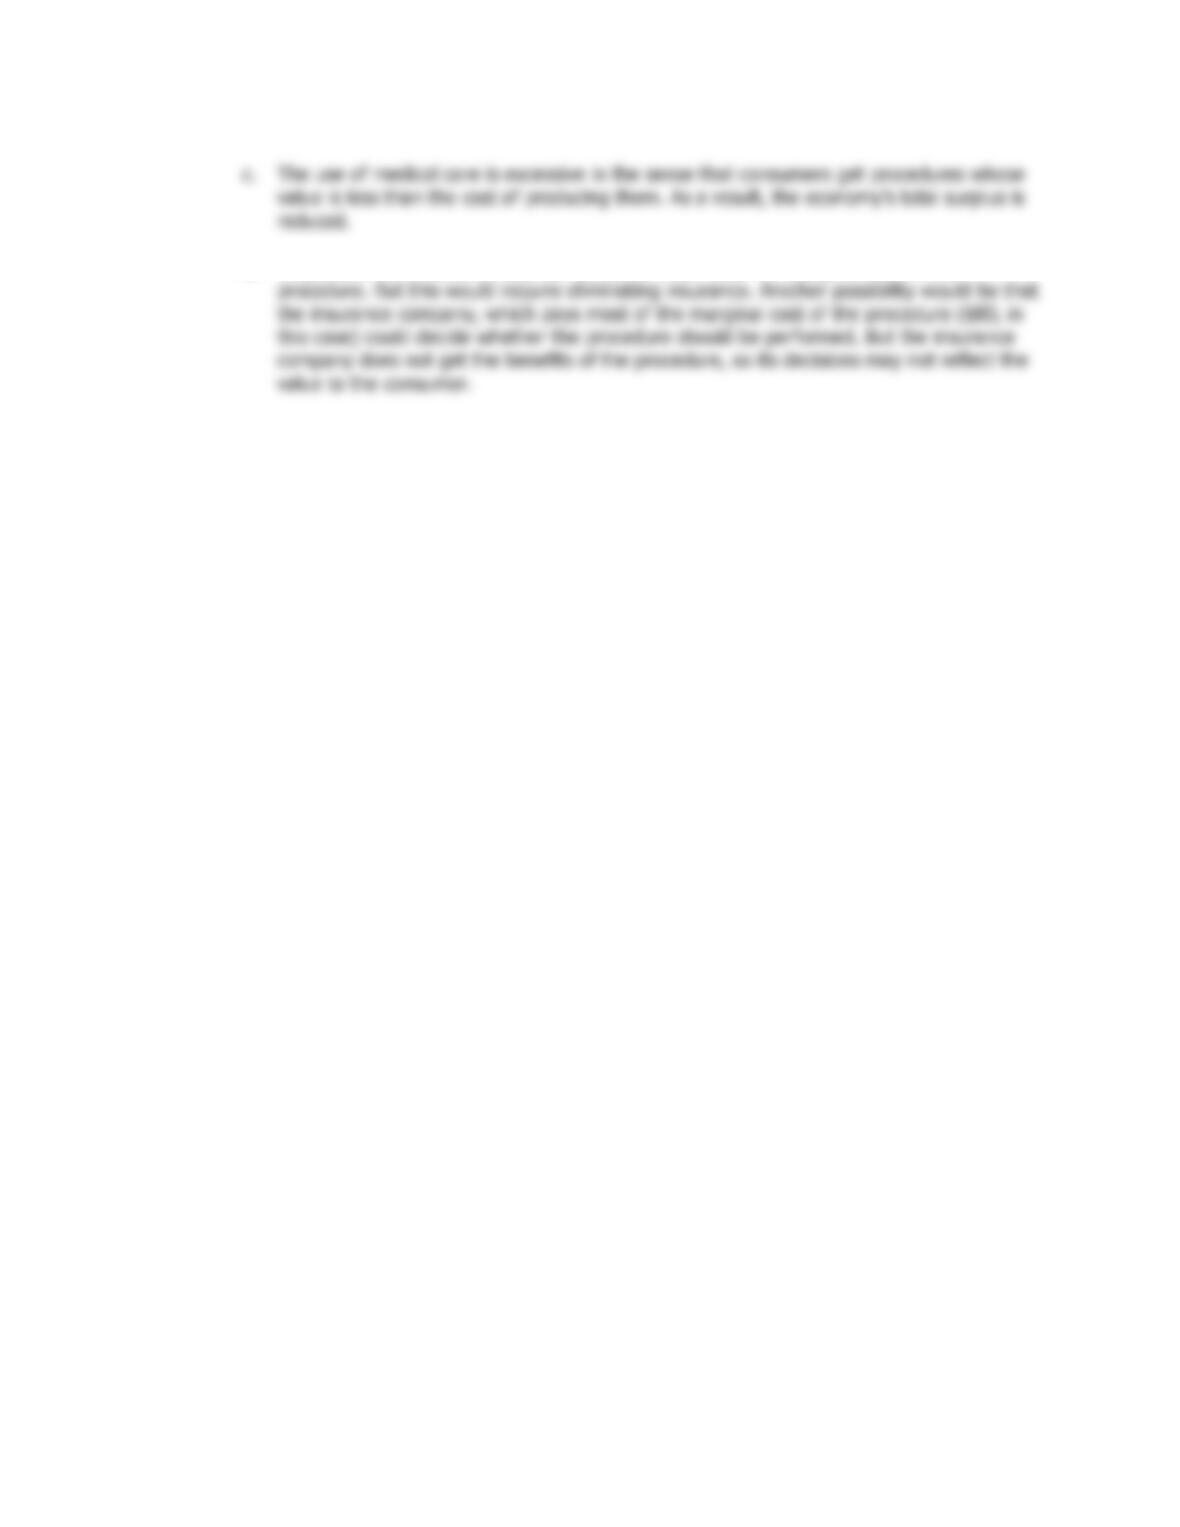
11. a. Figure 18 illustrates the demand for medical care. If each procedure has a price of $100,
quantity demanded will be
Q
1 procedures.
Chapter 7/Consumers, Producers, and the Efficiency of Markets ❖ 141
d. To prevent this excessive use, the consumer must bear the marginal cost of the