Exercise 7-15 (30 minutes)
1. The first step is to determine the activity rates:
Activity Cost Pools
(a)
Total Cost
(b)
Total Activity
(a) ÷ (b)
Activity Rate
Serving parties …….
$12,000
5,000
parties
$2.40
per party
Serving diners ……..
diners
per diner
Serving drinks ……..
drinks
per drink
According to the activity-based costing system, the cost of serving each
of the parties can be computed as follows:
a. Party of 4 persons who order a total of 3 drinks:
Activity Cost Pool
(a)
Activity Rate
(b)
Activity
(a) × (b)
ABC Cost
Serving parties …….
$2.40
per party
1
party
$ 2.40
Serving diners ……..
$7.50
per diner
4
diners
30.00
Serving drinks ……..
$2.60
per drink
3
drinks
7.80
Total …………………
$40.20
b. Party of 2 persons who order no drinks:
Activity Cost Pool
(a)
Activity Rate
(b)
Activity
(a) × (b)
ABC Cost
Serving parties …….
$2.40
per party
1
party
$ 2.40
Serving diners ……..
$7.50
per diner
2
diners
15.00
Serving drinks ……..
$2.60
per drink
0
drinks
Total …………………
$17.40
c. Party of 1 person who orders 2 drinks:
Activity Cost Pool
(a)
Activity Rate
(b)
Activity
(a) × (b)
ABC Cost
Serving parties …….
$2.40
per party
1
party
$ 2.40
Serving diners ……..
$7.50
per diner
1
diner
7.50
Serving drinks ……..
$2.60
per drink
2
drinks
5.20
Total …………………
$15.10
Exercise 7-15 (continued)
2. The average cost per diner for each party can be computed by dividing
the total cost of the party by the number of diners in the party as
3. The average cost per diner differs from party to party under the activity-
based costing system for two reasons. First, the $2.40 cost of serving a
party does not depend on the number of diners in the party. Therefore,
the average cost per diner of this activity decreases as the number of
diners in the party increases. With only one diner, the cost is $2.40.
With two diners, the average cost per diner is cut in half to $1.20. With
six diners, the average cost per diner would be only $0.40. And so on.
Second, the average cost per diner differs also because of the
differences in the number of drinks ordered by the diners. If a party
does not order any drinks, as was the case with the party of two, no
costs of serving drinks are assigned to the party.
Problem 7-16 (20 minutes)
1. The cost of serving the local commercial market according to the ABC model can be determined as
follows:
Activity Cost Pool
(a)
Activity Rate
(b)
Activity
(a) × (b)
ABC Cost
Animation concept ……..
$6,000
per proposal
20
proposals
$120,000
Animation production ….
$7,700
per minute of animation
minutes
Contract administration .
$6,600
per contract
contracts
$265,200
2. The margin earned serving the local commercial market is negative, as shown below:
Profitability Analysis
Sales …………………………..……………….
$240,000
Costs:
Animation concept …………………………
$120,000
Contract administration …………………..
Margin ………………………………………….
3. It appears that the local commercial market is losing money and the company would be better off
dropping this market segment. However, not all of the costs included above may be avoidable. If
Problem 7-17 (45 minutes)
1. Under the traditional direct labor-dollar based costing system,
manufacturing overhead is applied to products using the predetermined
overhead rate computed as follows:
Estimated total manufacturing overhead cost
Predetermined =
overhead rate Estimated total direct labor dollars
$508,625
= = $3.13 per DL$
$162,500
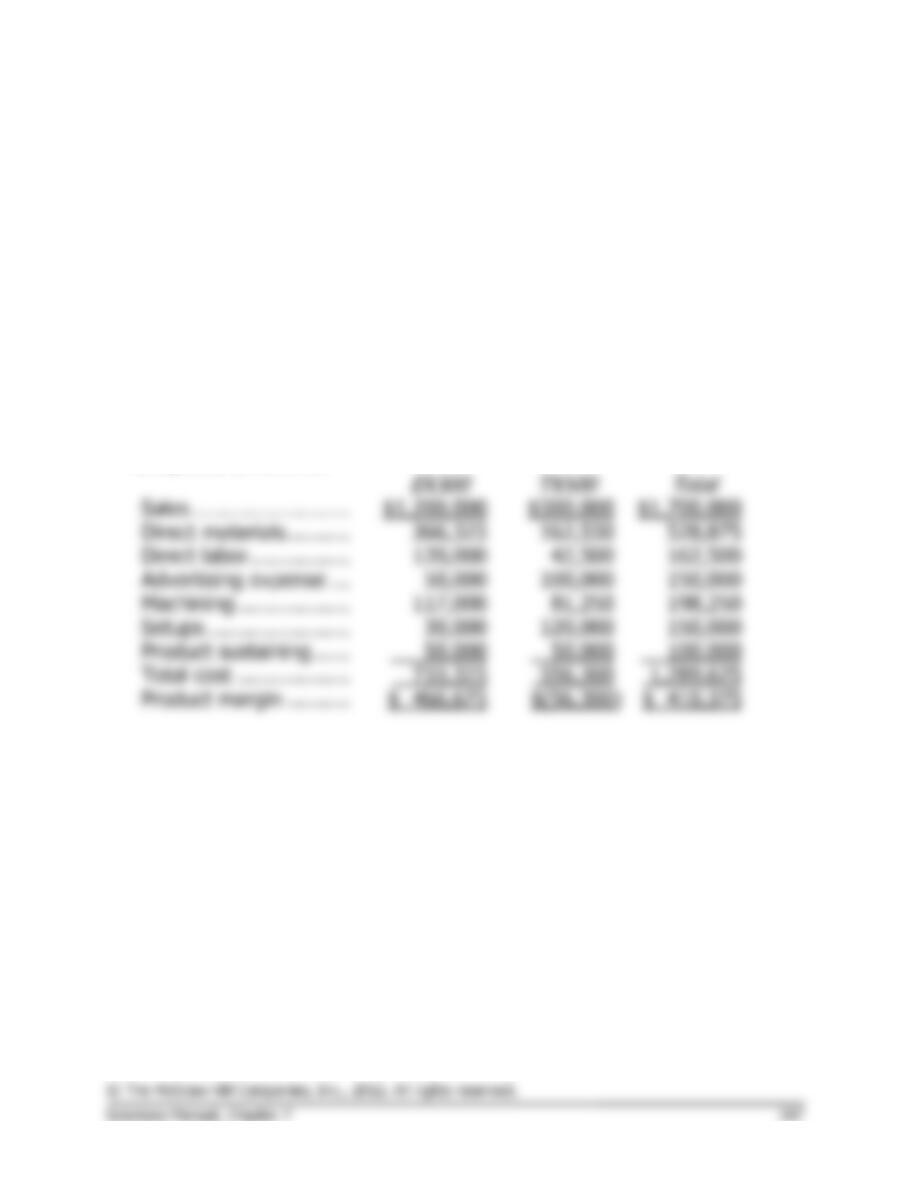
The product margins using the traditional approach would be computed
as follows:
EX300
TX500
Total
Sales ……………………………..
$1,200,000
$500,000
$1,700,000
Direct materials ………………..
366,325
162,550
528,875
Direct labor ……………………..
Total manufacturing cost ……
Product margin ………………..
Problem 7-17 (continued)
2. The first step is to determine the activity rates:
Activity Cost Pools
(a)
Total
Cost
(b)
Total Activity
(a) ÷ (b)
Activity Rate
Machining ………….
$198,250
152,500
MHRs
$1.30
per MHR
Setups ………………
$150,000
375
setup hrs.
$400
per setup hr.
Product sustaining .
$100,000
2
products
$50,000
per product
*The Other activity cost pool is not shown above because it includes
organization-sustaining and idle capacity costs that should not be
assigned to products.
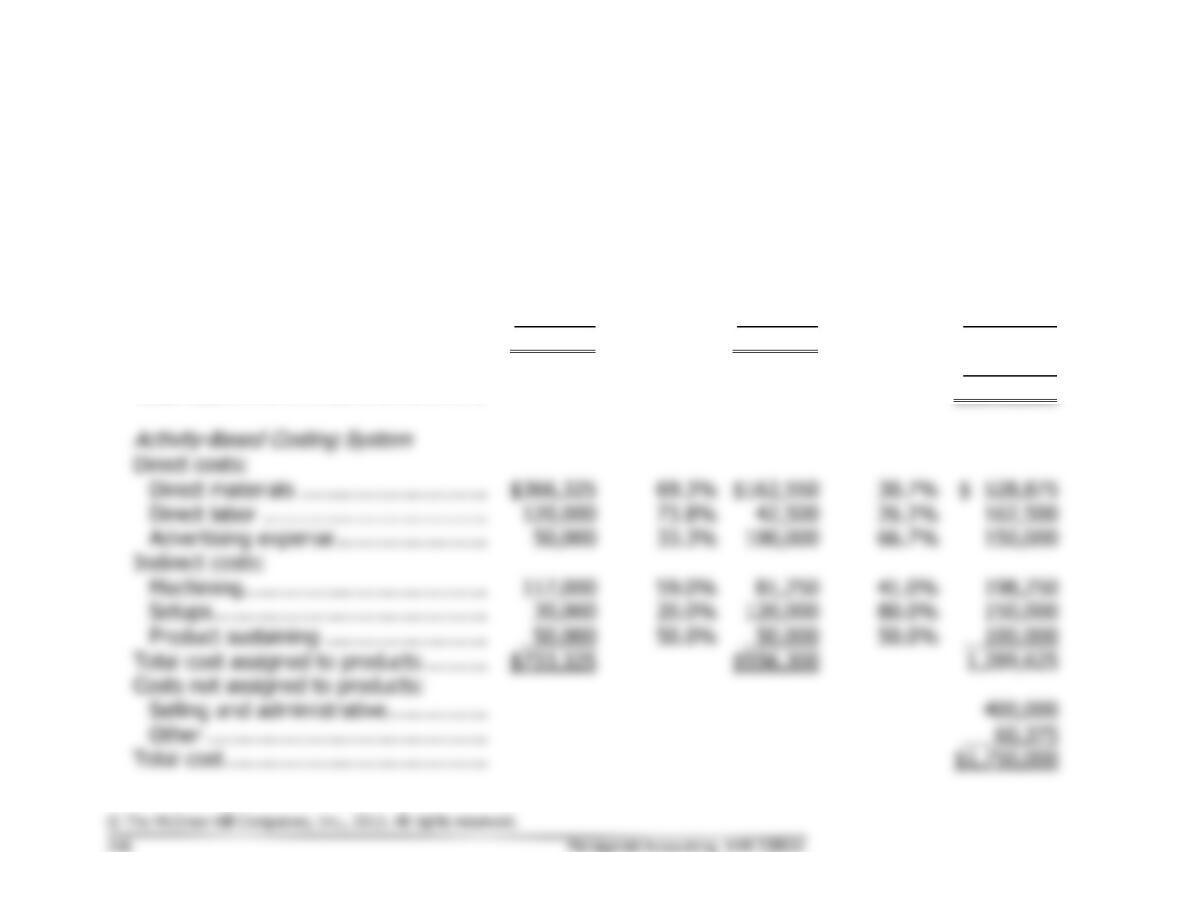
Under the activity-based costing system, the product margins would be
computed as follows:
50,000
$(56,300)
Problem 7-17 (continued)
3. The quantitative comparison is as follows:
EX300
TX500
Total
Traditional Cost System
(a)
Amount
(a) ÷ (c)
%
(b)
Amount
(b) ÷ (c)
%
(c)
Amount
Direct materials …………………………...
$366,325
69.3%
$162,550
30.7%
$ 528,875
Direct labor …………………………………
120,000
73.8%
42,500
26.2%
162,500
Manufacturing overhead ………………..
375,600
73.8%
133,025
26.2%
508,625
Total cost assigned to products ……….
$861,925
$338,075
1,200,000
Selling and administrative ………………
550,000
Total cost ……………………………………
$1,750,000
Direct costs:
69.3%
30.7%
120,000
73.8%
42,500
26.2%
162,500
117,000
59.0%
81,250
41.0%
198,250
20.0%
80.0%
100,000
Total cost assigned to products ……….
$733,325
$556,300
Costs not assigned to products:
Problem 7-17 (continued)
The traditional and activity-based cost assignments differ for three
reasons. First, the traditional system assigns all $508,625 of
manufacturing overhead to products. The ABC system assigns only
$448,250 of manufacturing overhead to products. The ABC system does
not assign the $60,375 of Other activity costs to products because they
represent organization-sustaining costs. Second, the traditional system
uses one unit-level activity measure, direct labor dollars, to assign
Problem 7-18 (45 minutes)
1. Under the traditional direct labor-hour based costing system,
manufacturing overhead is applied to products using the predetermined
overhead rate computed as follows:
Estimated total manufacturing overhead cost
Predetermined =
overhead rate Estimated total direct labor – hours
$2,200,000
= = $20.00 per DLH
110,000 DLHs *
*25,000 units of Xactive @ 1.4 DLH per unit + 75,000 units of the
Pathbreaker @ 1.0 DLH per unit = 35,000 DLHs + 75,000 DLHs =
110,000 DLHs
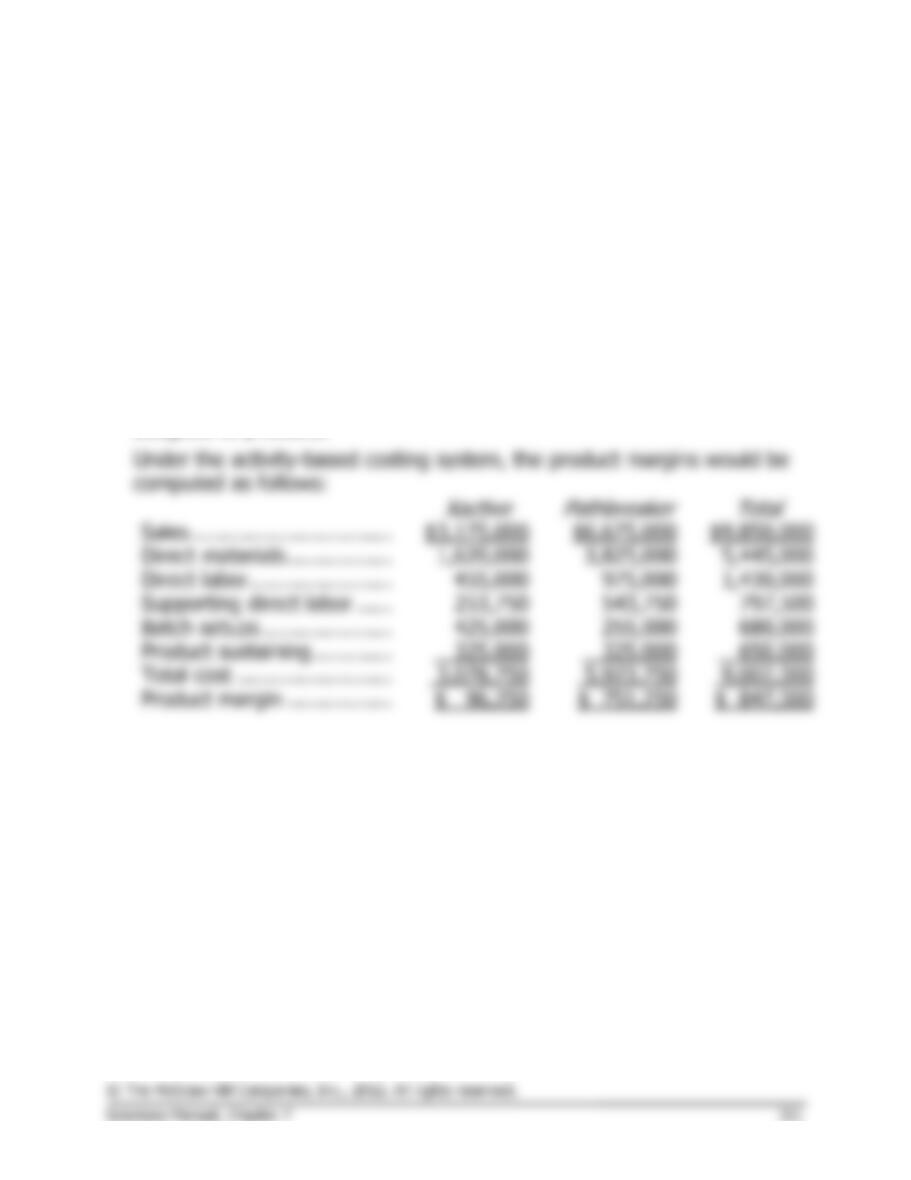
Problem 7-18 (continued)
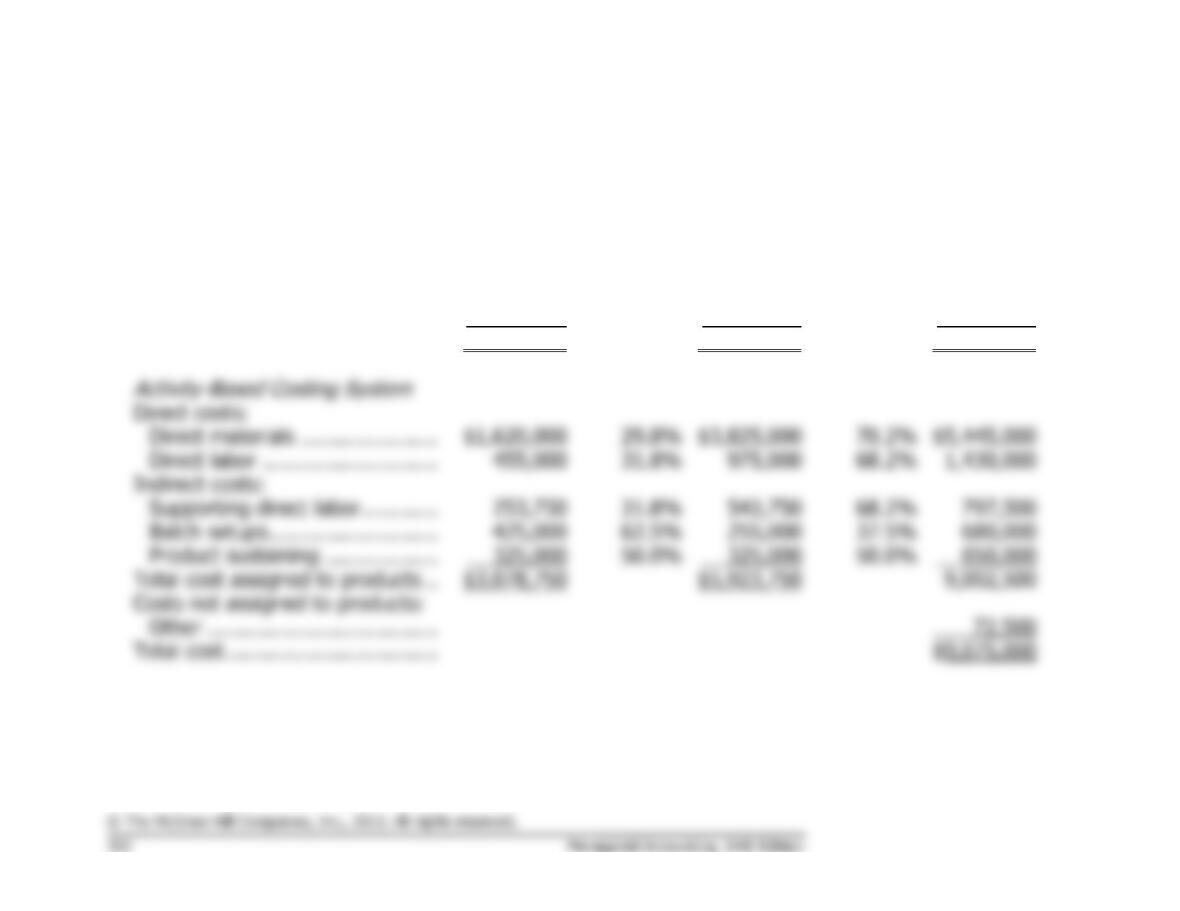
2. The first step is to determine the activity rates:
Activity Cost Pools
(a)
Total
Cost
(b)
Total Activity
(a) ÷ (b)
Activity Rate
Supporting direct
labor ………………
$797,500
110,000
DLHs
$7.25
per DLH
Batch setups ………
$680,000
400
setups
$1,700
per setup
Product sustaining .
$650,000
2
products
$325,000
per product
*The Other activity cost pool is not shown above because it includes
organization-sustaining and idle capacity costs that should not be
assigned to products.
425,000
$ 847,500
Problem 7-18 (continued)
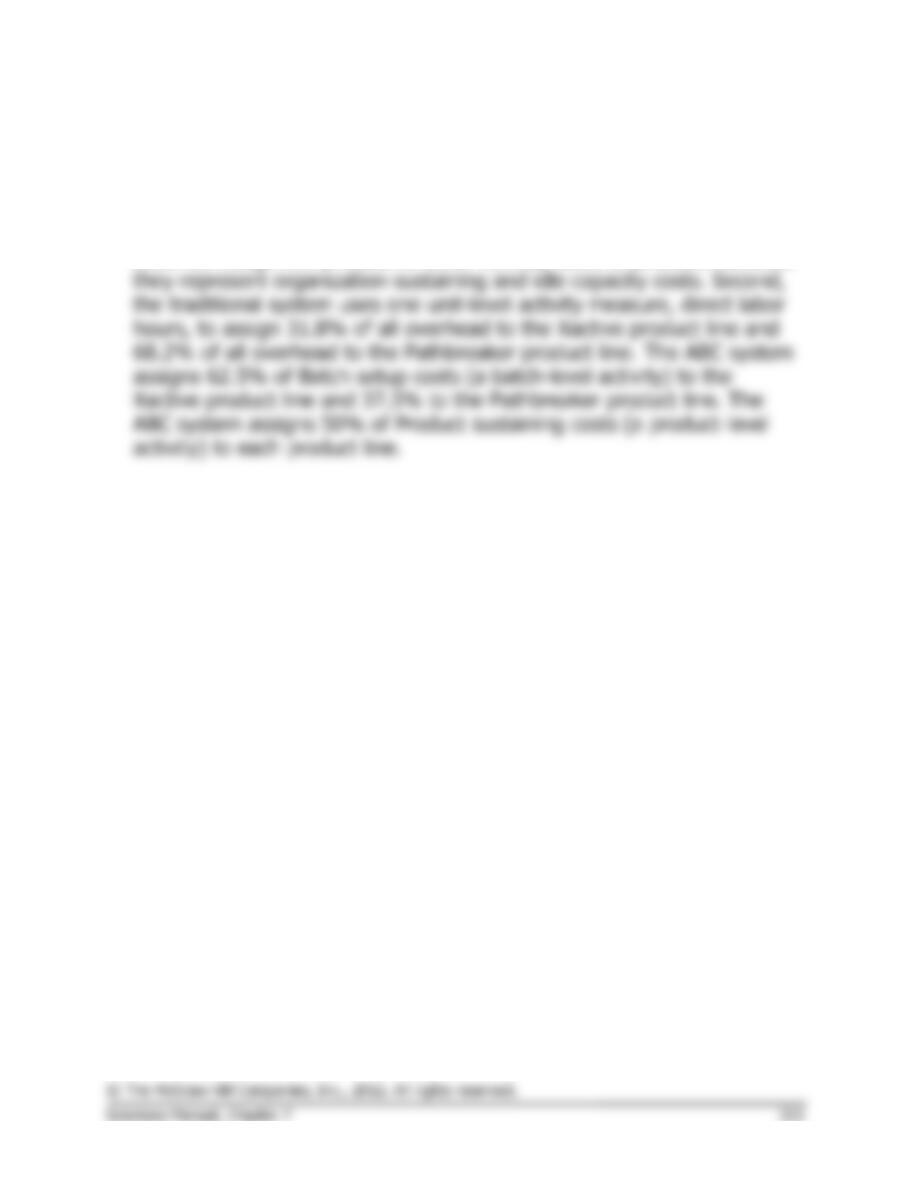
3. The quantitative comparison is as follows:
Xactive
Pathbreaker
Total
Traditional Cost System
(a)
Amount
(a) ÷ (c)
%
(b)
Amount
(b) ÷ (c)
%
(c)
Amount
Direct materials …………………….
$1,620,000
29.8%
$3,825,000
70.2%
$5,445,000
Direct labor ………………………….
455,000
31.8%
975,000
68.2%
1,430,000
Manufacturing overhead …………
700,000
31.8%
1,500,000
68.2%
2,200,000
Total cost assigned to products ..
$2,775,000
$6,300,000
$9,075,000
Direct costs:
$1,620,000
29.8%
$3,825,000
70.2%
$5,445,000
31.8%
68.2%
Indirect costs:
31.8%
68.2%
62.5%
37.5%
50.0%
50.0%
Total cost assigned to products ..
$5,923,750
Costs not assigned to products:
Total cost …………………………….
$9,075,000
Problem 7-18 (continued)
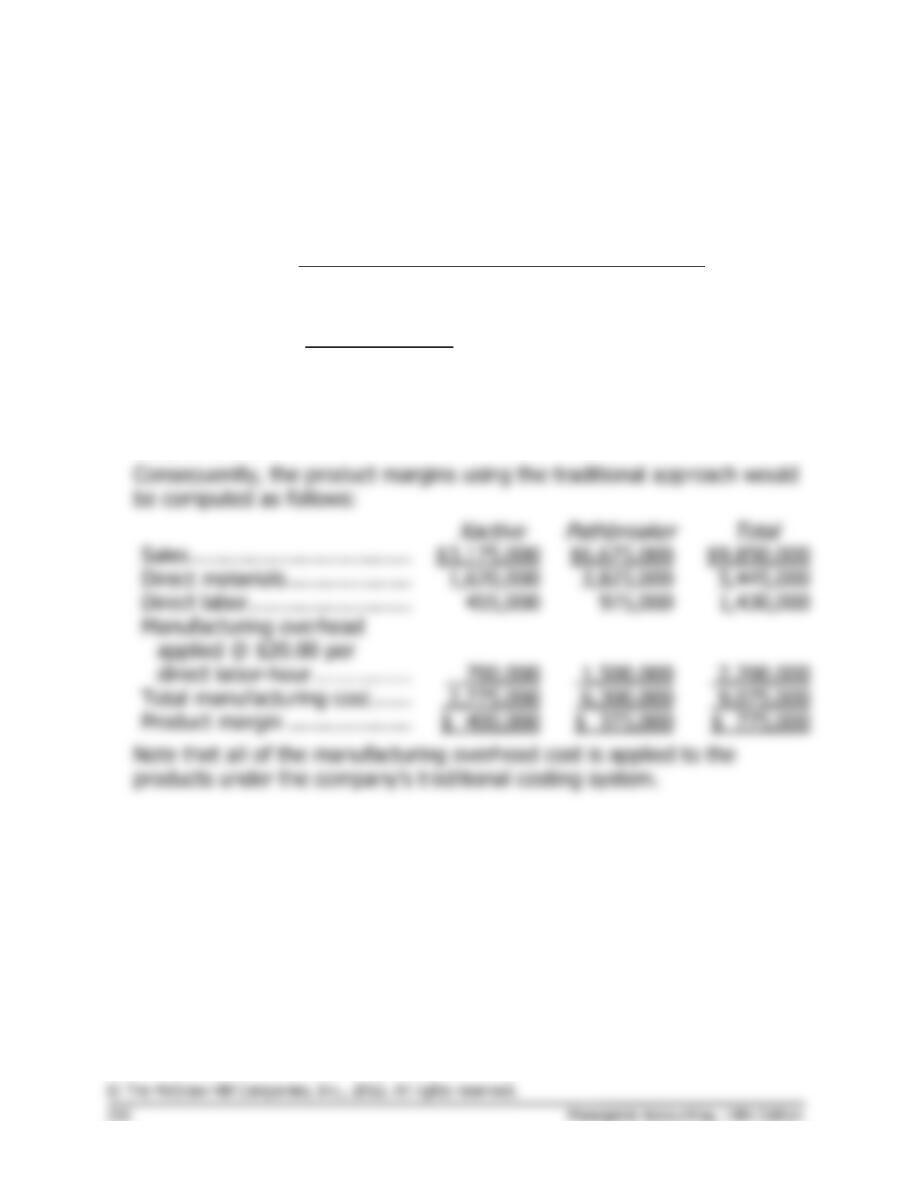
The traditional and activity-based cost assignments differ for two
reasons. First, the traditional system assigns all $2,200,000 of
manufacturing overhead to products. The ABC system assigns only
$2,127,500 of manufacturing overhead to products. The ABC system
does not assign the $72,500 of Other activity costs to products because
Problem 7-19 (45 minutes)
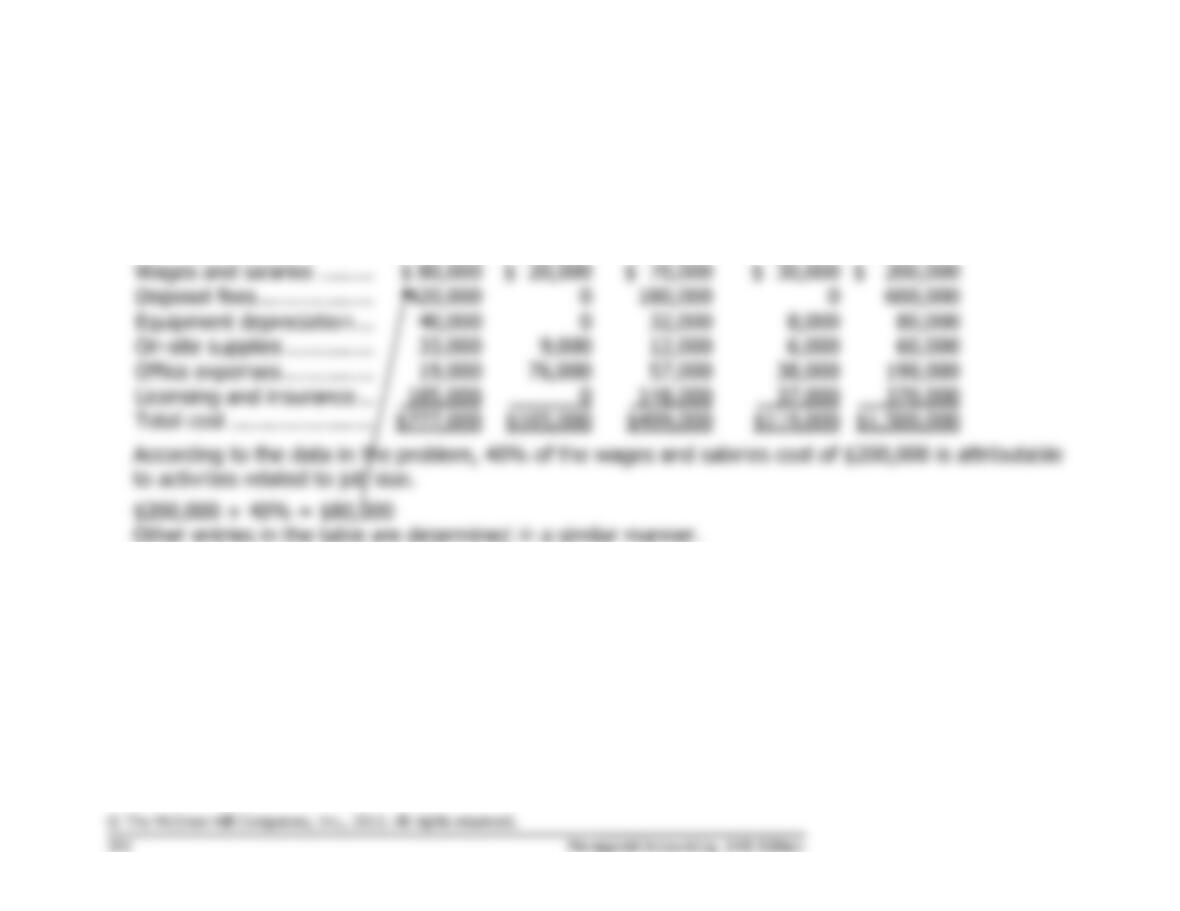
1. The results of the first-stage allocation appear below:
Removing
Asbestos
Estimating
and Job
Setup
Working on
Nonroutine
Jobs
Other
Totals
Wages and salaries ………
Disposal fees ……………….
Equipment depreciation …
Office expenses ……………
Licensing and insurance …
Total cost …………………..
2.
Activity Cost Pool
(a)
Total Cost
(b)
Total Activity
(a) ÷ (b)
Activity Rate
Removing
asbestos ………..
$777,000
500
thousand square feet
$1,554
per thousand square feet
Estimating and job
setup …………….
$105,000
200
jobs
$525
per job
Working on
nonroutine jobs .
$499,000
25
nonroutine jobs
$19,960
per nonroutine job
Problem 7-19 (continued)
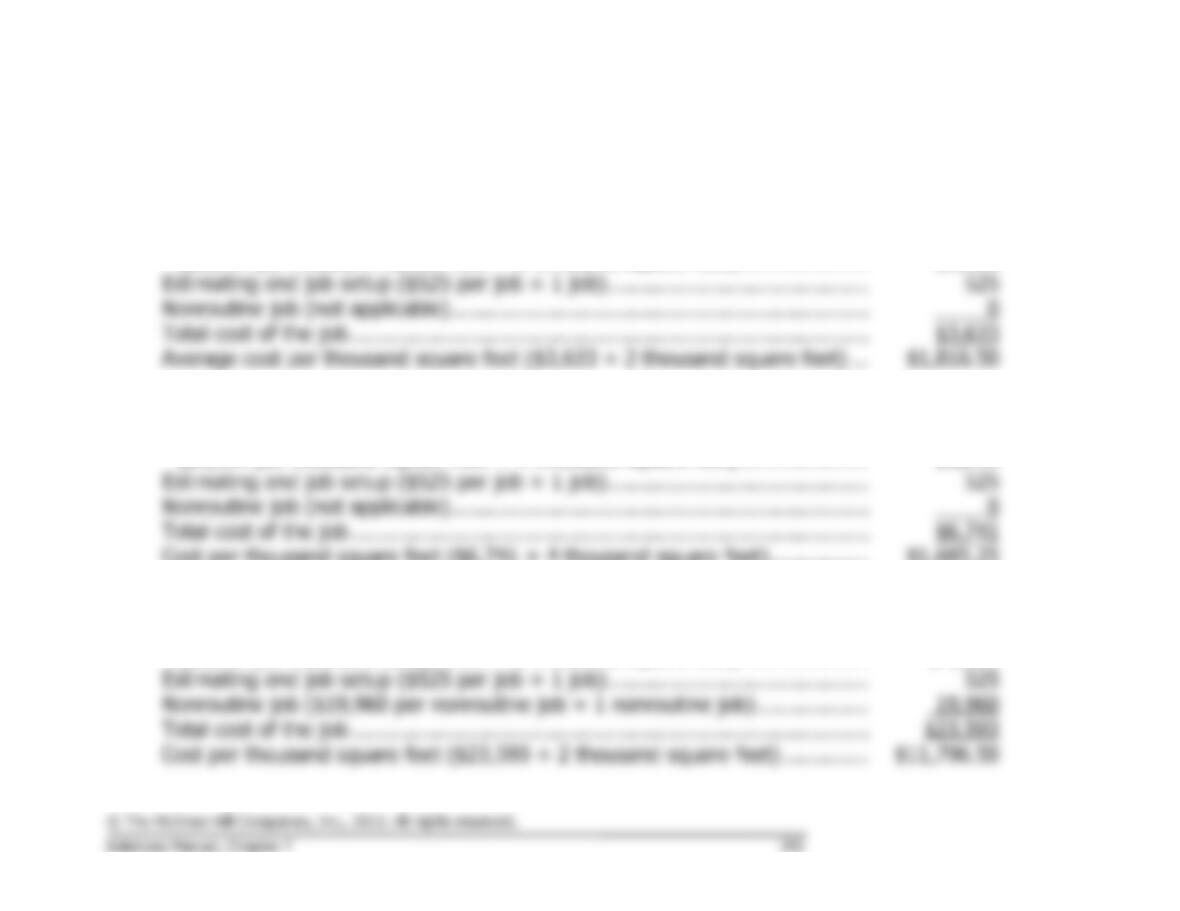
3. The costs of each of the jobs can be computed as follows using the activity rates computed above:
a.
Routine two-thousand-square-foot job:
Removing asbestos
($1,554 per thousand square feet × 2 thousand square feet) …………………
$3,108
Estimating and job setup ($525 per job × 1 job) ……………………………………
Nonroutine job (not applicable) ………………………………………………………….
0
Total cost of the job ………………………………………………………………………..
$3,633
Average cost per thousand square feet ($3,633 ÷ 2 thousand square feet) …
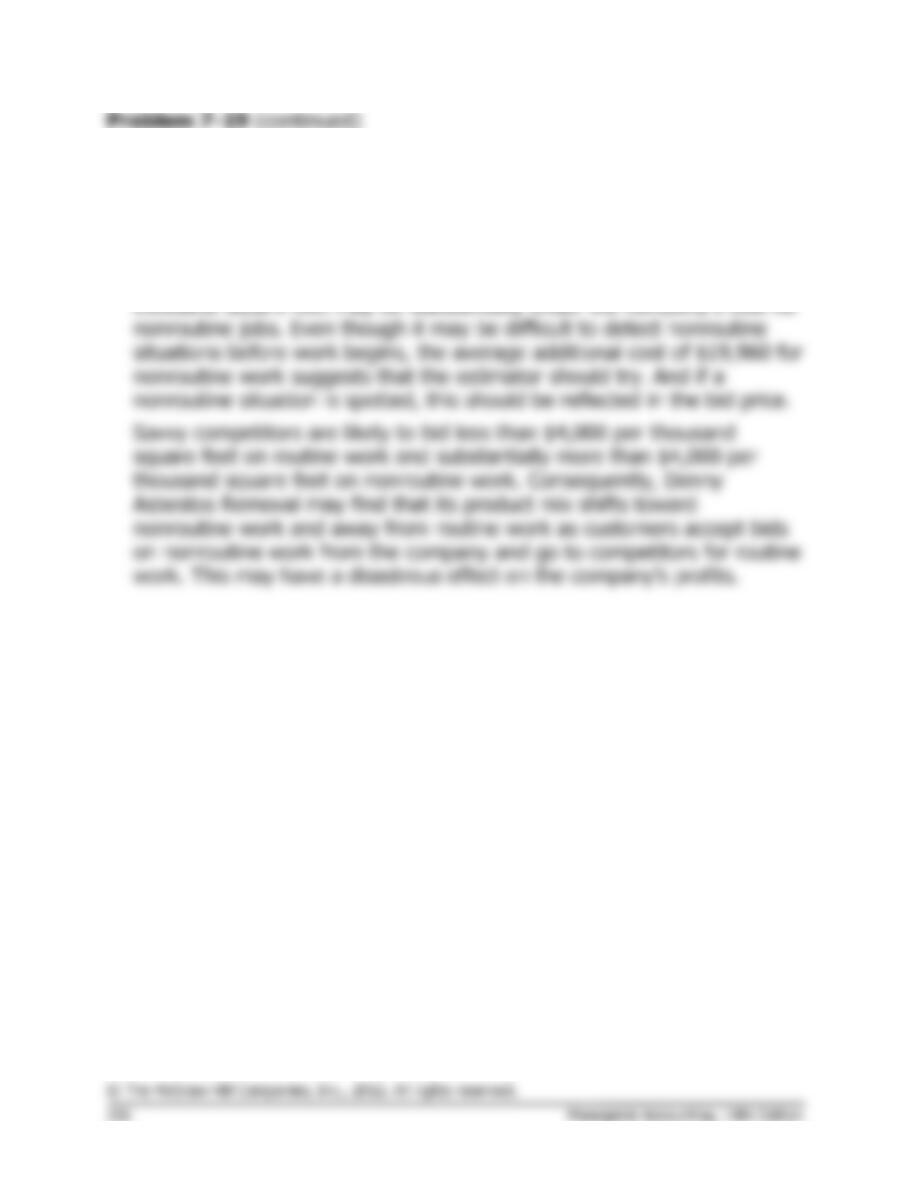
b.
Routine four-thousand-square-foot job:
Removing asbestos
($1,554 per thousand square feet × 4 thousand square feet) …………………
$6,216
Estimating and job setup ($525 per job × 1 job) ……………………………………
Nonroutine job (not applicable) ………………………………………………………….
0
Total cost of the job ………………………………………………………………………..
$6,741
Cost per thousand square feet ($6,741 ÷ 4 thousand square feet) …………….
$1,685.25
c.
Nonroutine two-thousand-square-foot job:
Removing asbestos
($1,554 per thousand square feet × 2 thousand square feet) …………………
$ 3,108
Estimating and job setup ($525 per job × 1 job) ……………………………………
Nonroutine job ($19,960 per nonroutine job × 1 nonroutine job) ………………
Total cost of the job ………………………………………………………………………..
4. The objectivity of the interview data can be questioned since the on-site
work supervisors were undoubtedly trying to prove their case about the
cost of nonroutine jobs. Nevertheless, the activity-based costing data
certainly suggest that dramatic differences exist in the costs of jobs.
While some of the costs may be difficult to adjust in response to
changes in activity, it does appear that the standard bid of $4,000 per
Problem 7-20 (45 minutes)
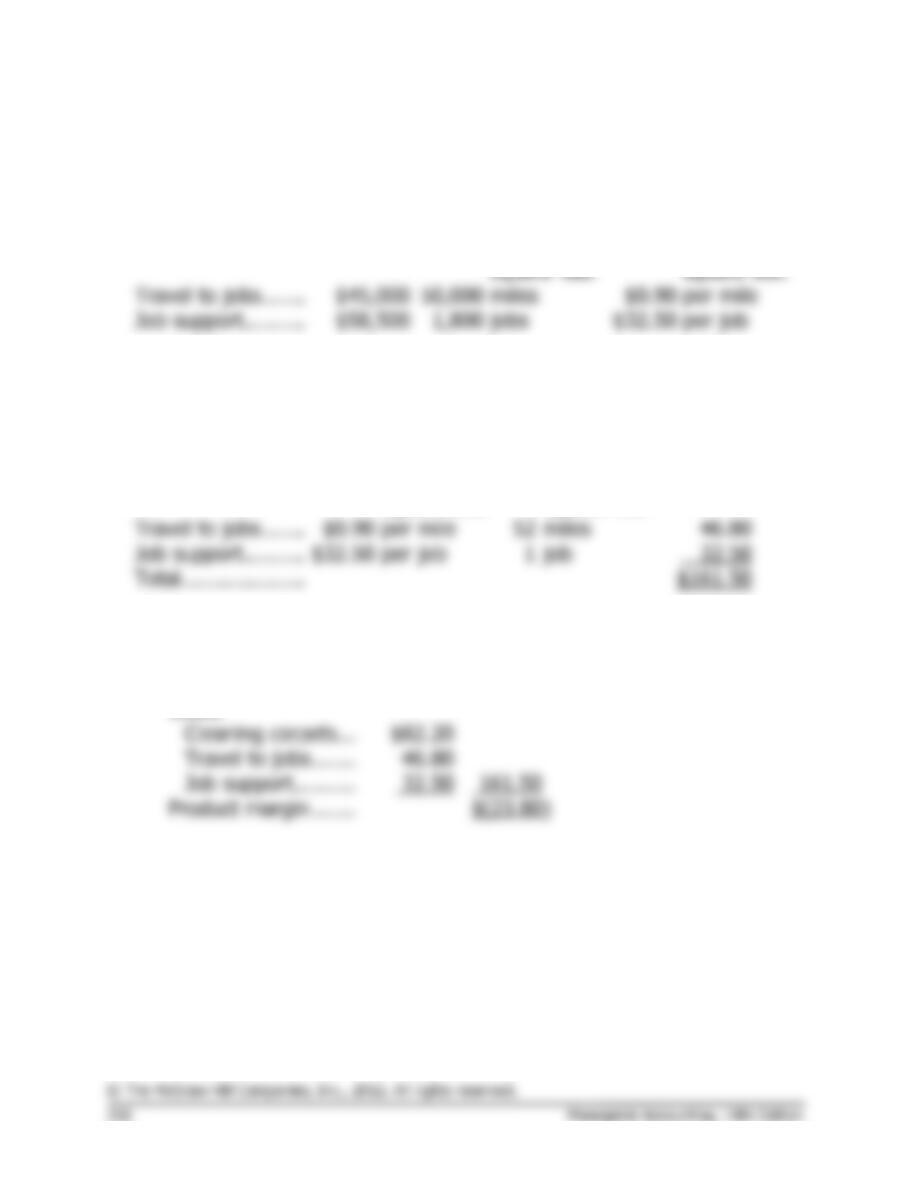
1. The first-stage allocation of costs to activity cost pools appears below:
Distribution of Resource Consumption
Across Activity Cost Pools
Cleaning
Carpets
Travel
to Jobs
Job
Support
Other
Total
Wages …………………………………
75%
15%
0%
10%
100%
Cleaning supplies …………………..
100%
0%
0%
0%
100%
Cleaning equipment depreciation .
70%
0%
0%
30%
100%
Vehicle expenses ……………………
0%
80%
0%
20%
100%
Office expenses ……………………..
0%
0%
60%
40%
100%
President’s compensation …………
0%
0%
30%
70%
100%
Other
Total
3,000
6,000
Problem 7-20 (continued)
2. The activity rates are computed as follows:
Activity Cost Pool
(a)
Total Cost
(b)
Total Activity
(a) ÷ (b)
Activity Rate
Cleaning carpets…
$137,000
10,000
hundred
$13.70
per hundred
3. The cost for the Lazy Bee Ranch job is computed as follows:
Activity Cost Pool
(a)
Activity Rate
(b)
Activity
(a) × (b)
ABC
Cost
Cleaning carpets …
$13.70
per hundred
square feet
6
hundred
square feet
$ 82.20
per job
4. The product margin can be easily computed below by using the costs
calculated in part (3) above.
Sales ………………….
$137.70
Costs:
Problem 7-20 (continued)
5. Gore Range Carpet Cleaning appears to be losing money on the Lazy
Bee Ranch job. However, caution is advised. Some of the costs may not
be avoidable and hence would have been incurred even if the Lazy Bee
Ranch job had not been accepted. An action analysis (discussed in
Appendix 7A) is a more appropriate starting point for analysis than the
simple report in part (4) above.
6. The company should consider charging a fee for travel to outlying
customers based on the distance traveled and a flat fee per job. At
present, close-in customers are in essence subsidizing service to
outlying customers and large-volume customers are subsidizing service
Appendix 7A
ABC Action Analysis
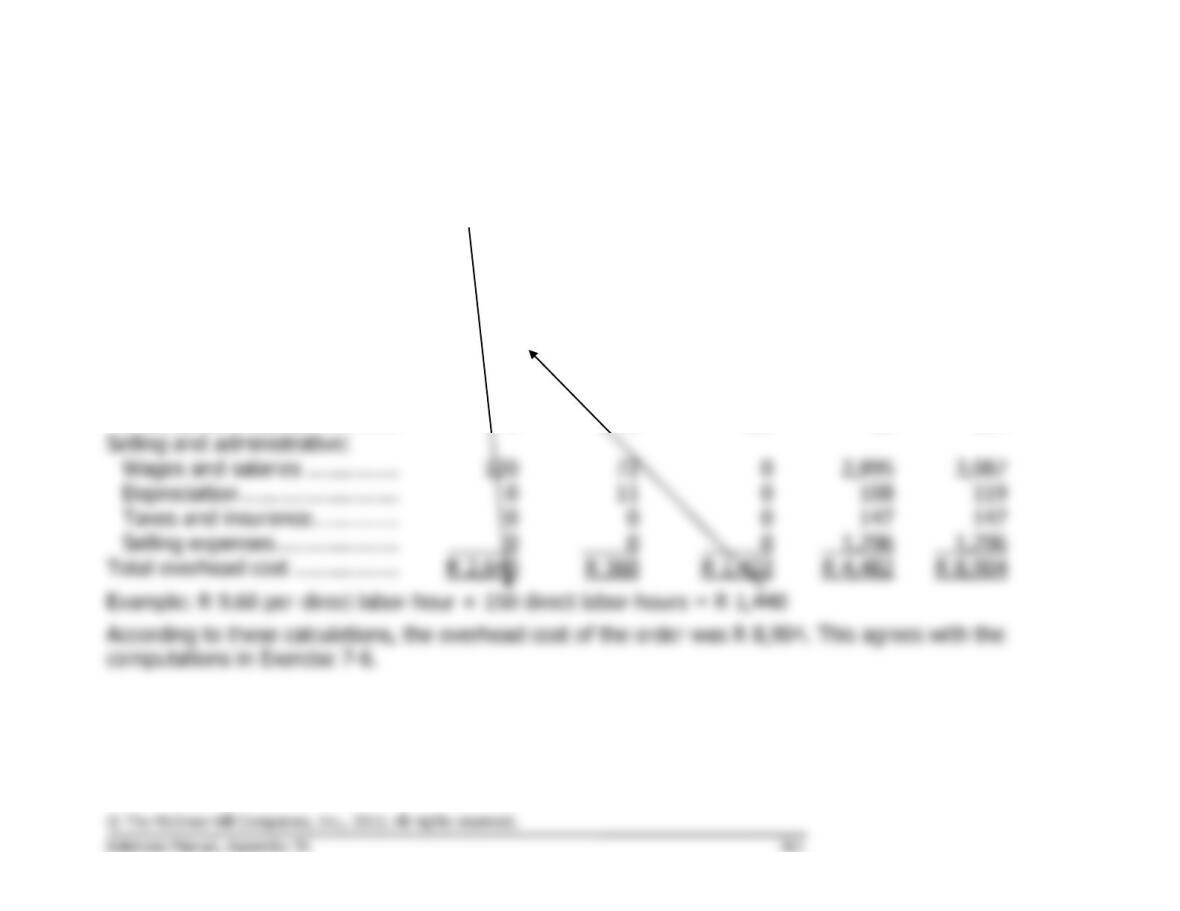
Exercise 7A-1 (20 minutes)
Sales (80 clubs × $48 per club) ……………………….
$3,840.00
Green costs:
Direct materials (80 clubs × $25.40 per club) ……
Green margin ………………………………………………
$21.50 per hour) ………………………………………
516.00
Indirect labor ……………………………………………..
90.00
Marketing expenses …………………………………….
540.20
1,146.20
Yellow margin …………………………..………………….
661.80
Red costs:
Factory equipment depreciation ……………………..
106.40
Factory administration ………………………………….
262.40
Selling and administrative wages and salaries ……
436.00
Selling and administrative depreciation …………….
30.00
834.80
Red margin …………………………………………………
$ (173.00)
Costs:
283.20
118.80
1,010.00
Customer margin ………………………………………….
$ (173.00)
Exercise 7A-2 (30 minutes)
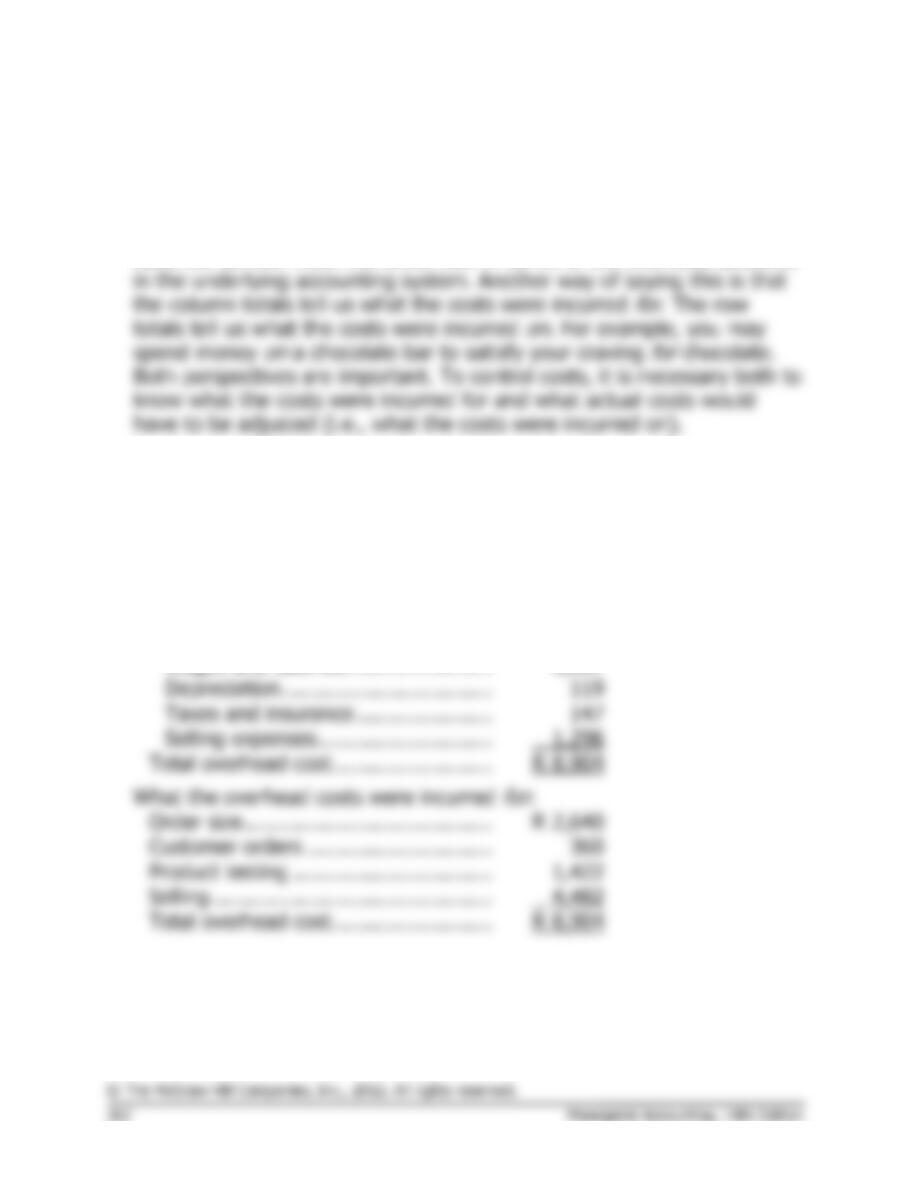
1.
Order Size
Customer
Orders
Product
Testing
Selling
Total
Total activity for the order ……..
150
1
18
3
direct labor-
hours
customer
order
product
testing
hours
sales calls
Manufacturing overhead:
Indirect labor ……………………
R 1,440
R 231
R 648
R 0
R 2,319
Factory depreciation …………..
1,050
0
324
0
1,374
Factory utilities ………………….
30
0
18
0
48
Factory administration ………..
0
46
432
36
514
Selling and administrative:
Wages and salaries ……………
120
0
2,895
3,087
Depreciation …………………….
0
0
108
Taxes and insurance …………..
0
0
0
147
Selling expenses ………………..
1,296
R 8,904
Exercise 7A-2 (continued)
2. The table prepared in part (1) above allows two different perspectives
on the overhead cost of the order. The column totals that appear in the
last row of the table tell us the cost of the order in terms of the
activities it required. The row totals that appear in the last column of the
table tell us how much the order cost in terms of the overhead accounts
The two different perspectives can be explicitly shown as follows:
What the overhead costs were spent
on
:
Manufacturing overhead:
Indirect labor …………………………..
R 2,319
Factory depreciation ………………….
1,374
Factory utilities …………………………
48
Factory administration ……………….
514
Selling and administrative:
Wages and salaries ……………………
3,087
Depreciation …………………………….
Taxes and insurance ………………….
Selling expenses ……………………….
Total overhead cost ……………………..
Order size ………………………………….
R 2,640
Customer orders …………………………
Product testing …………………………..
1,422
Selling ………………………………………
Total overhead cost ……………………..