Chapter 7/Consumers, Producers, and the Efficiency of Markets ❖ 133
quantity would lower total surplus because the value to the marginal buyer would be lower
than the cost to the marginal seller on those additional units.
Questions for Review
1. The price a buyer is willing to pay, consumer surplus, and the demand curve are all closely
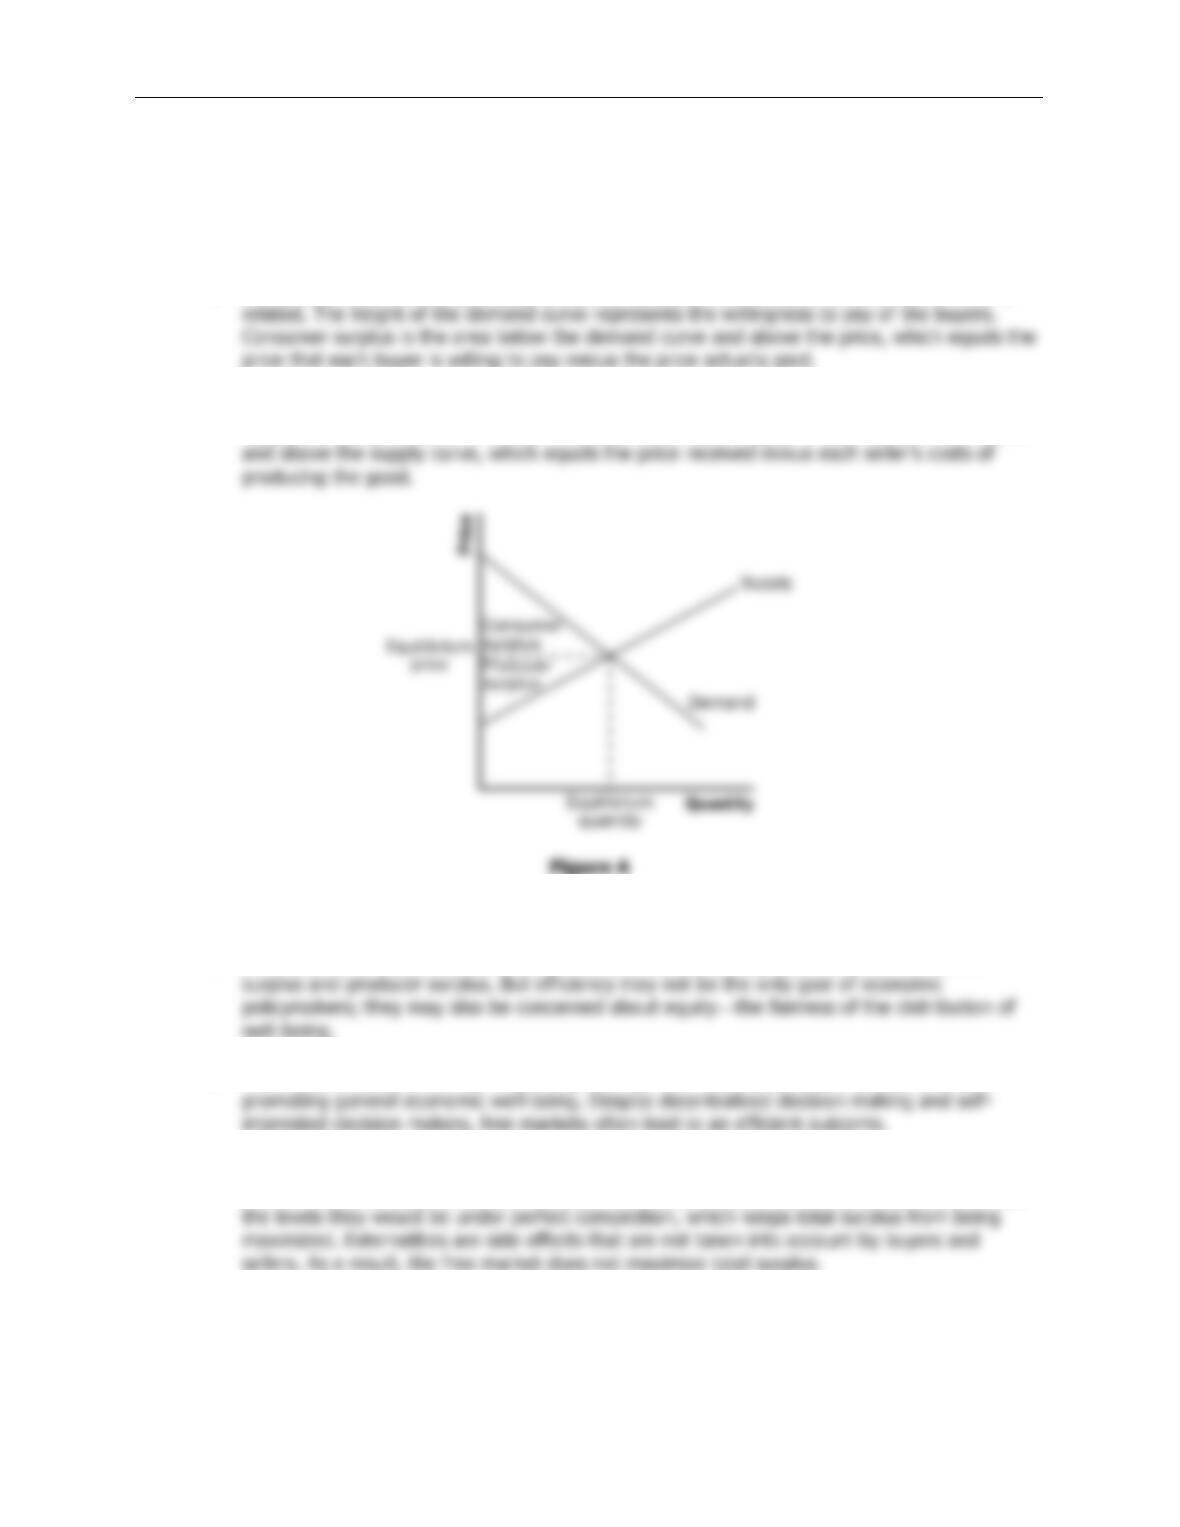
2. Sellers’ costs, producer surplus, and the supply curve are all closely related. The height of the
supply curve represents the costs of the sellers. Producer surplus is the area below the price
3. Figure 4 shows producer and consumer surplus in a supply-and-demand diagram.
4. An allocation of resources is efficient if it maximizes total surplus, the sum of consumer
5. The invisible hand of the marketplace guides the self-interest of buyers and sellers into
6. Two types of market failure are market power and externalities. Market power may cause
market outcomes to be inefficient because firms may cause price and quantity to differ from
134 ❖ Chapter 7/Consumers, Producers, and the Efficiency of Markets
Problems and Applications
1. a. Consumer surplus is equal to willingness to pay minus the price paid. Therefore,
Melissa’s willingness to pay must be $200 ($120 + $80).
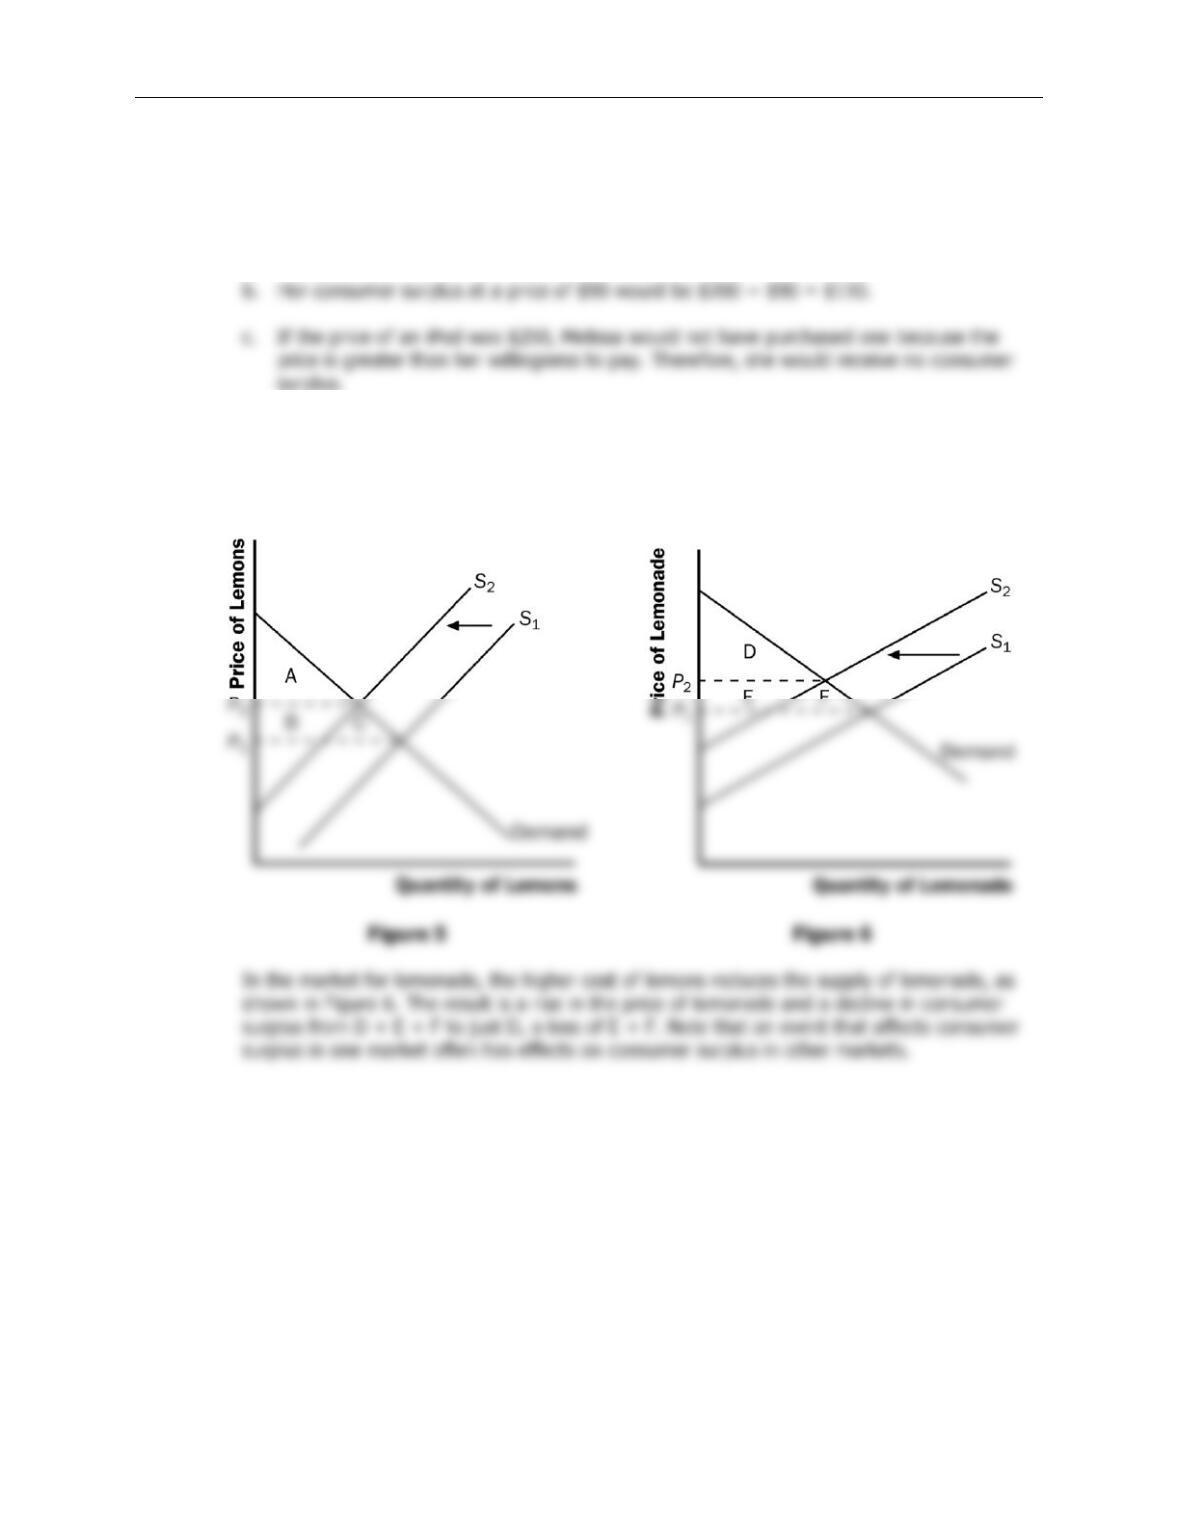
2. If an early freeze in California sours the lemon crop, the supply curve for lemons shifts to the
left, as shown in Figure 5. The result is a rise in the price of lemons and a decline in
consumer surplus from A + B + C to just A. So consumer surplus declines by the amount B +
C.
Chapter 7/Consumers, Producers, and the Efficiency of Markets ❖ 135
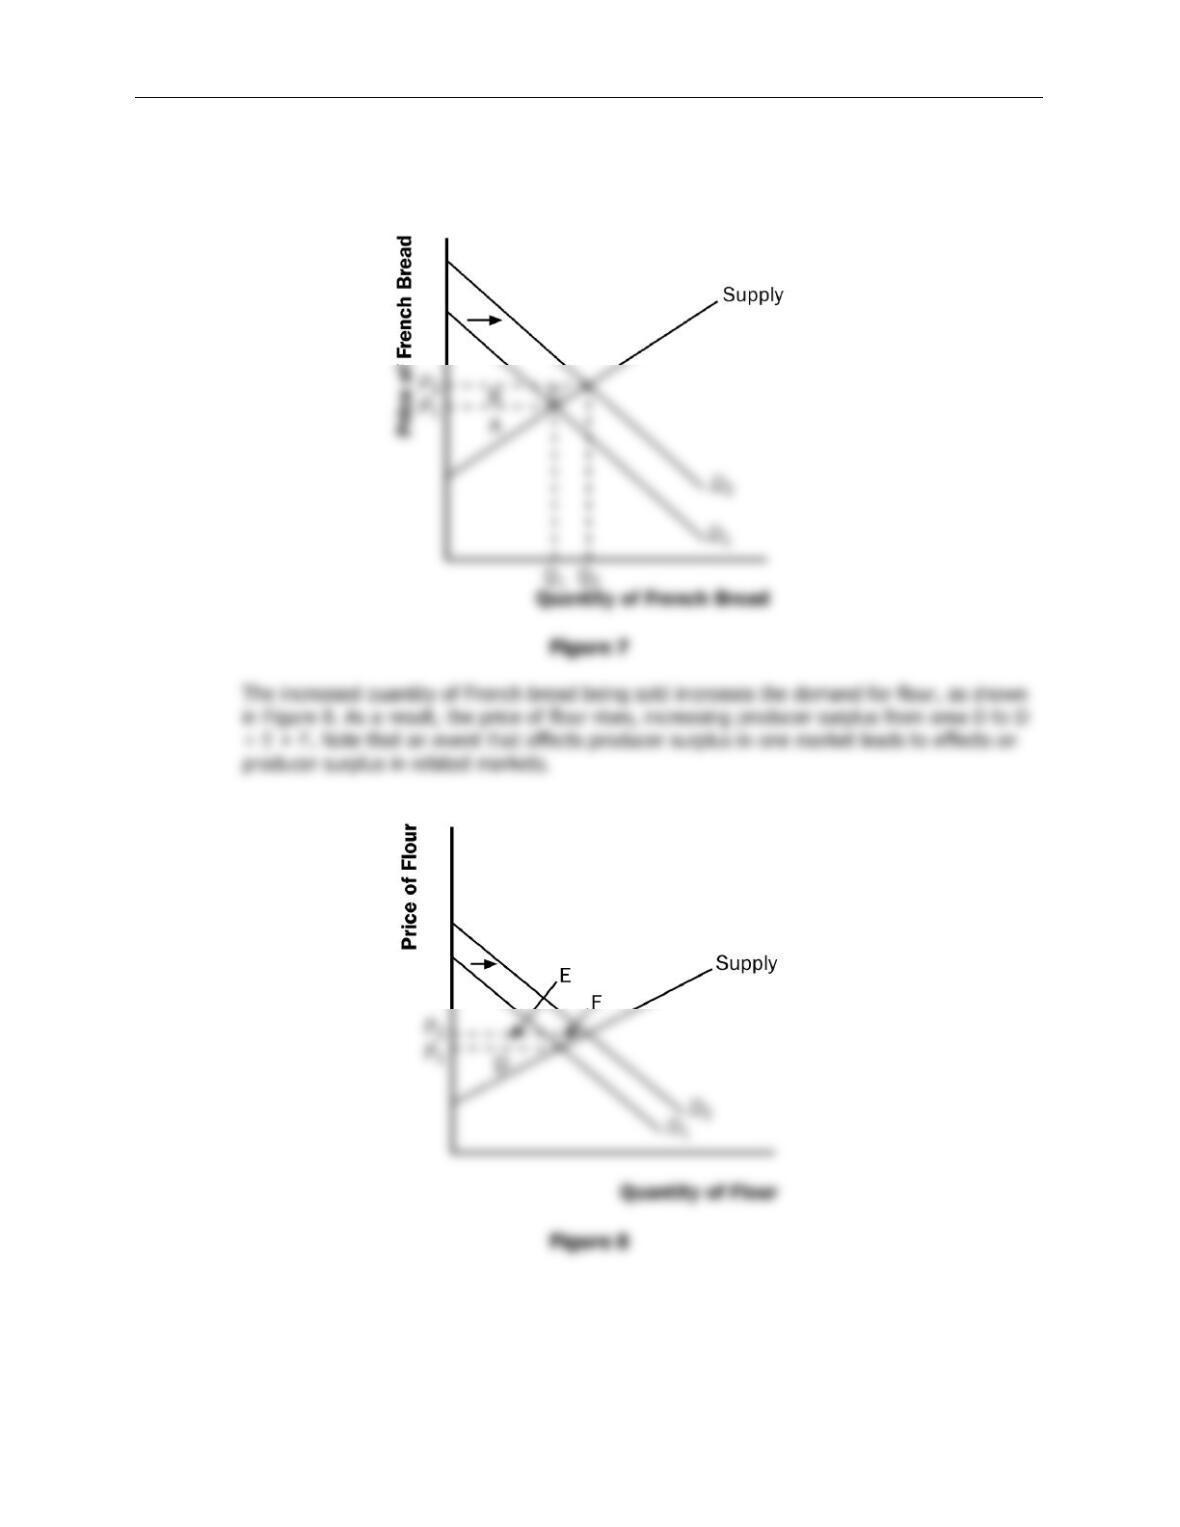
3. A rise in the demand for French bread leads to an increase in producer surplus in the market
for French bread, as shown in Figure 7. The shift of the demand curve leads to an increased
price, which increases producer surplus from area A to area A + B + C.
136 ❖ Chapter 7/Consumers, Producers, and the Efficiency of Markets
4. a. Bert’s demand schedule is:
Price
Quantity Demanded
More than $7
0
$5 to $7
1
$3 to $5
2
$1 to $3
3
$1 or less
4
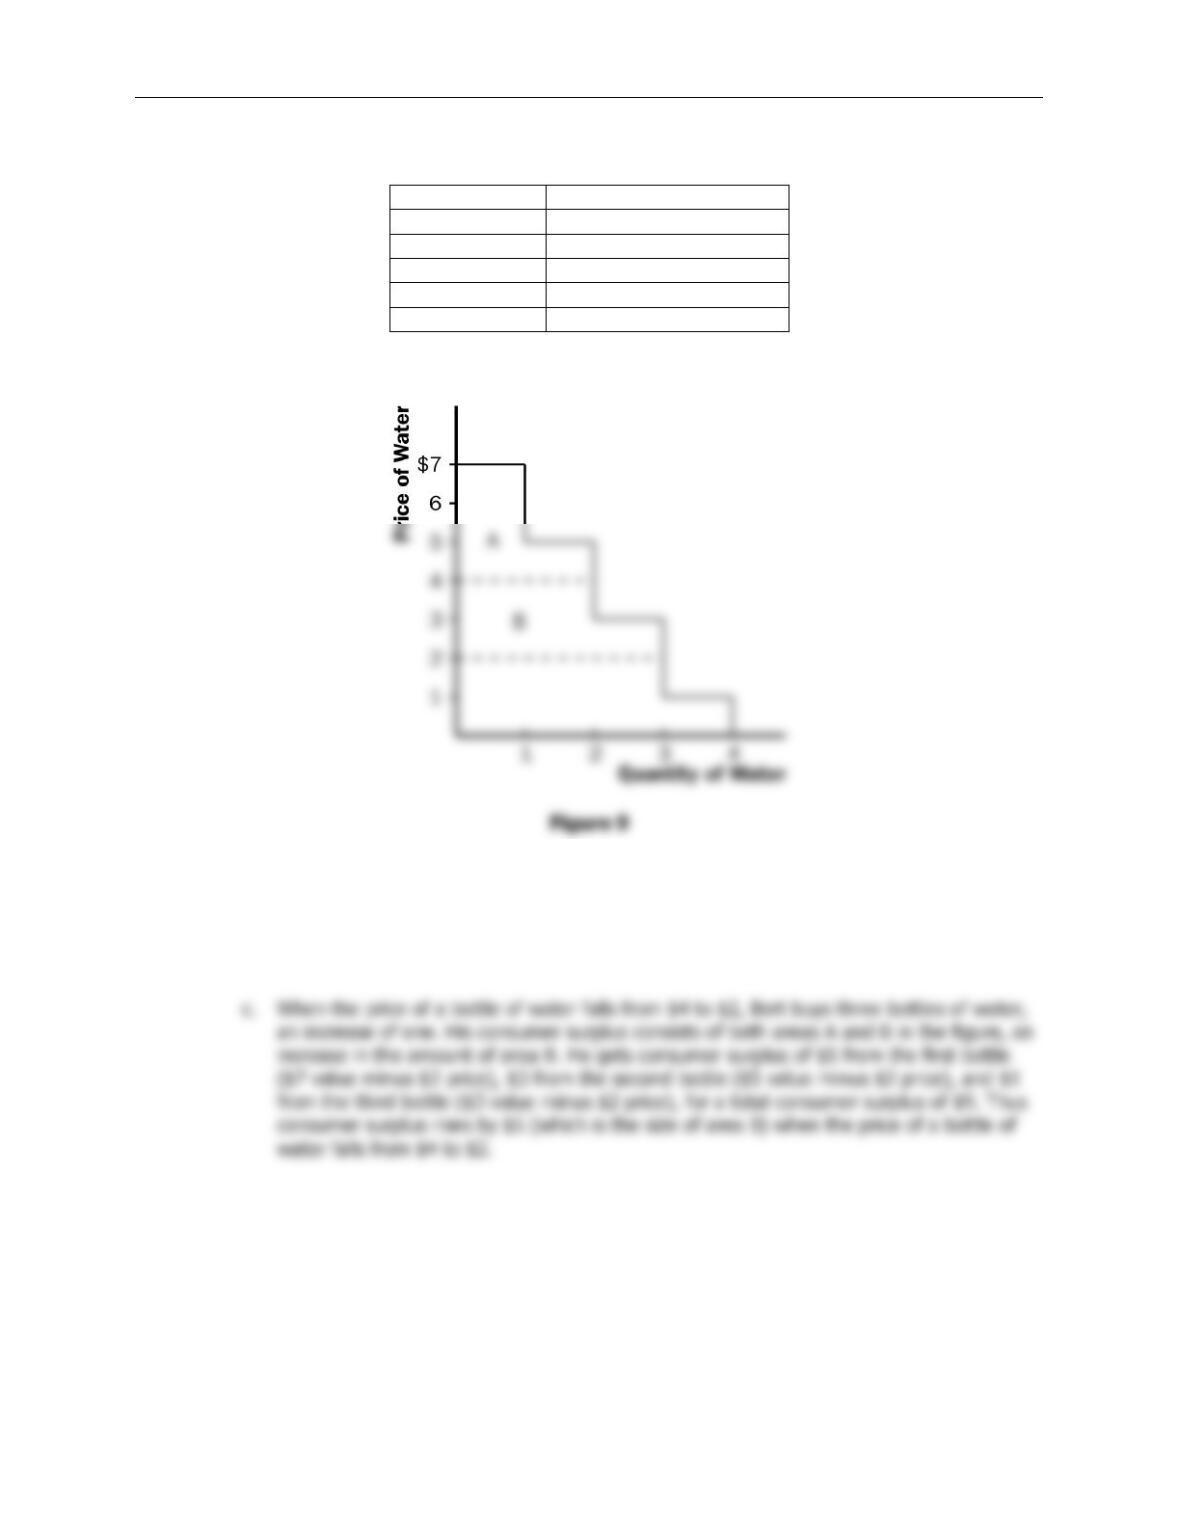
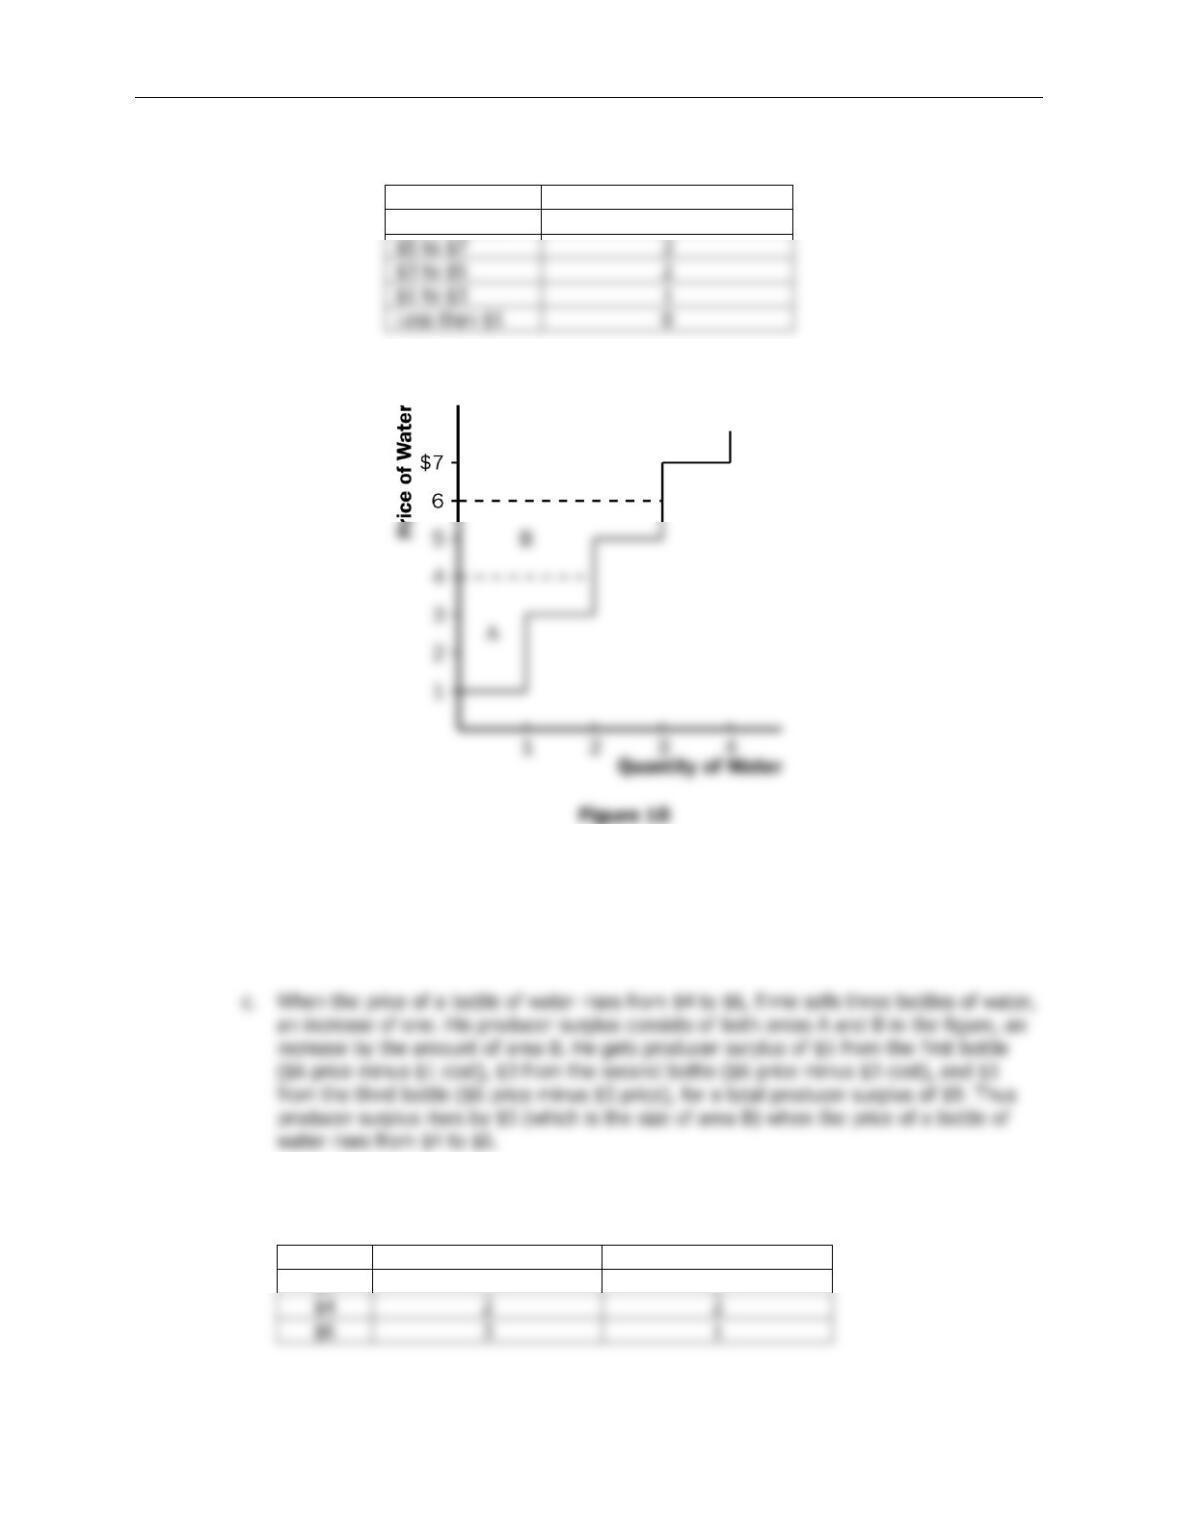
Bert’s demand curve is shown in Figure 9.
b. When the price of a bottle of water is $4, Bert buys two bottles of water. His consumer
surplus is shown as area A in the figure. He values his first bottle of water at $7, but
pays only $4 for it, so has consumer surplus of $3. He values his second bottle of water
at $5, but pays only $4 for it, so has consumer surplus of $1. Thus Bert’s total consumer
surplus is $3 + $1 = $4, which is the area of A in the figure.
Chapter 7/Consumers, Producers, and the Efficiency of Markets ❖ 137
5. a. Ernie’s supply schedule for water is:
Price
Quantity Supplied
More than $7
4
Ernie’s supply curve is shown in Figure 10.
b. When the price of a bottle of water is $4, Ernie sells two bottles of water. His producer
surplus is shown as area A in the figure. He receives $4 for his first bottle of water, but it
costs only $1 to produce, so Ernie has producer surplus of $3. He also receives $4 for his
second bottle of water, which costs $3 to produce, so he has producer surplus of $1.
Thus Ernie’s total producer surplus is $3 + $1 = $4, which is the area of A in the figure.
6. a. From Ernie’s supply schedule and Bert’s demand schedule, the quantity demanded and
supplied are:
Price
Quantity Supplied
Quantity Demanded
$2
1
3
$4
2
2
$5 to $7
3
$3 to $5
2
$1 to $3
1
Less than $1
0
138 ❖ Chapter 7/Consumers, Producers, and the Efficiency of Markets
Only a price of $4 brings supply and demand into equilibrium, with an equilibrium
quantity of two.
b. At a price of $4, consumer surplus is $4 and producer surplus is $4, as shown in
Problems 3 and 4 above. Total surplus is $4 + $4 = $8.
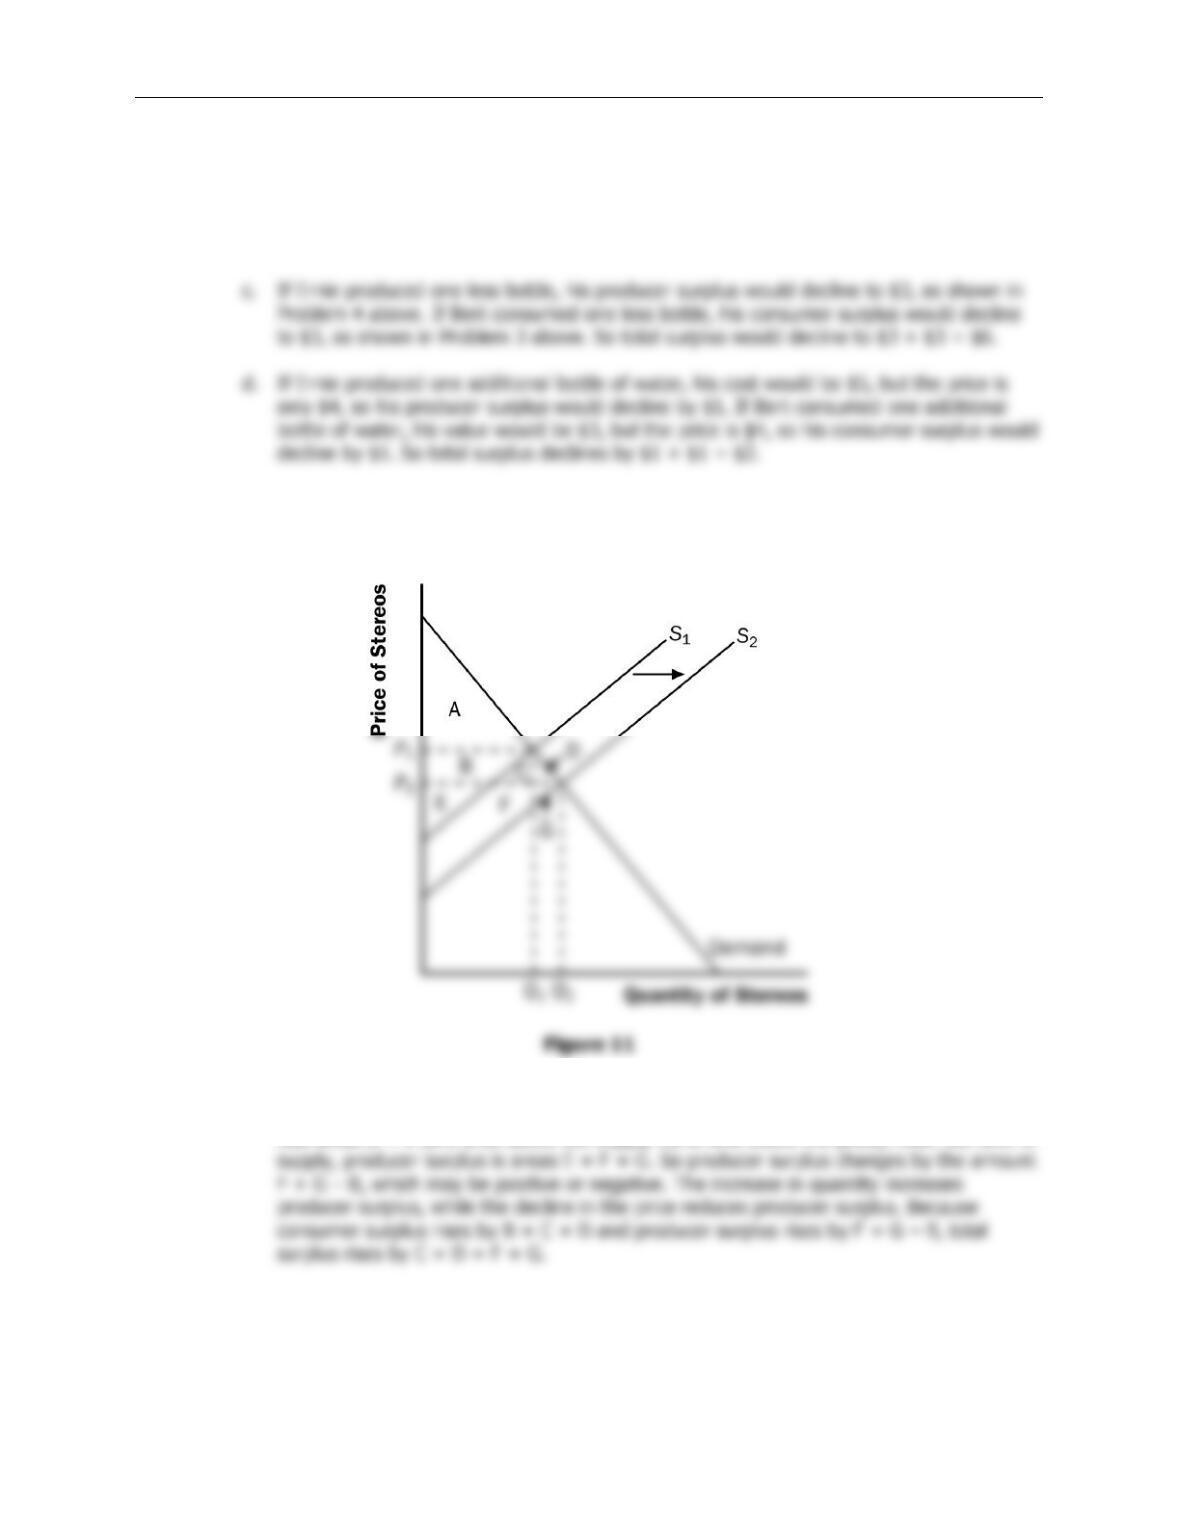
7. a. The effect of falling production costs in the market for stereos results in a shift to the
right in the supply curve, as shown in Figure 11. As a result, the equilibrium price of
stereos declines and the equilibrium quantity increases.
b. The decline in the price of stereos increases consumer surplus from area A to A + B + C
+ D, an increase in the amount B + C + D. Prior to the shift in supply, producer surplus
was areas B + E (the area above the supply curve and below the price). After the shift in
Chapter 7/Consumers, Producers, and the Efficiency of Markets ❖ 139
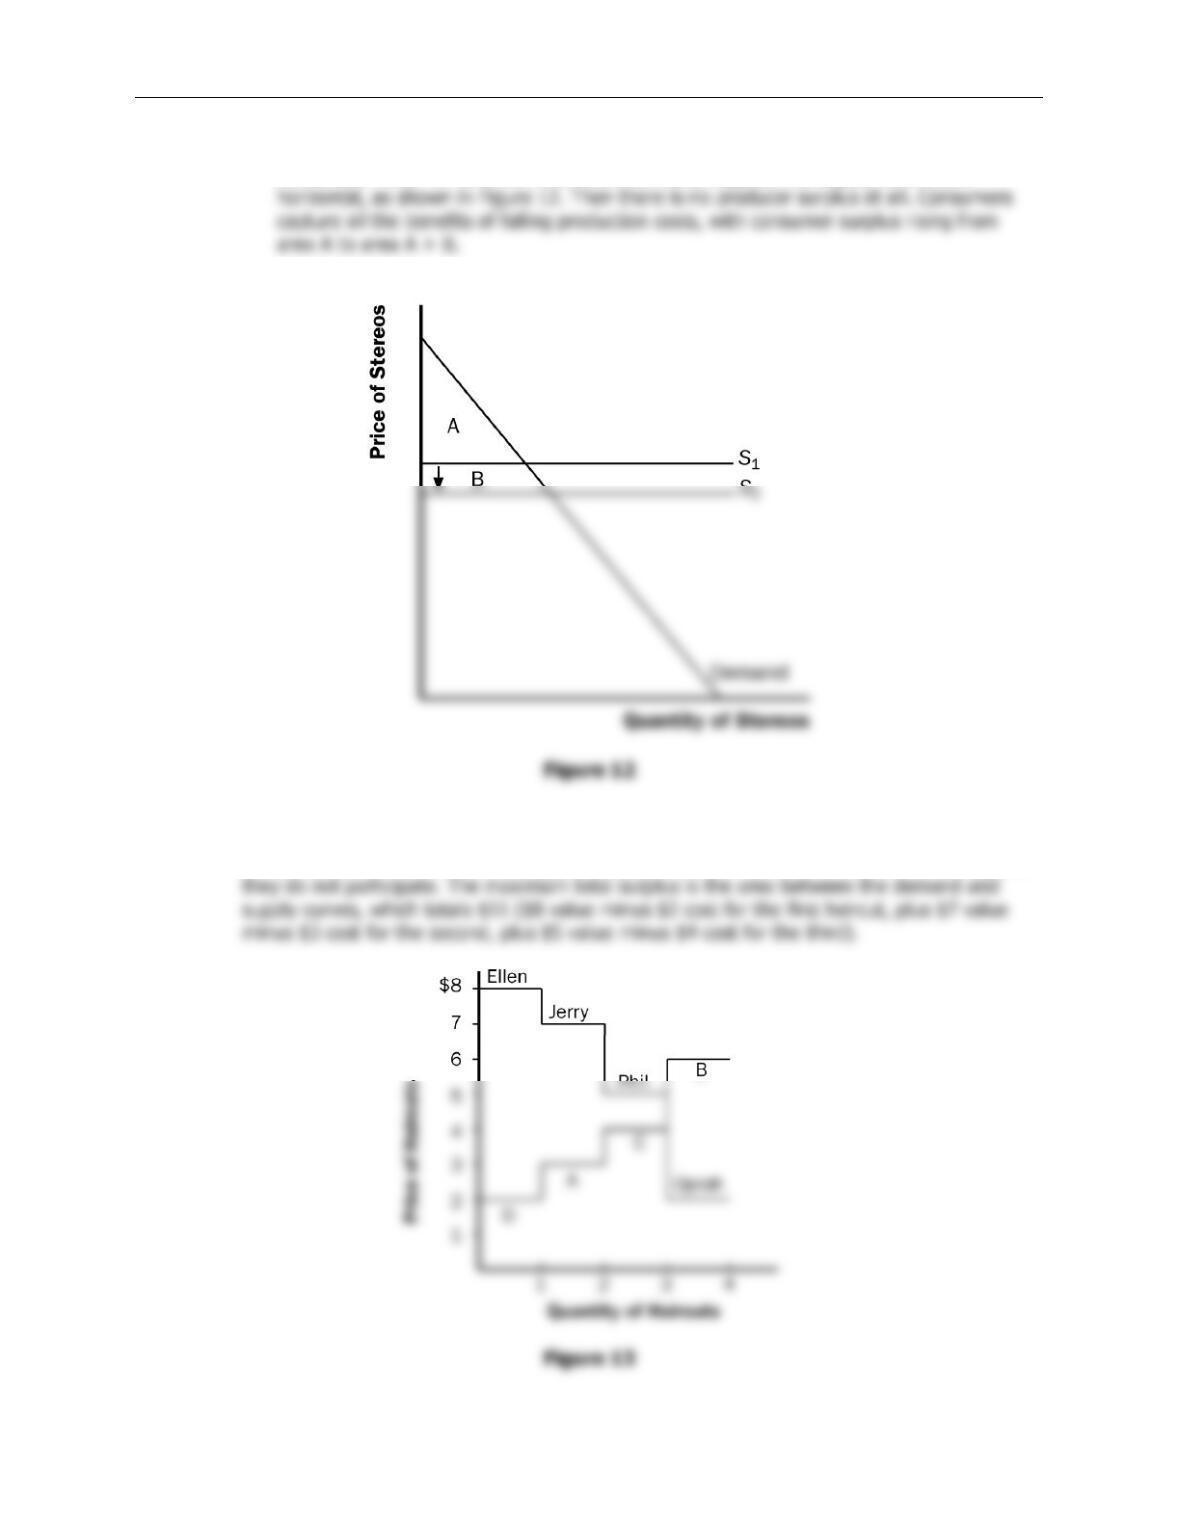
c. If the supply of stereos is very elastic, then the shift of the supply curve benefits
consumers most. To take the most dramatic case, suppose the supply curve were
8. Figure 13 shows supply and demand curves for haircuts. Supply equals demand at a quantity
of three haircuts and a price between $4 and $5. Firms A, C, and D should cut the hair of
Ellen, Jerry, and Phil. Oprah’s willingness to pay is too low and firm B’s costs are too high, so
140 ❖ Chapter 7/Consumers, Producers, and the Efficiency of Markets
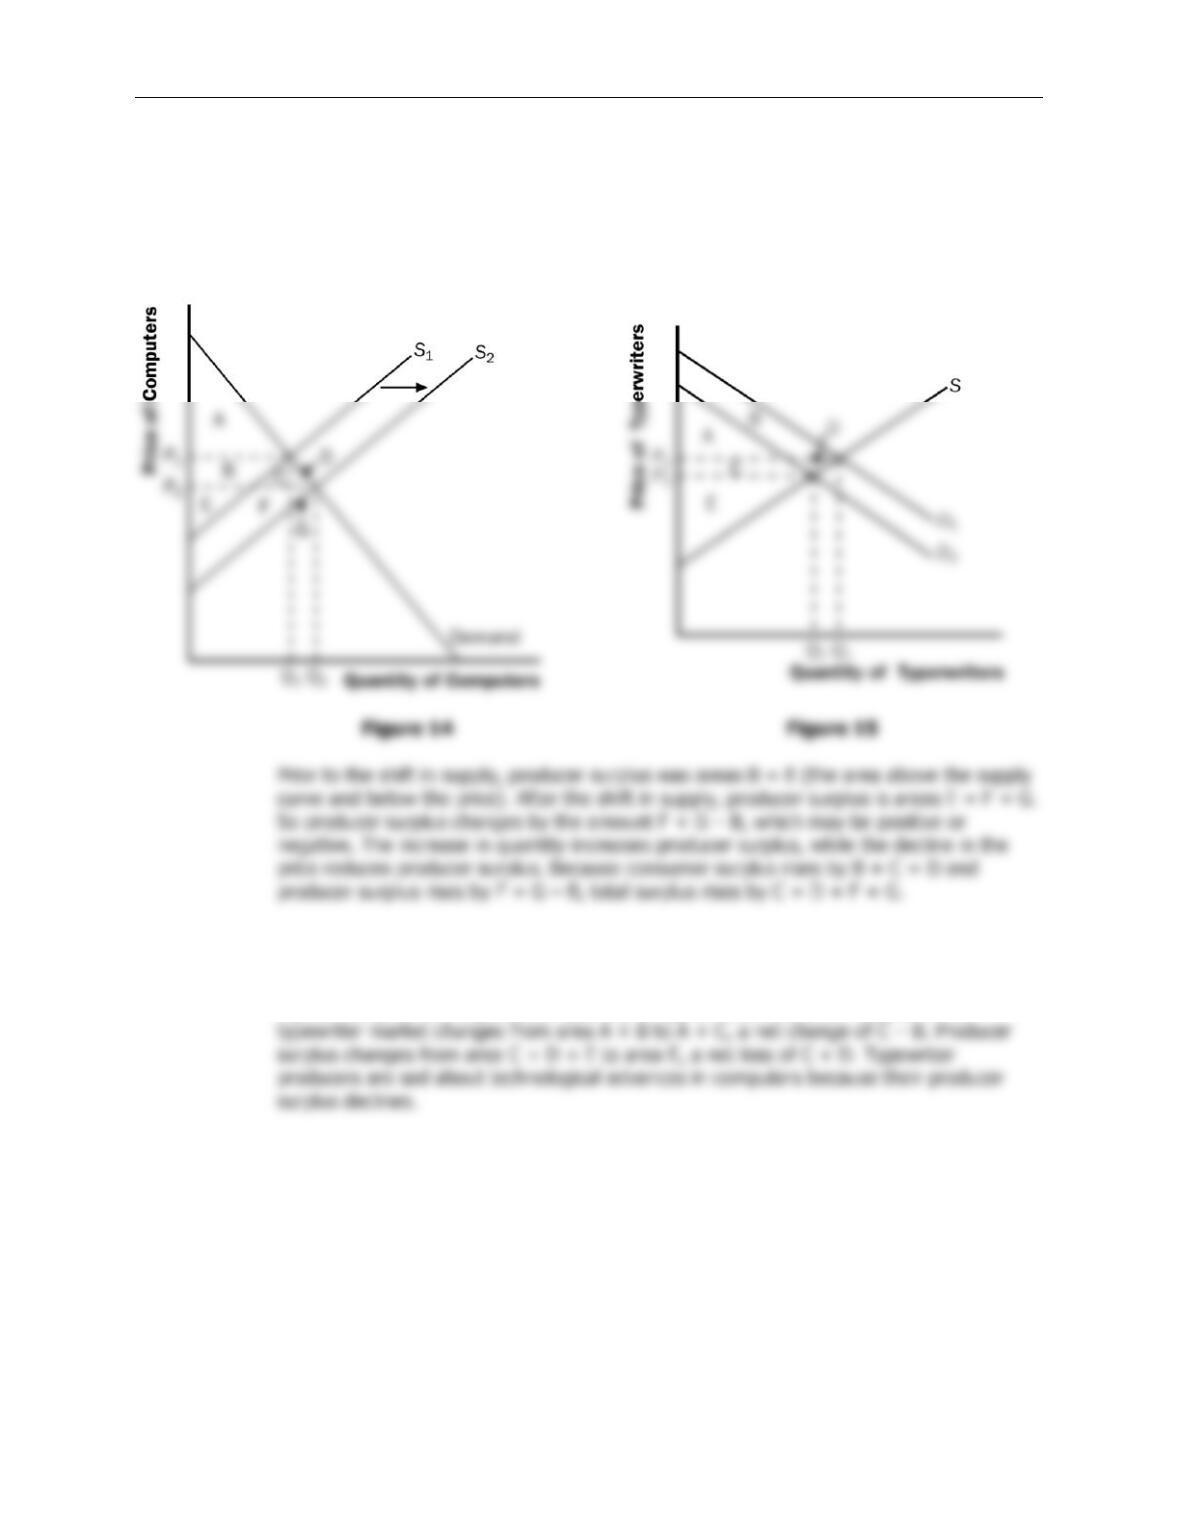
9. a. The effect of falling production costs in the market for computers results in a shift to the
right in the supply curve, as shown in Figure 14. As a result, the equilibrium price of
computers declines and the equilibrium quantity increases. The decline in the price of
computers increases consumer surplus from area A to A + B + C + D, an increase in the
amount B + C + D.
b. Because typewriters are substitutes for computers, the decline in the price of computers
means that people substitute computers for typewriters, shifting the demand for
typewriters to the left, as shown in Figure 15. The result is a decline in both the
equilibrium price and equilibrium quantity of typewriters. Consumer surplus in the
Chapter 7/Consumers, Producers, and the Efficiency of Markets ❖ 141
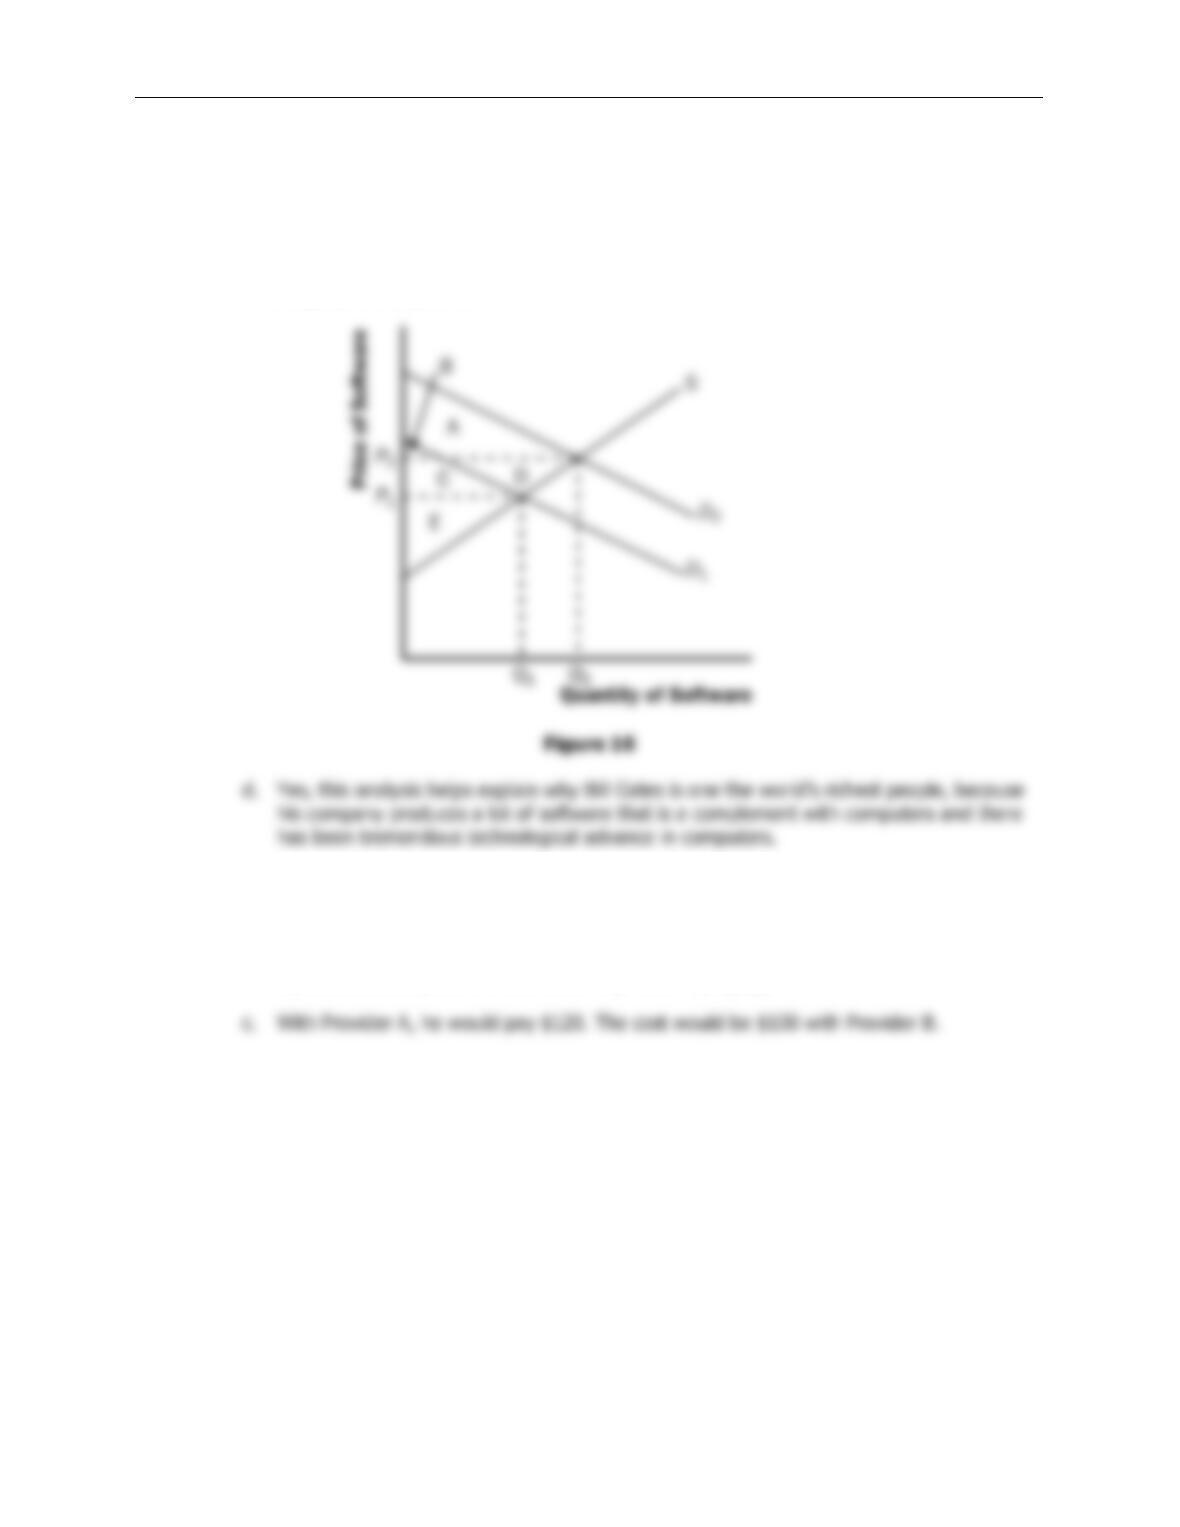
c. Because software and computers are complements, the decline in the price and increase
in the quantity of computers means that the demand for software increases, shifting the
demand for software to the right, as shown in Figure 16. The result is an increase in both
the price and quantity of software. Consumer surplus in the software market changes
from B + C to A + B, a net change of A – C. Producer surplus changes from E to C + D +
E, an increase of C + D, so software producers should be happy about the technological
progress in computers.
10. a. With Provider A, the cost of an extra minute is $0. With Provider B, the cost of an extra
minute is $1.
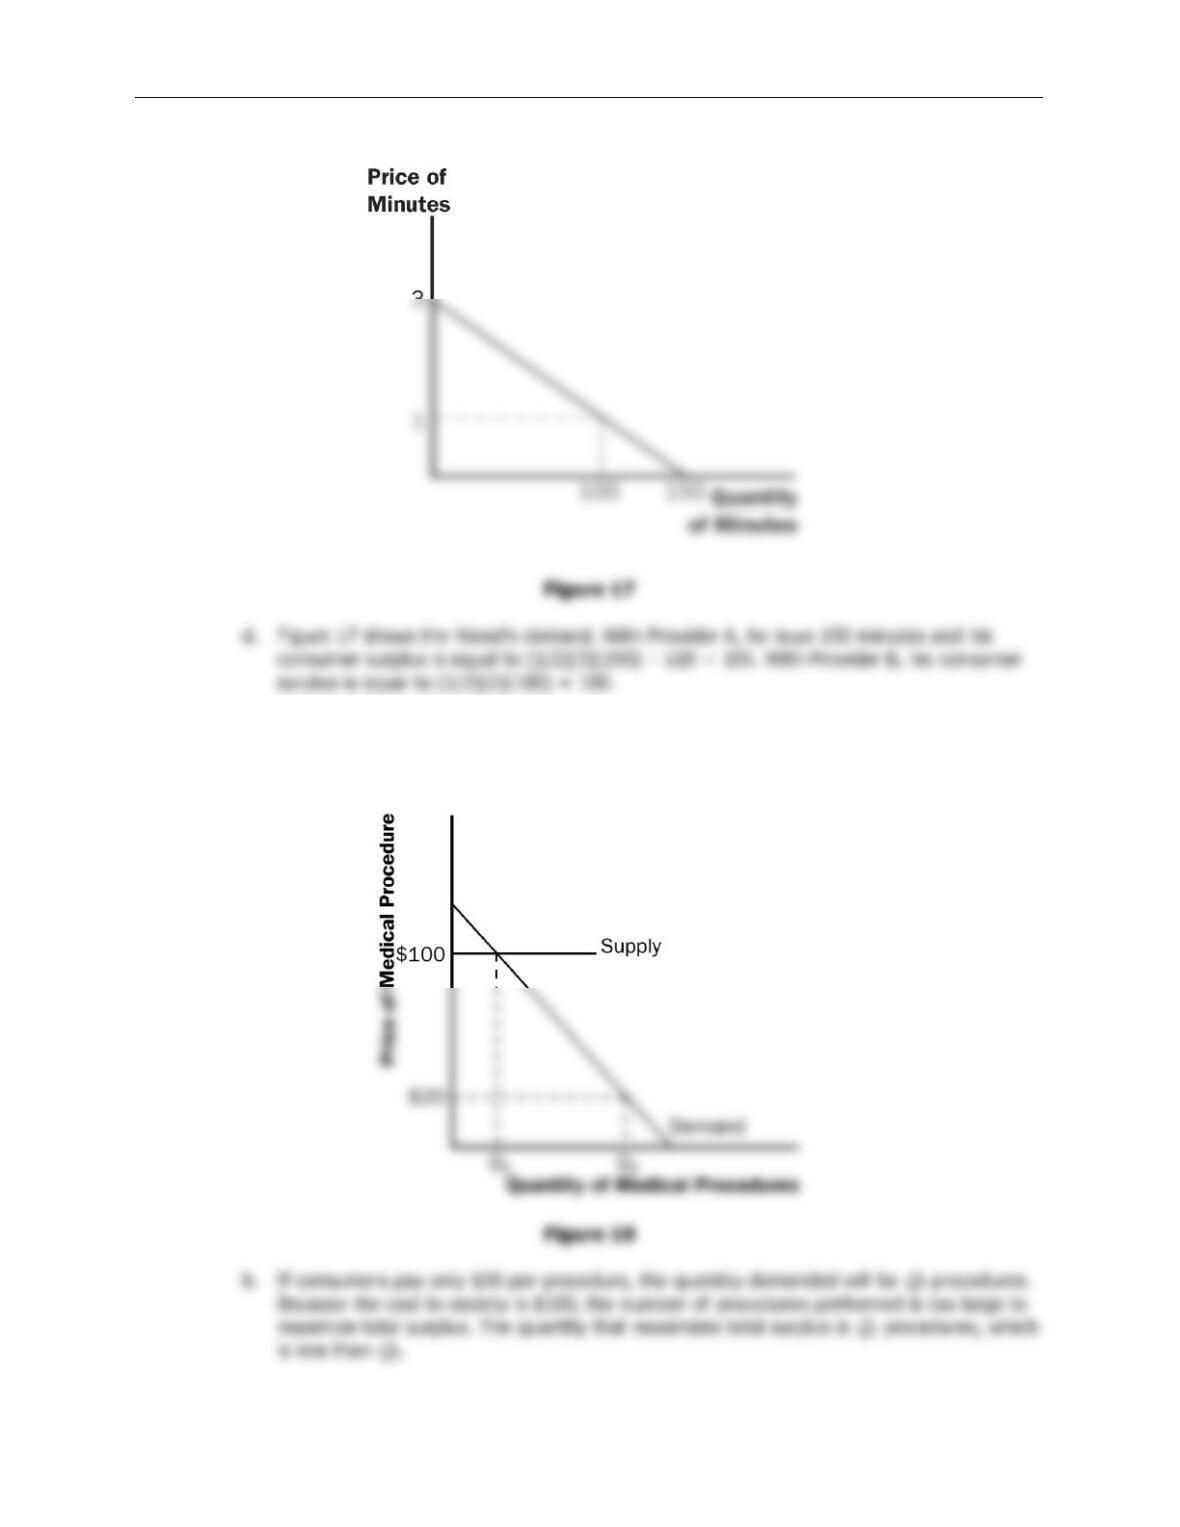
b. With Provider A, my friend will purchase 150 minutes [= 150 – (50)(0)]. With Provider B,
my friend would purchase 100 minutes [= 150 – (50)(1)].
142 ❖ Chapter 7/Consumers, Producers, and the Efficiency of Markets
e. I would recommend Provider A because he receives greater consumer surplus.
11. a. Figure 18 illustrates the demand for medical care. If each procedure has a price of $100,
quantity demanded will be
Q
1 procedures.
Chapter 7/Consumers, Producers, and the Efficiency of Markets ❖ 143
c. The use of medical care is excessive in the sense that consumers get procedures whose
value is less than the cost of producing them. As a result, the economy’s total surplus is
reduced.