121
rkets
WHAT’S NEW IN THE SEVENTH EDITION:
There is a new
In the News
feature on “The Invisible Hand Can Park Your Car.”
LEARNING OBJECTIVES:
By the end of this chapter, students should understand:
➢ the link between buyers’ willingness to pay for a good and the demand curve.
➢ how to define and measure consumer surplus.
➢ the link between sellers’ costs of producing a good and the supply curve.
➢ how to define and measure producer surplus.
➢ that the equilibrium of supply and demand maximizes total surplus in a market.
CONTEXT AND PURPOSE:
Chapter 7 is the first chapter in a three-chapter sequence on welfare economics and market efficiency.
Chapter 7 employs the supply and demand model to develop consumer surplus and producer surplus as a
measure of welfare and market efficiency. These concepts are then utilized in Chapters 8 and 9 to
determine the winners and losers from taxation and restrictions on international trade.
The purpose of Chapter 7 is to develop
welfare economics
—the study of how the allocation of
resources affects economic well-being. Chapters 4 through 6 employed supply and demand in a positive
framework, which focused on the question, “What is the equilibrium price and quantity in a market?” This
7
CONSUMERS, PRODUCERS, AND
THE EFFICIENCY OF MARKETS
122 ❖ Chapter 7/Consumers, Producers, and the Efficiency of Markets
KEY POINTS:
• Consumer surplus equals buyers’ willingness to pay for a good minus the amount they actually pay,
and it measures the benefit buyers get from participating in a market. Consumer surplus can be
computed by finding the area below the demand curve and above the price.
• Producer surplus equals the amount sellers receive for their goods minus their costs of production,
and it measures the benefit sellers get from participating in a market. Producer surplus can be
computed by finding the area below the price and above the supply curve.
• An allocation of resources that maximizes the sum of consumer and producer surplus is said to be
efficient. Policymakers are often concerned with the efficiency, as well as the equality, of economic
outcomes.
CHAPTER OUTLINE:
I. Definition of welfare economics: the study of how the allocation of resources affects
economic well-being.
II. Consumer Surplus
A. Willingness to Pay
Table 1
Students often are confused by the use of the word “welfare.” Remind them that we
are talking about social well-being and not public assistance.
Students will understand consumer surplus if you take the time to work through the
Elvis Presley example. If you start with this simple example, students will have no
trouble understanding how to find consumer surplus on a graph.
Chapter 7/Consumers, Producers, and the Efficiency of Markets ❖ 123
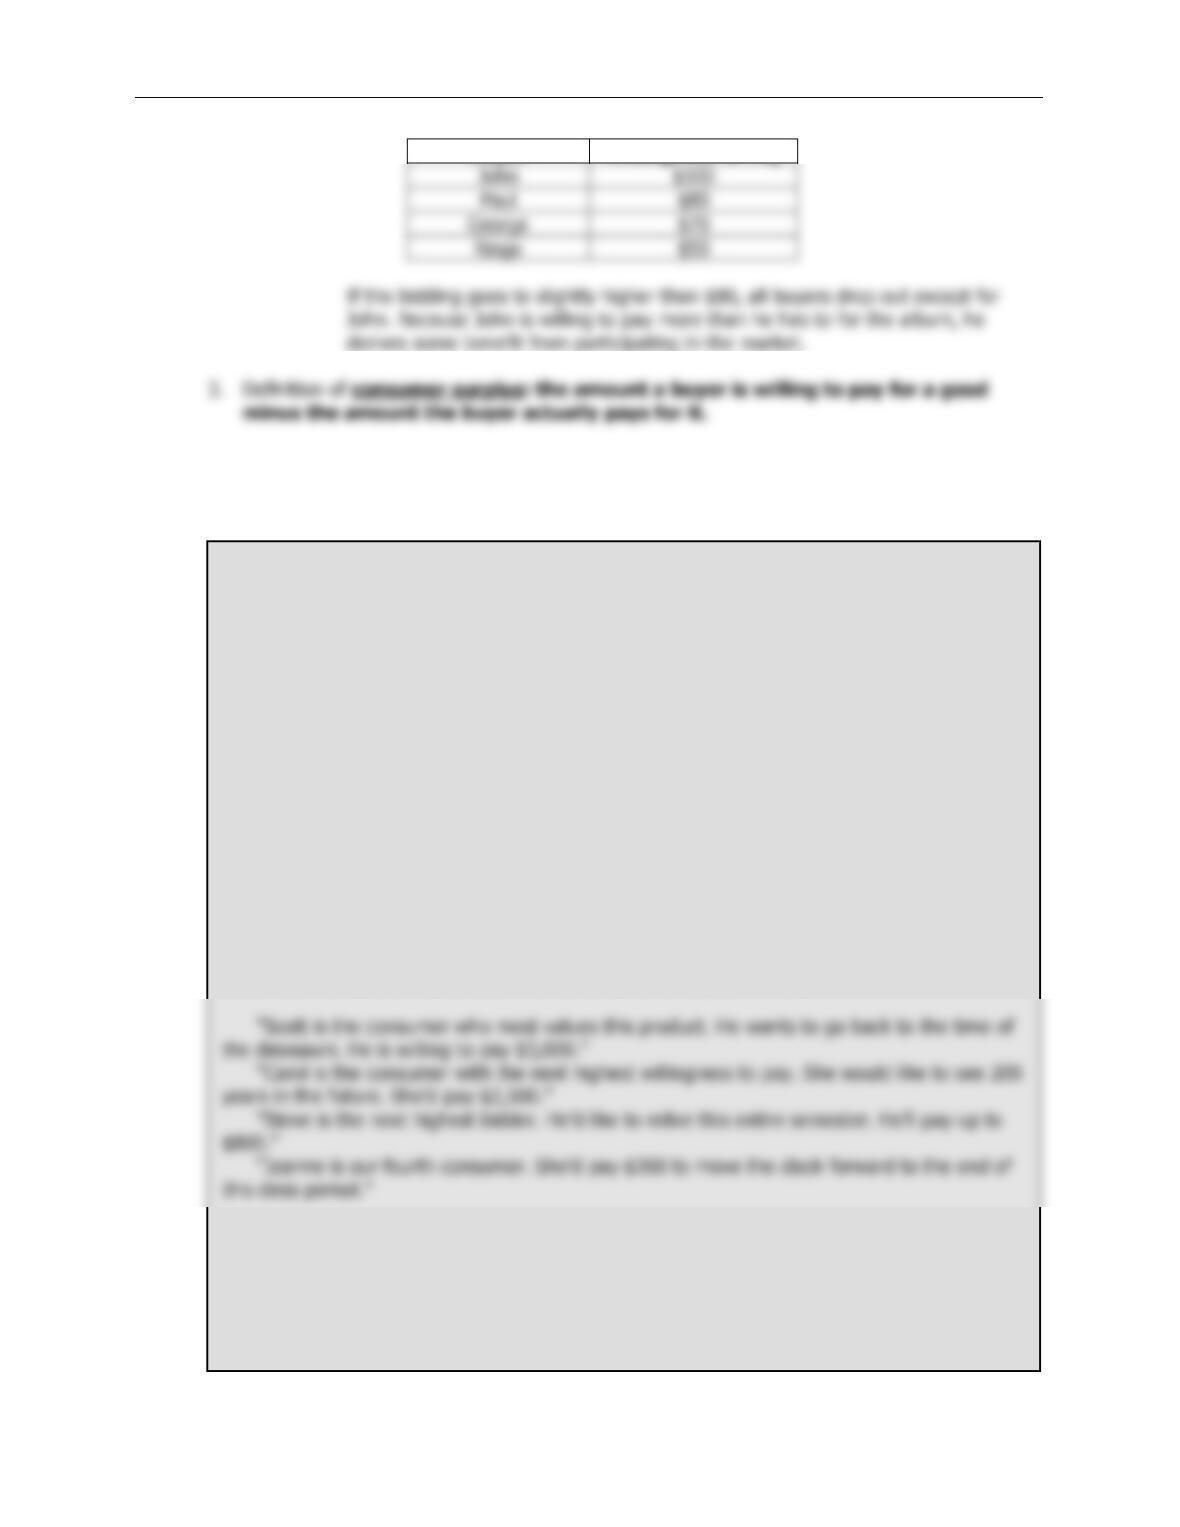
Buyer
Willingness to Pay
4. Note that if you had more than one copy of the album, the price in the auction would end up
being lower (a little over $70 in the case of two albums) and both John and Paul would gain
consumer surplus.
Activity 1—Value of a Time Machine
Type: In-class demonstration
Topics: Consumer surplus
Materials needed: None
Time: 10 minutes
Class limitations: Works in any size class
Purpose
Consumer surplus can be a hard concept for students because it is based on avoided expense
rather than on money that is actually exchanged. This example puts a specific dollar value on
consumer surplus.
Instructions
Tell the class, “A new technology has been developed that allows individuals to travel
backward or forward in time. We want to identify the value this time machine provides to
consumers. Let’s assume the four consumers who most desire this product are in this class.”
Choose four student names and use them in the following example:
On the board write:
Scott $3,000
Carol $2,500
Steve $800
Jeanne $200
124 ❖ Chapter 7/Consumers, Producers, and the Efficiency of Markets
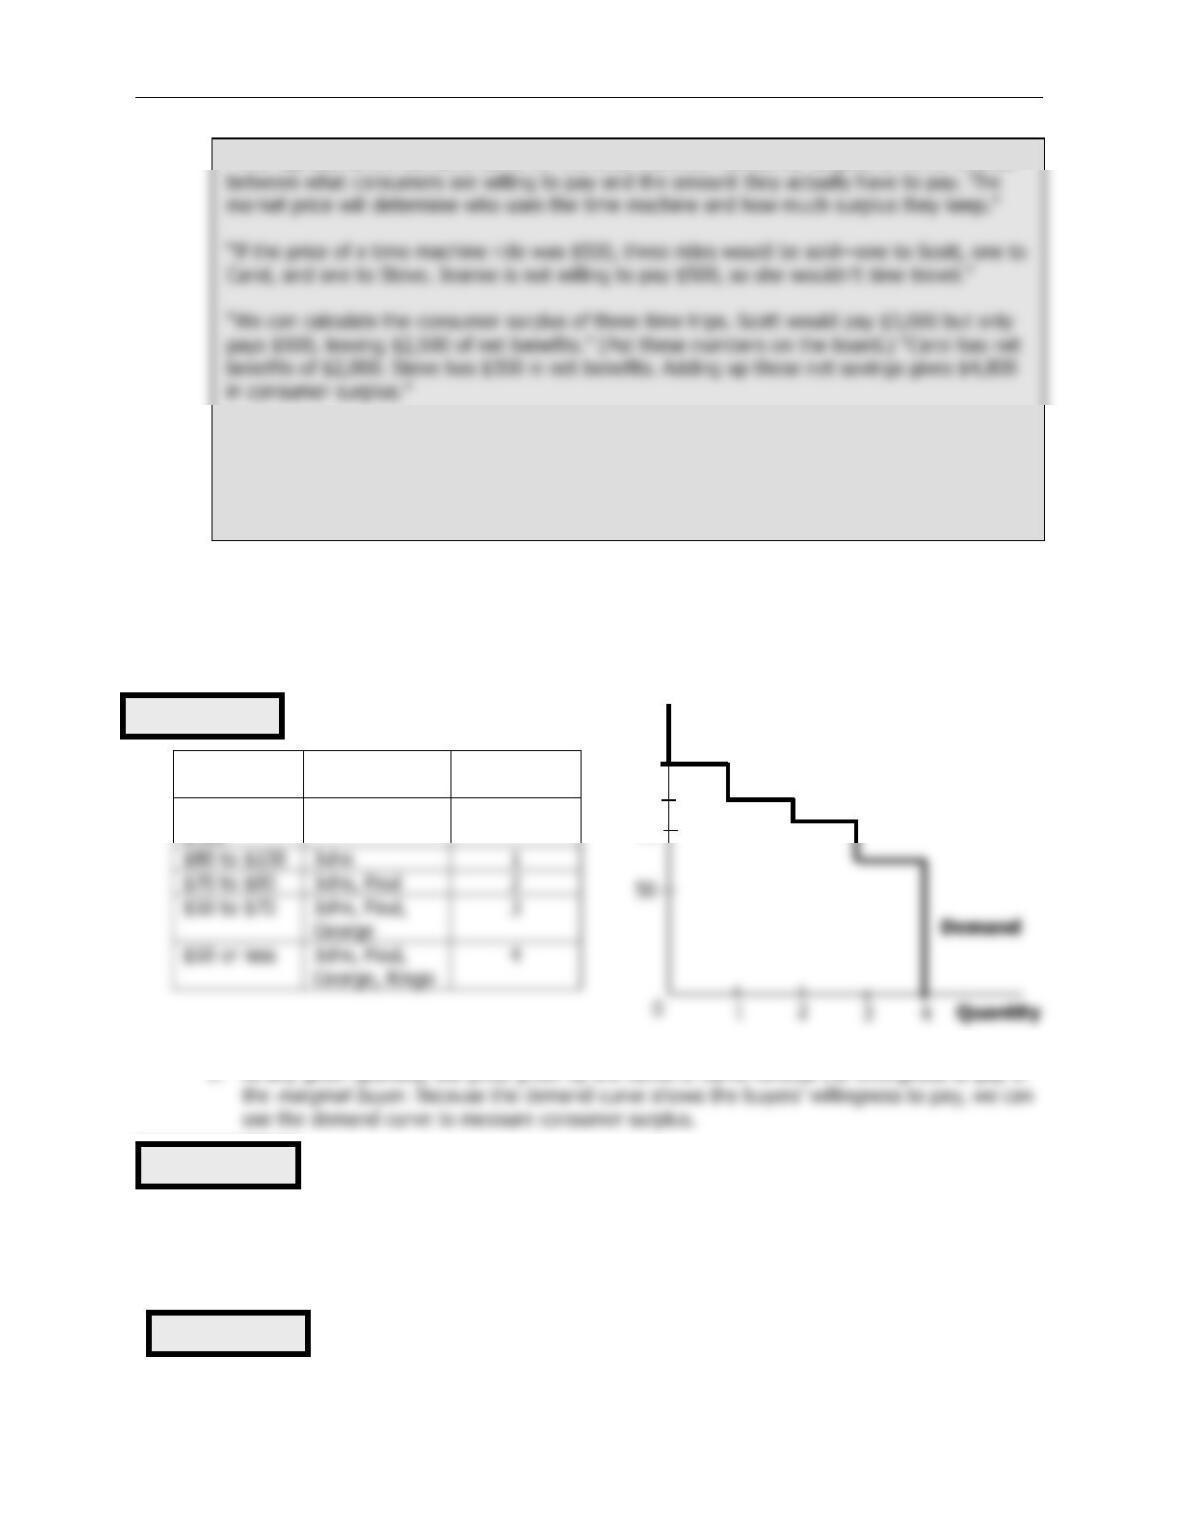
B. Using the Demand Curve to Measure Consumer Surplus
1. We can use the information on willingness to pay to derive a demand curve for the rare Elvis
Presley album.
Price
Buyers
Quantity
Demanded
More than
$100
None
0
2. At any given quantity, the price given by the demand curve reflects the willingness to pay of
3. Consumer surplus can be measured as the area below the demand curve and above the
price.
C. How a Lower Price Raises Consumer Surplus
Figure 1
Figure 2
Figure 3
“This represents the demand curve for the time machine. Consumer surplus is the difference
Points for Discussion
The consumer surplus depends on a good’s selling price and the number of consumers who
are willing to purchase the good at that price. The lower the price, the greater the consumer
surplus.
80
Price of
Album
100
70
$50 to $70
John, Paul,
George
3
Quantity
50
Chapter 7/Consumers, Producers, and the Efficiency of Markets ❖ 125
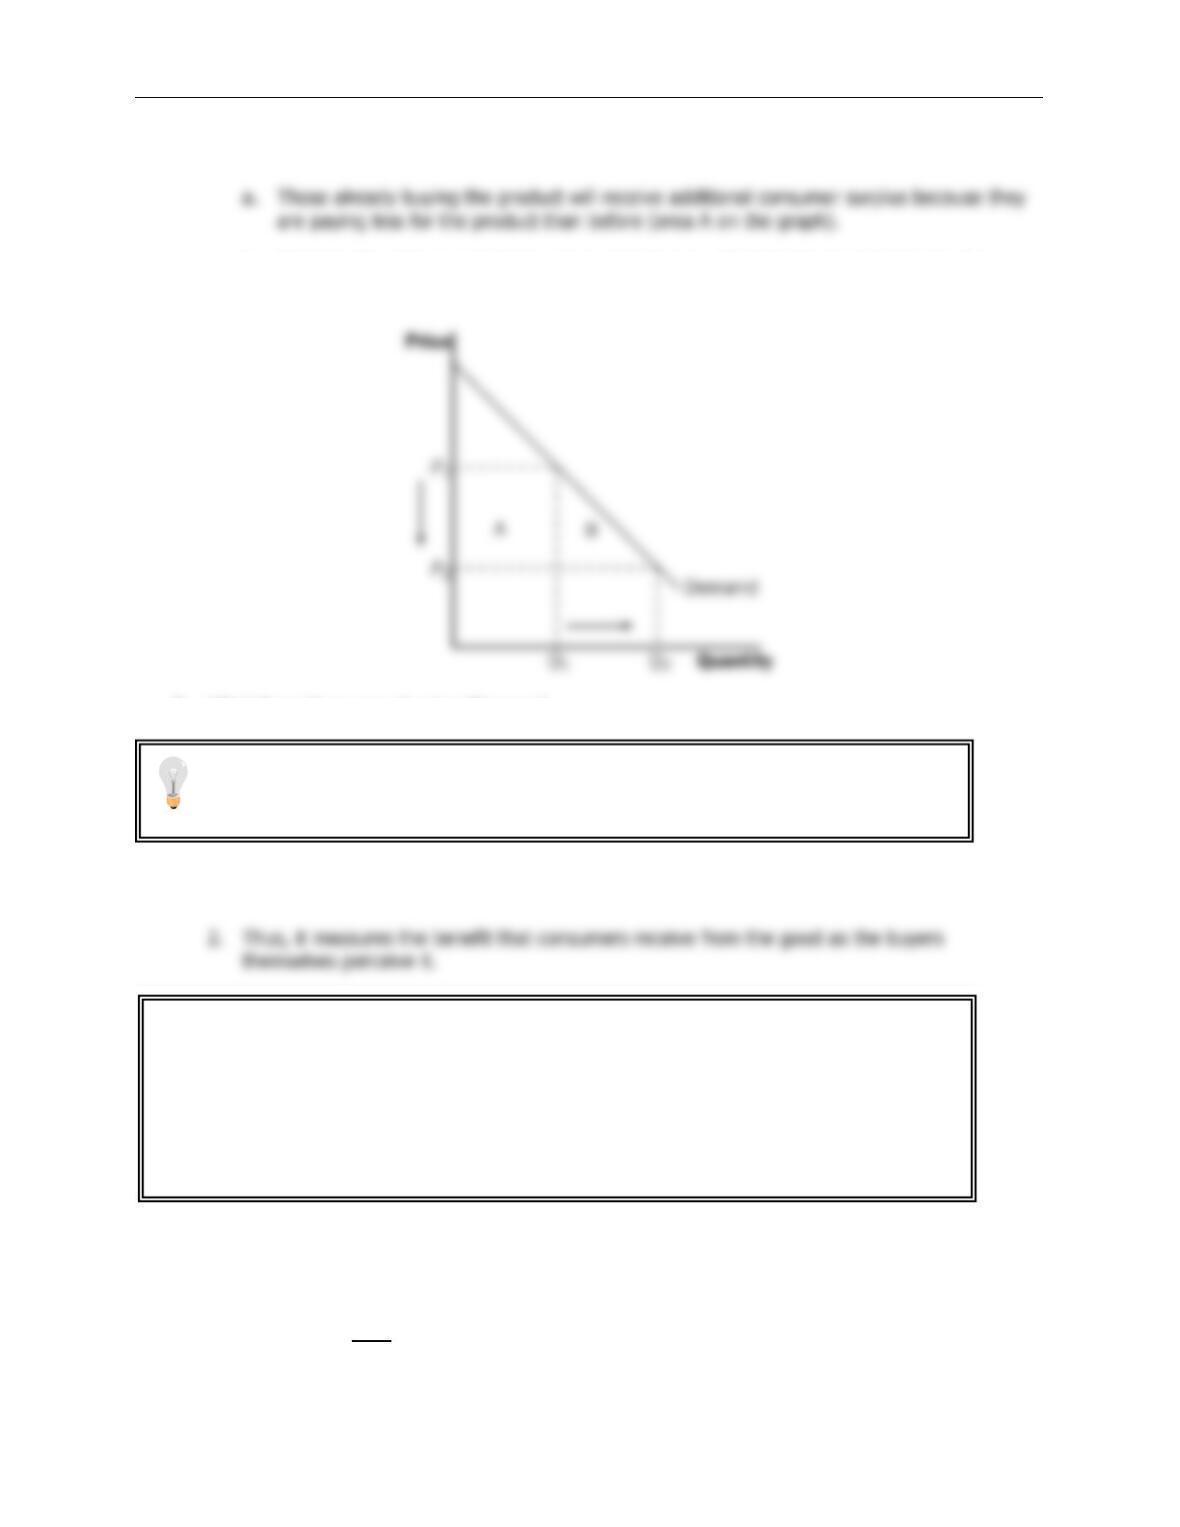
1. As price falls, consumer surplus increases for two reasons.
b. Because the price is now lower, some new buyers will enter the market and receive
consumer surplus on these additional units of output purchased (area B on the graph).
D. What Does Consumer Surplus Measure?
1. Remember that consumer surplus is the difference between the amount that buyers are
willing to pay for a good and the price that they actually pay.
III. Producer Surplus
A. Cost and the Willingness to Sell
1. Definition of cost: the value of everything a seller must give up to produce a good.
ALTERNATIVE CLASSROOM EXAMPLE:
Review the material on price ceilings from Chapter 6. Redraw the market for two-bedroom
apartments in your town. Draw in a price ceiling below the equilibrium price.
Then go through:
▪ consumer surplus before the price ceiling is put into place.
▪ consumer surplus after the price ceiling is put into place.
It is important to stress that consumer surplus is measured in monetary terms.
Consumer surplus gives us a way to place a monetary cost on inefficient market
outcomes (due to government involvement or market failure).
126 ❖ Chapter 7/Consumers, Producers, and the Efficiency of Markets
2. Example: You want to hire someone to paint your house. You accept bids for the work from
four sellers. Each painter is willing to work if the price you will pay exceeds her opportunity
cost. (Note that this opportunity cost thus represents willingness to sell.) The costs are:
Seller
Cost
Mary
$900
Frida
$800
Georgia
$600
Grandma
$500
3. Bidding will stop when the price gets to be slightly below $600. All sellers will drop out except
for Grandma. Because Grandma receives more than she would require to paint the house,
she derives some benefit from producing in the market.
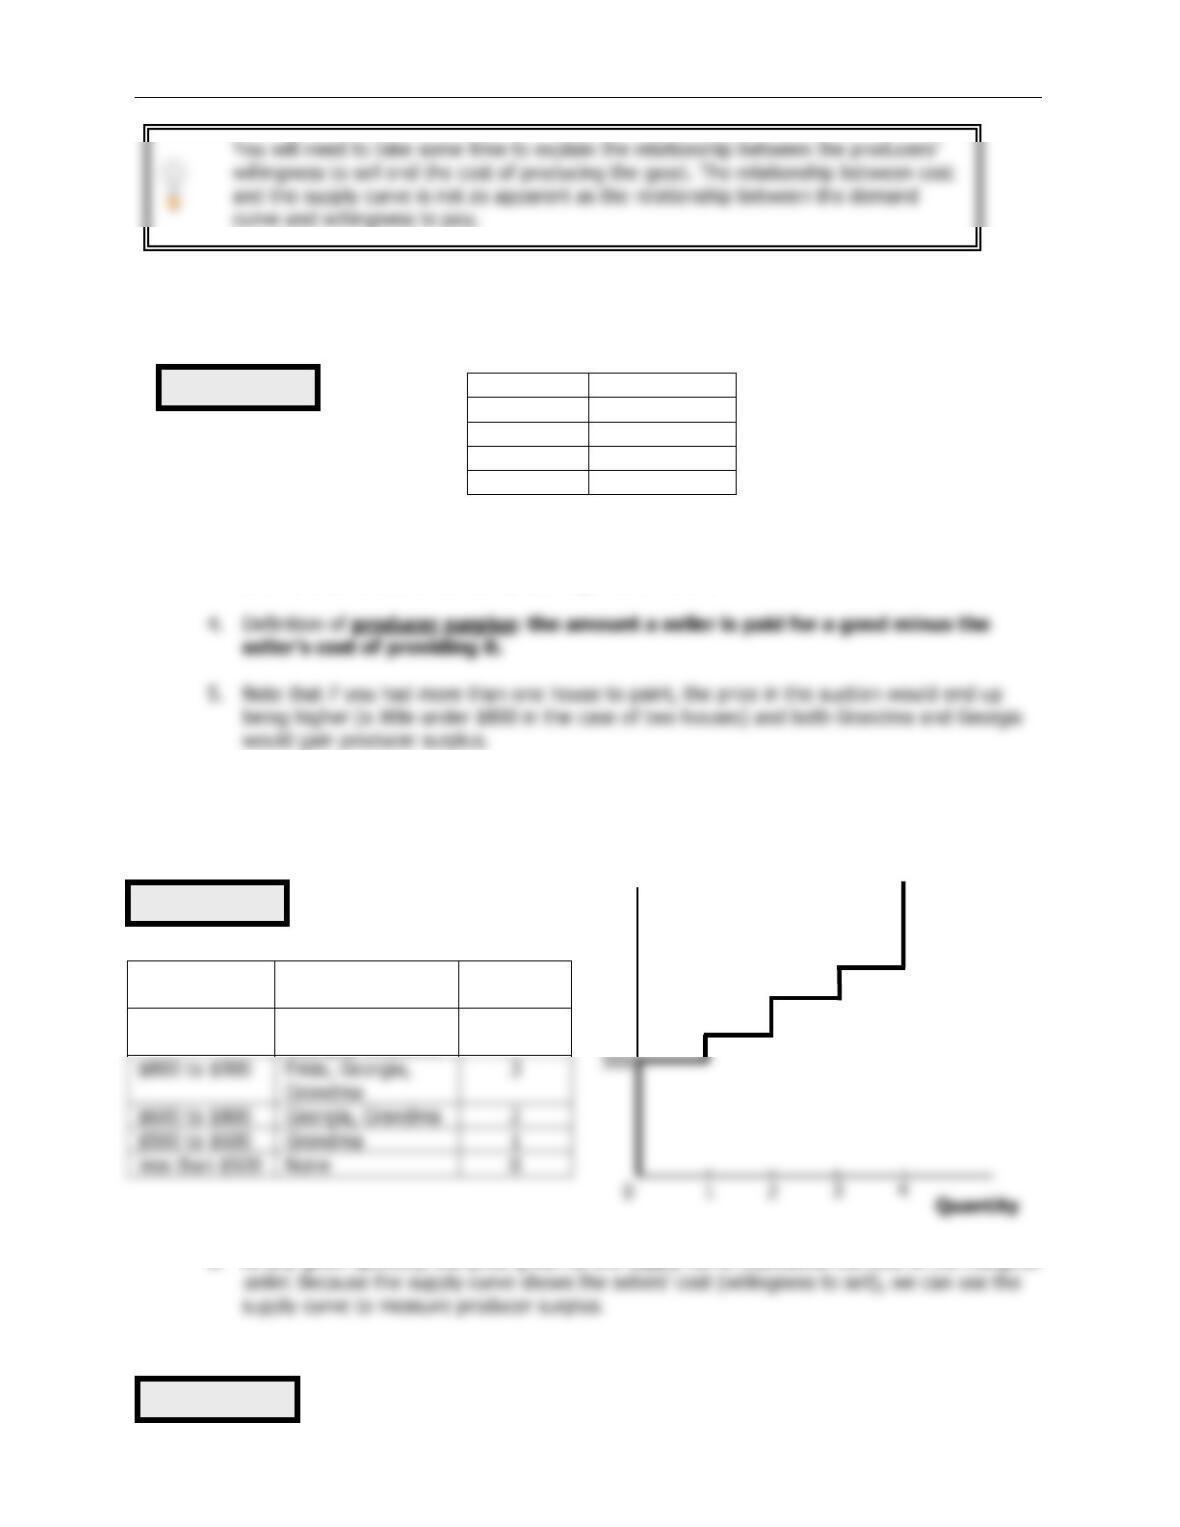
B. Using the Supply Curve to Measure Producer Surplus
1. We can use the information on cost (willingness to sell) to derive a supply curve for house
painting services.
Price
Sellers
Quantity
Supplied
$900 or more
Mary, Frida,
Georgia, Grandma
4
$800 to $900
Frida, Georgia,
Grandma
3
500
Quantity
2. At any given quantity, the price given by the supply curve represents the cost of the
marginal
3. Producer surplus can be measured as the area above the supply curve and below the price.
Table 2
Figure 4
Figure 5
Price of
House
Painting
900
800
600
Supply
Chapter 7/Consumers, Producers, and the Efficiency of Markets ❖ 127
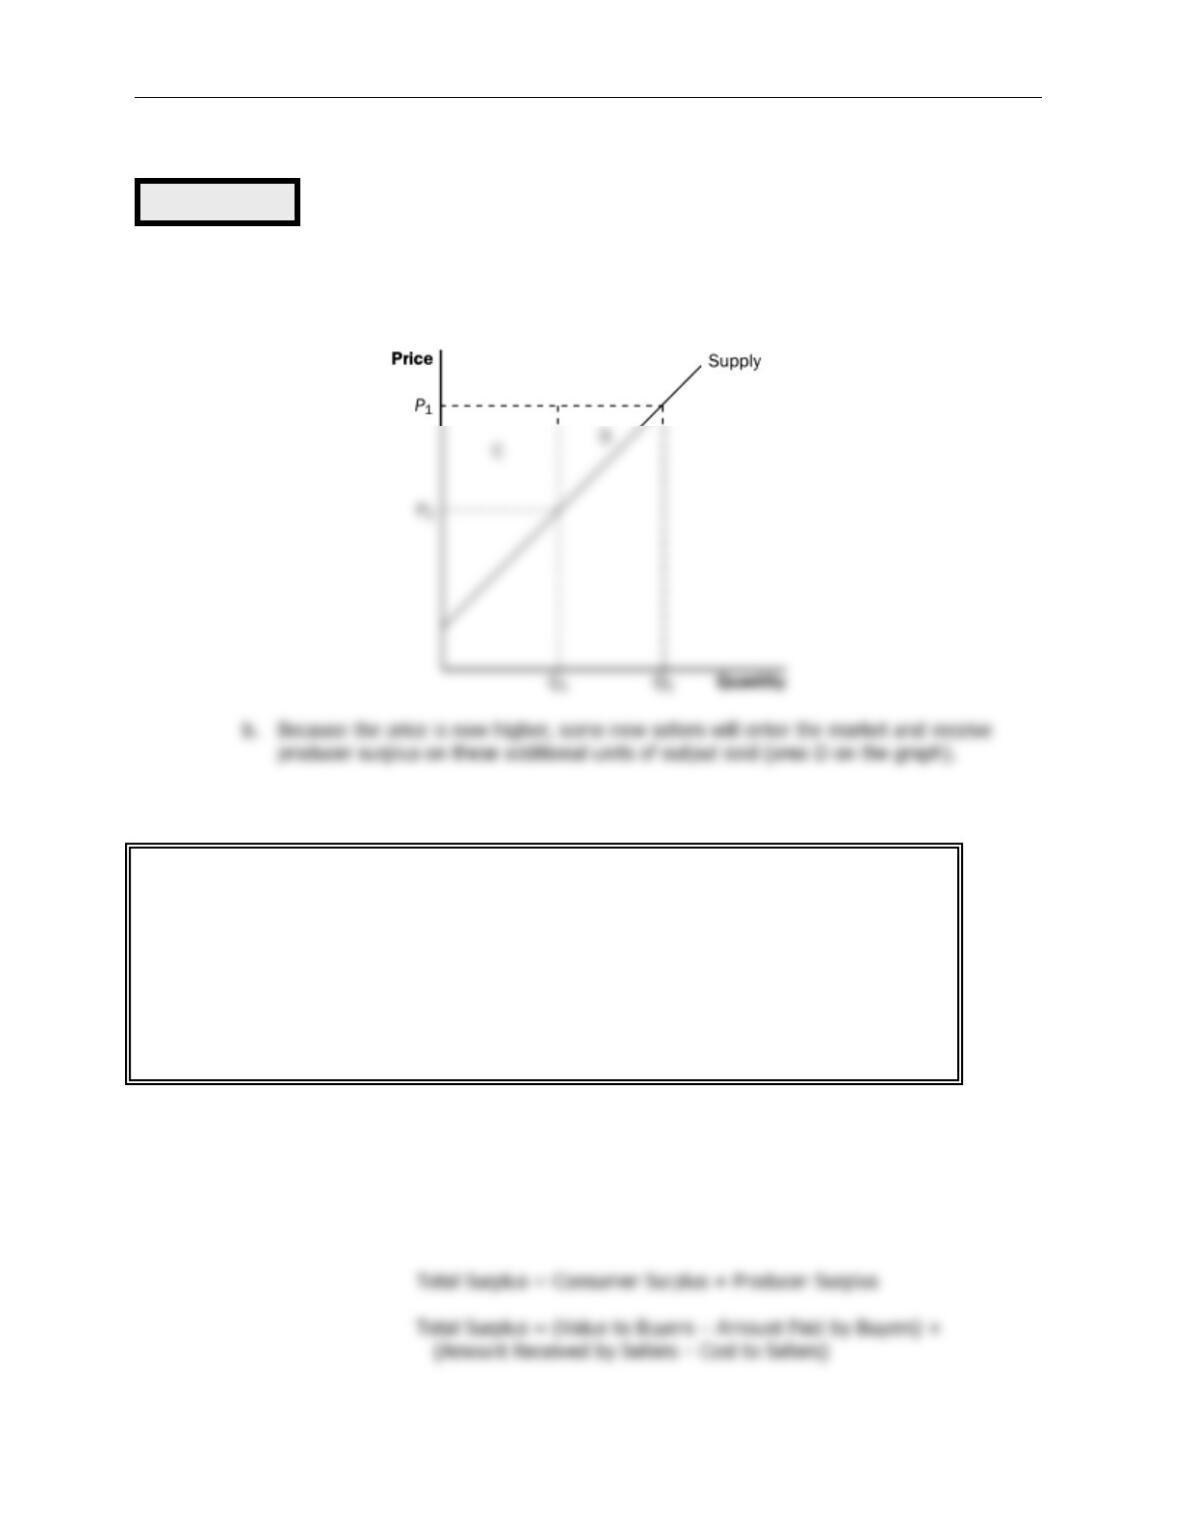
C. How a Higher Price Raises Producer Surplus
1. As price rises, producer surplus increases for two reasons.
a. Those already selling the product will receive additional producer surplus because they
are receiving more for the product than before (area C on the graph).
D. Producer surplus is used to measure the economic well-being of producers, much like consumer
surplus is used to measure the economic well-being of consumers.
IV. Market Efficiency
A. The Benevolent Social Planner
1. The economic well-being of everyone in society can be measured by total surplus, which is
the sum of consumer surplus and producer surplus:
Figure 6
ALTERNATIVE CLASSROOM EXAMPLE:
Review the material on price floors from Chapter 6. Redraw the market for an agricultural
product such as corn. Draw in a price support above the equilibrium price.
Then go through:
▪ producer surplus before the price support is put in place.
▪ producer surplus after the price support is put in place.
Make sure that you discuss the cost of the price support to taxpayers.
128 ❖ Chapter 7/Consumers, Producers, and the Efficiency of Markets
Because the Amount Paid by Buyers = Amount Received by
Sellers:
3. Definition of equality: the property of distributing economic prosperity uniformly
the members of society.
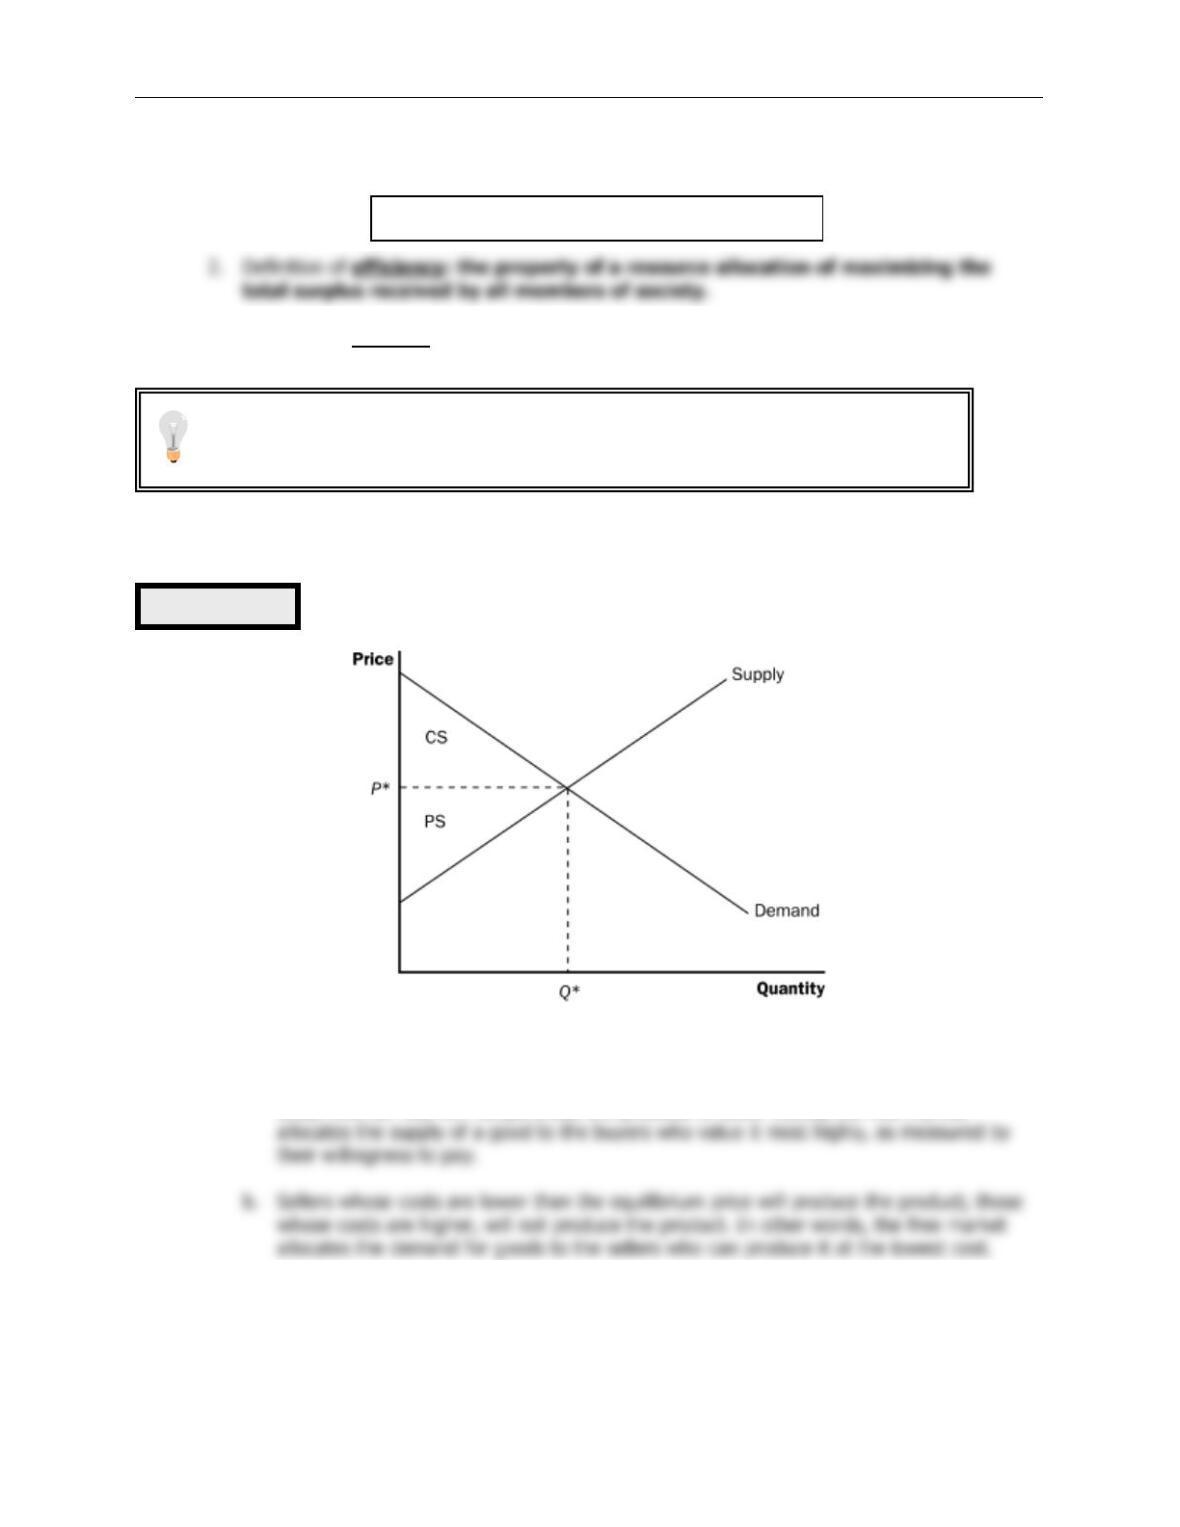
B. Evaluating the Market Equilibrium
1. At the market equilibrium price:
a. Buyers who value the product more than the equilibrium price will purchase the product;
those who do not, will not purchase the product. In other words, the free market
2. Total surplus is maximized at the market equilibrium.
Total Surplus = Value to Buyers Cost to Sellers−
Figure 7
Now might be a good time to point out that many government policies involve a
trade-off between efficiency and equity. When you evaluate government policies, like
price ceilings or floors, you can explain them in terms of equity and efficiency.
Chapter 7/Consumers, Producers, and the Efficiency of Markets ❖ 129
a. At any quantity of output smaller than the equilibrium quantity, the value of the product
to the marginal buyer is greater than the cost to the marginal seller so total surplus
would rise if output increases.
b. At any quantity of output greater than the equilibrium quantity, the value of the product
to the marginal buyer is less than the cost to the marginal seller so total surplus would
rise if output decreases.
3. Note that this is one of the reasons that economists believe Principle #6: Markets are usually
a good way to organize economic activity.
C.
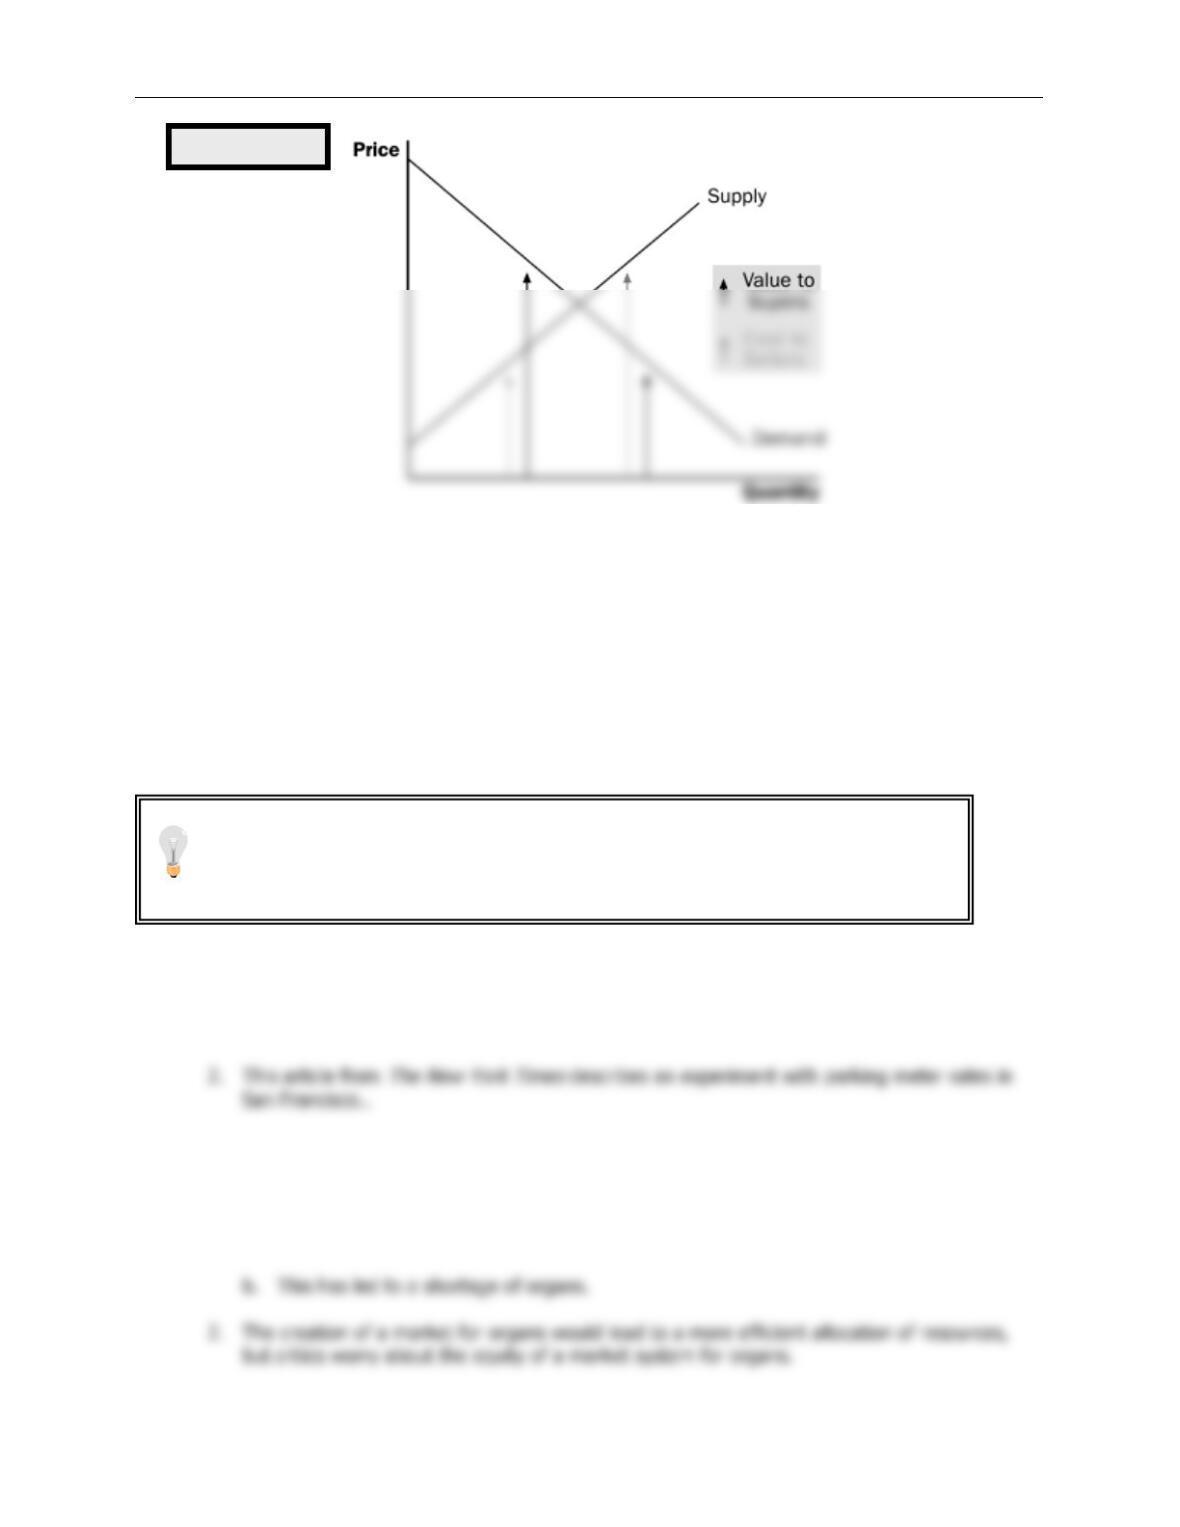
In the News: The Invisible Hand Can Park Your Car
1. Parking spots with meters that have variable rates depending on demand and supply can
result in a more efficient allocation of this scarce resource.
D.
Case Study: Should There Be a Market in Organs?
1. As a matter of public policy, people are not allowed to sell their organs.
a. In essence, this means that there is a price ceiling on organs of $0.
Figure 8
It would be a good idea to remind students that there are circumstances when the
market process does not lead to the most efficient outcome. Examples include
situations such as when a firm (or buyer) has market power over price or when there
are externalities present. These situations will be discussed in later chapters.
130 ❖ Chapter 7/Consumers, Producers, and the Efficiency of Markets
V. Market Efficiency and Market Failure
A. To conclude that markets are efficient, we made several assumptions about how markets
worked.
1. Perfectly competitive markets.
SOLUTIONS TO TEXT PROBLEMS:
Quick Quizzes
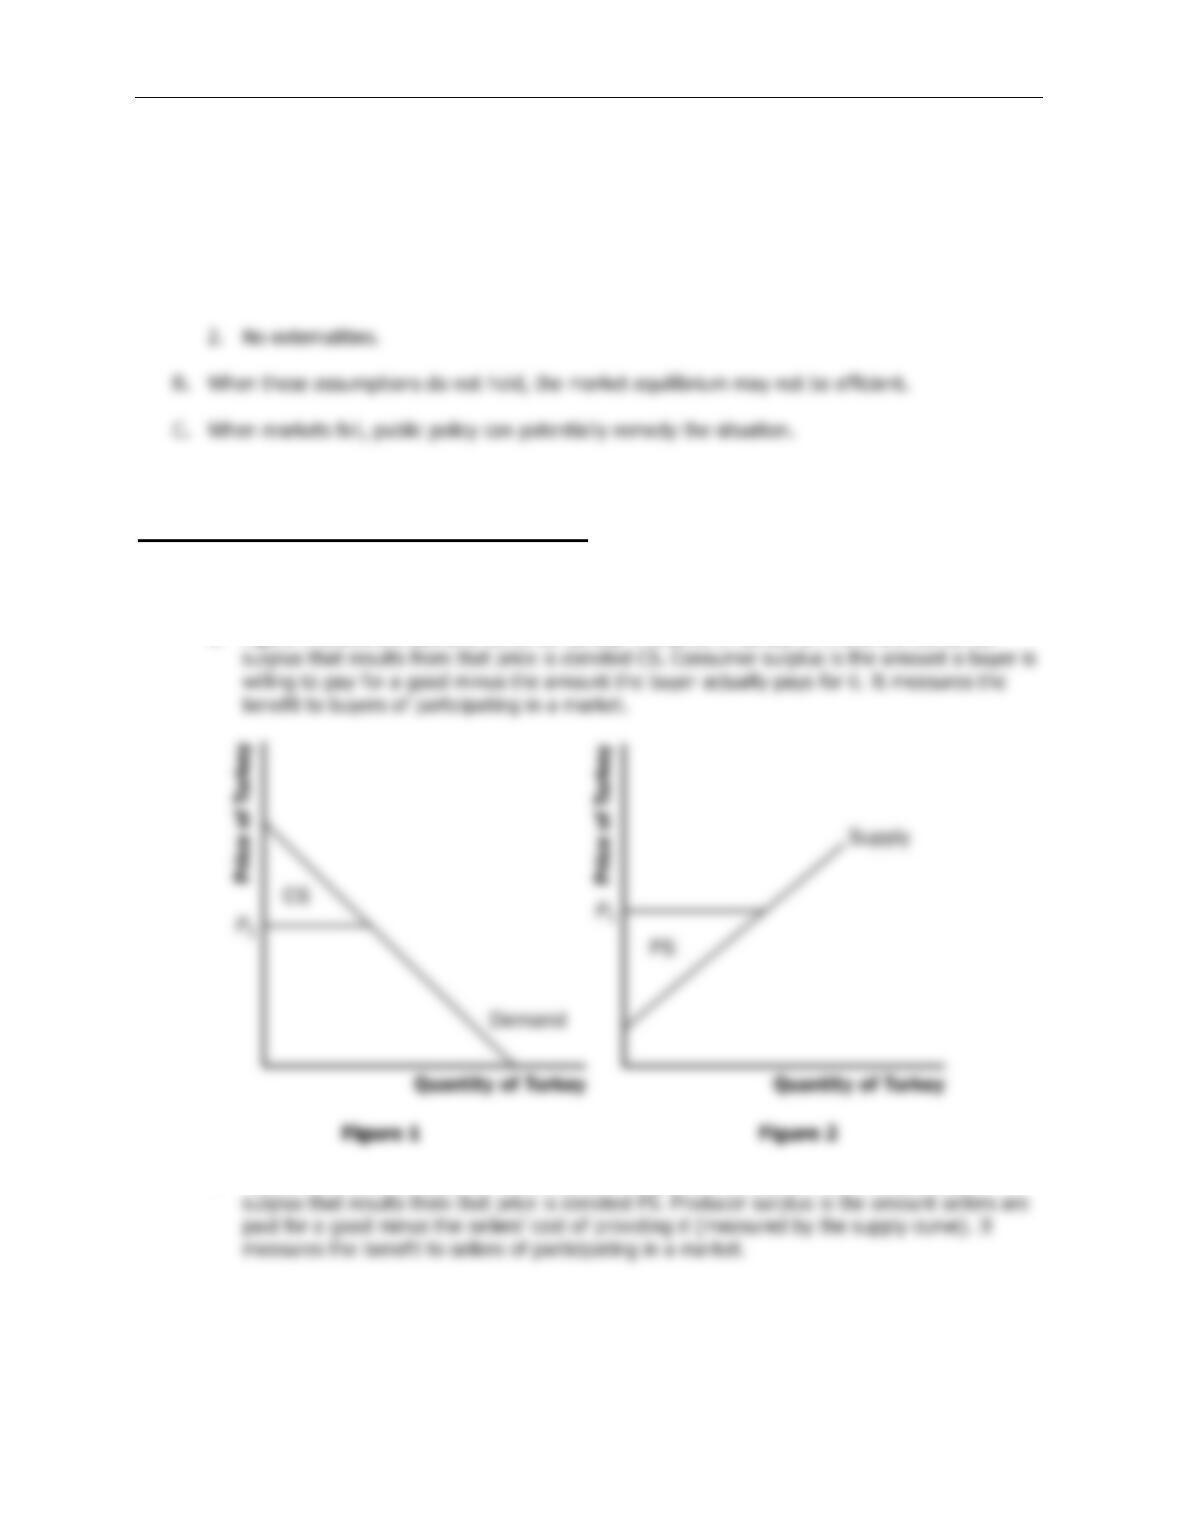
1. Figure 1 shows the demand curve for turkey. The price of turkey is
P
1 and the consumer
2. Figure 2 shows the supply curve for turkey. The price of turkey is
P
1 and the producer
Chapter 7/Consumers, Producers, and the Efficiency of Markets ❖ 131
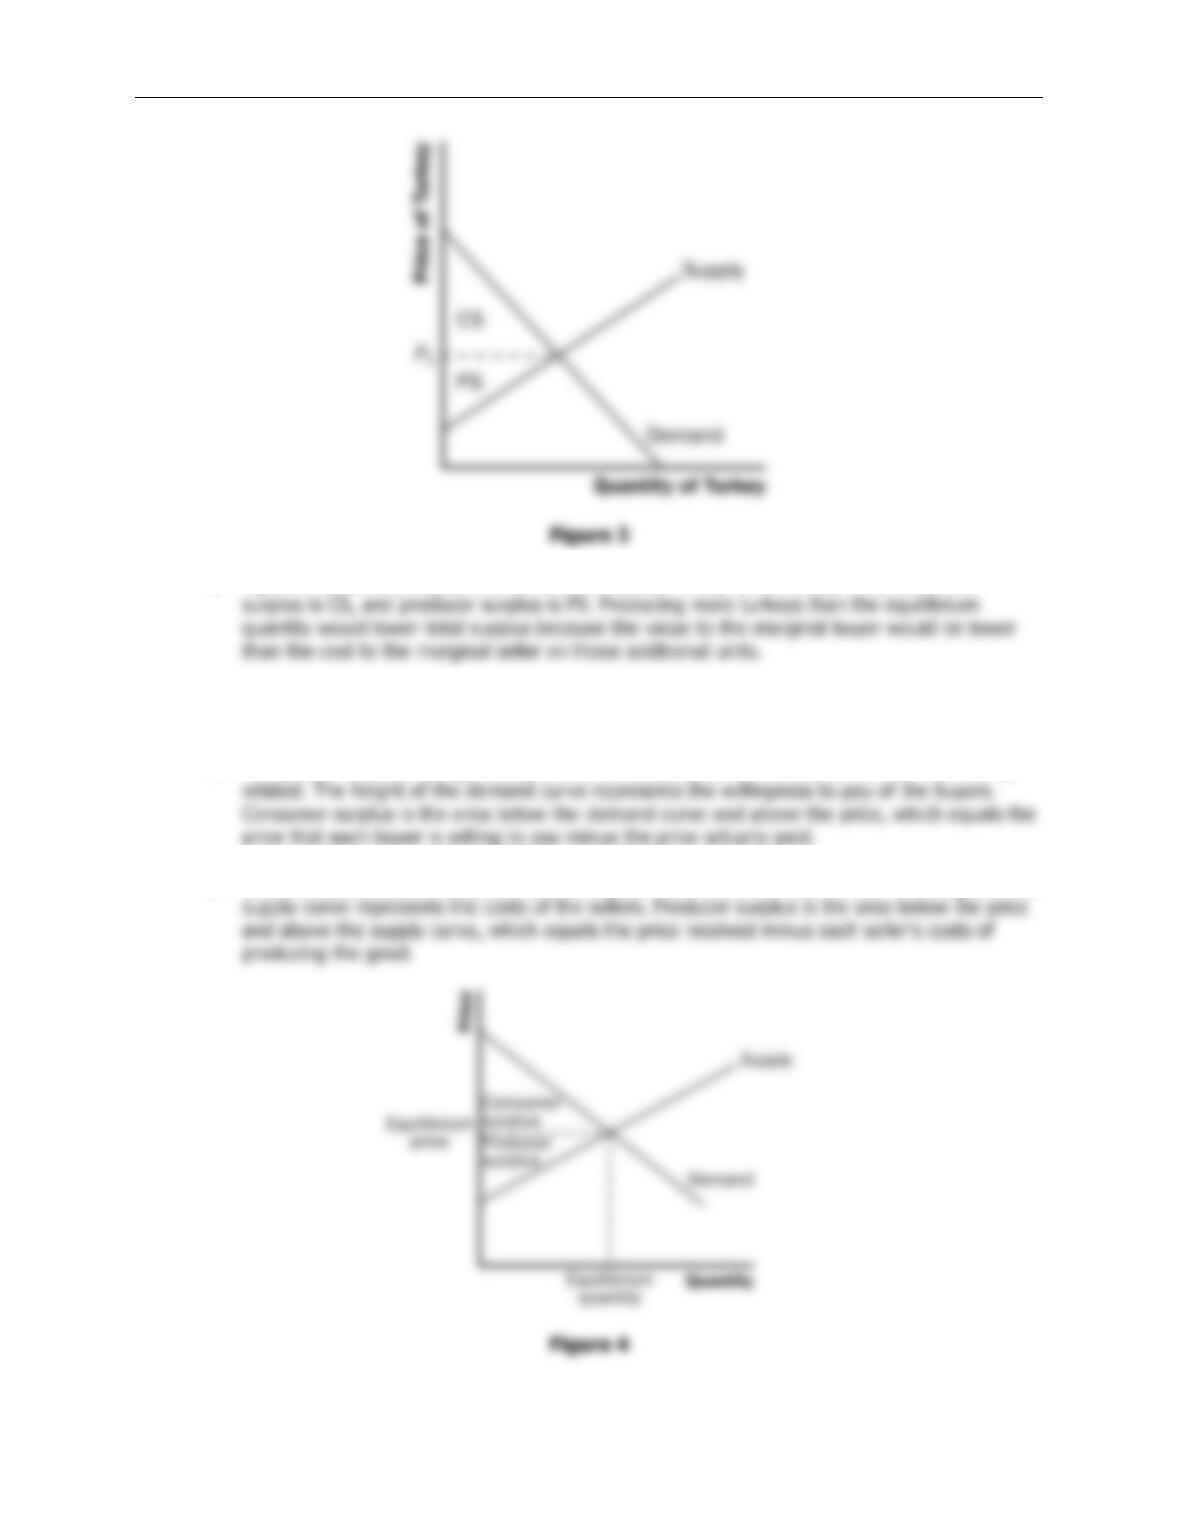
3. Figure 3 shows the supply and demand for turkey. The price of turkey is
P
1, consumer
Questions for Review
1. The price a buyer is willing to pay, consumer surplus, and the demand curve are all closely
2. Sellers’ costs, producer surplus, and the supply curve are all closely related. The height of the