Chapter 7:
DEMAND ESTIMATION AND FORECASTING
Essential Concepts
1. Empirical demand functions are demand equations derived from actual market data. Empirical
demand functions are extremely useful in making pricing and production decisions.
2. In linear form, an empirical demand function can be specified as
Q=a+bP +cM +dP
R
where Q is the quantity demanded, P is the price of the good or service, M is consumer income, and
3. When demand is specified in log-linear form, the demand function can be written as
Q=aPbMcP
R
d
ˆ
ˆ
ˆ
4. When a firm possesses some degree of market power, which makes it a price-setting firm, the
demand curve for the firm can be estimated using the method of least-squares estimation set
5. A time-series model shows how a time-ordered sequence of observations on a variable, such as price
or output, is generated. The simplest form of time-series forecasting is linear trend forecasting. In a
6. Seasonal or cyclical variation can bias the estimation of a and b in linear trend models. In order to
account for seasonal variation in trend analysis, dummy variables are added to the trend equation.
7. When using dummy variables to account for N seasonal time periods, N −1 dummy variables are
8. The following problems and limitations are inherent in forecasting:
i. The further into the future the forecast is made, the wider is the confidence interval or region of
uncertainty.
Answers to Applied Problems
1. a. All parameters are significantly different from zero at the 7.16 percent level of significance or
better. The signs of the parameter estimates are consistent with consumer theory:
ˆ
b
is negative
as the law of demand predicts,
ˆ
c
is positive indicating tennis balls are a normal good, and
ˆ
d
is
negative as it should be for complements (tennis balls and tennis rackets).
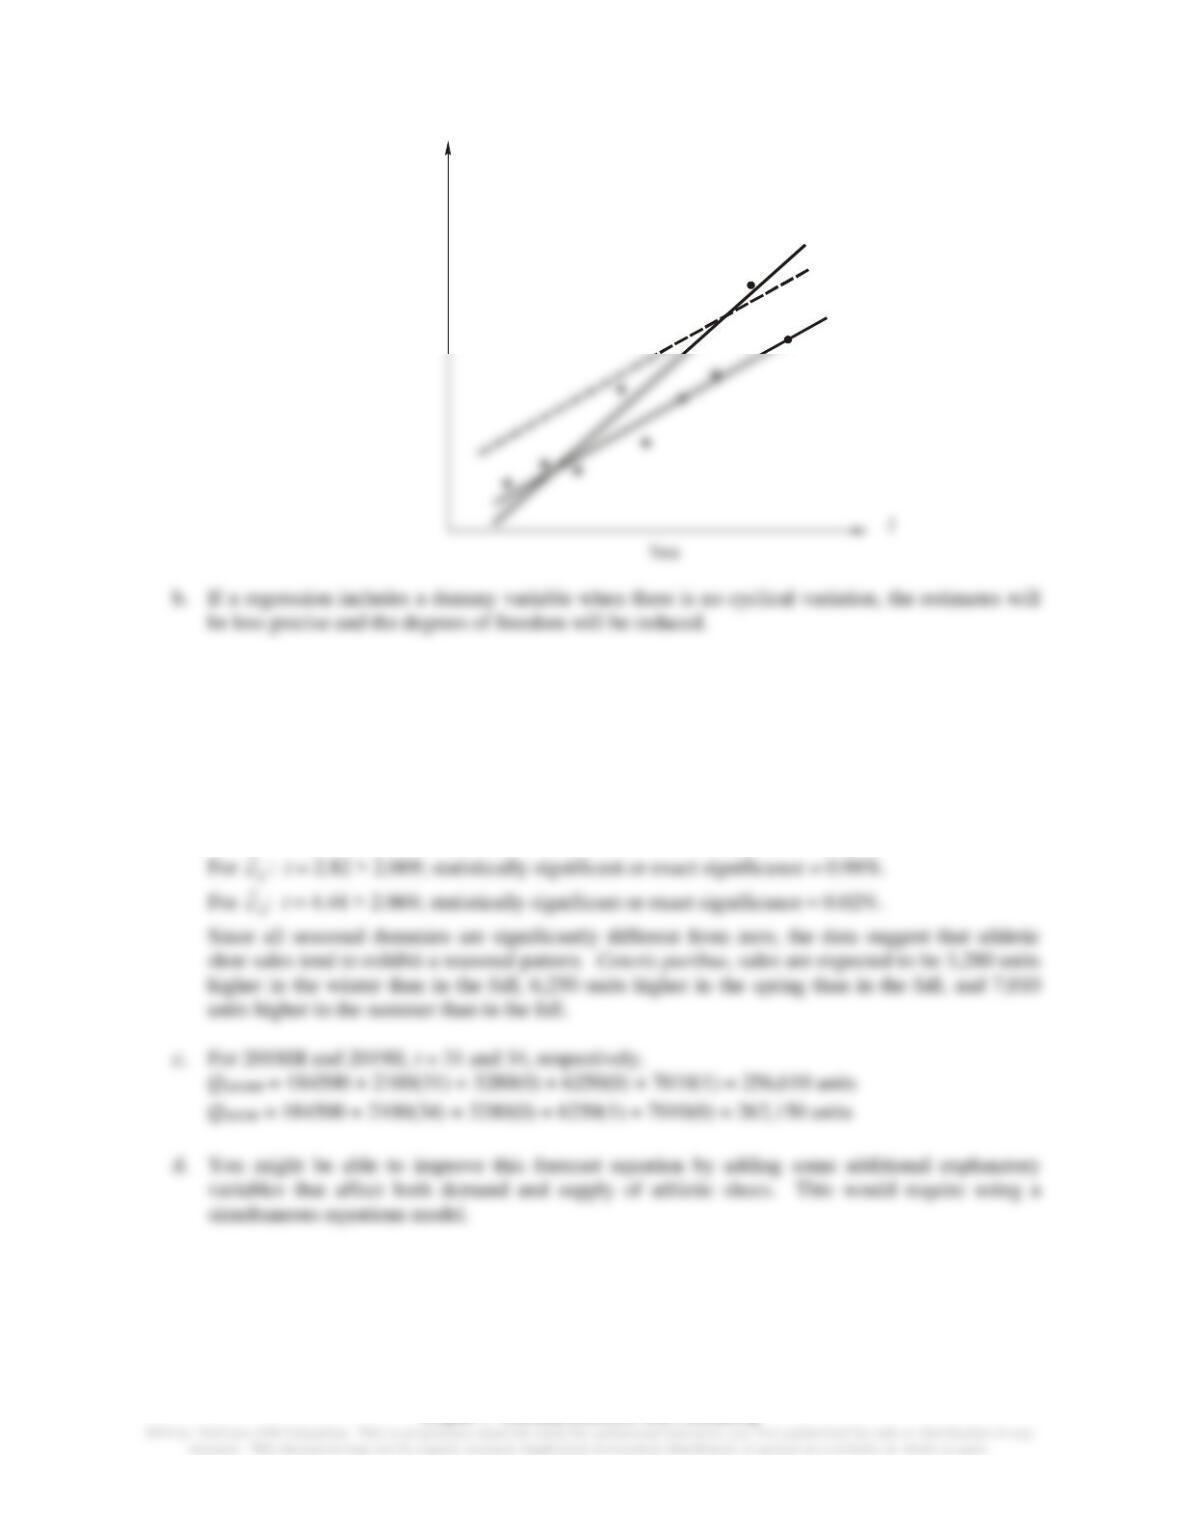
2. a. If Cypress River’s sales vary cyclically, sales forecasts will be biased unless the cyclical variation
is taken into account. In the figure below, a, b, and c were estimated using a dummy variable to
account for seasonal variation. The parameters a’ and b’ were estimated without treating
seasonal observations differently. In the situation depicted, the time trend parameter estimate b’
Chapter 7: Demand Estimation and Forecasting
Sales
Qt
Q = a + bt
t
Q = a + c + bt
t
Q = a’ + b’t
t
3. a. Consider the statistical significance of
ˆ
b
. The critical value of t for 28 –5 = 23 degrees of
freedom and a 95% confidence level is 2.069, and the t-ratio for
ˆ
b
is much greater. The p-value
for b indicates strong statistical significance. Thus, the regression analysis provides very strong
statistical evidence of an upward trend in shoe sales.
b. Looking at either t-tests (at 5% significance level) or p-value on the seasonal dummies:
For
ˆ
c1
: t = 2.17 > 2.069; statistically significant or exact significance = 4.04%.