CHAPTER 6
Excavation, Grading, and Compacted Fill
QUESTIONS AND PRACTICE PROBLEMS
Section 6.1 Earthwork Construction Objectives
6.1 Describe the common objectives of earthwork in a civil engineering project.
Solution
The most fundamental objective of earthwork construction is to change the ground
6.2 Define cut and fill in the context of civil engineering earthwork and provide two
examples of each.
Solution
Most civil engineering projects include some earthwork, which is the process of changing
6-2 Excavation, Grading, and Compacted Fill Chap. 6
Section 6.2 Construction Methods and Equipment
6.3 List, in order, the steps in conventional earthwork and describe the purpose of each step.
Solution
1. Clearing and Grubbing – The removal of vegetation, trash, debris, and other
undesirable materials from the areas to be cut or filled.
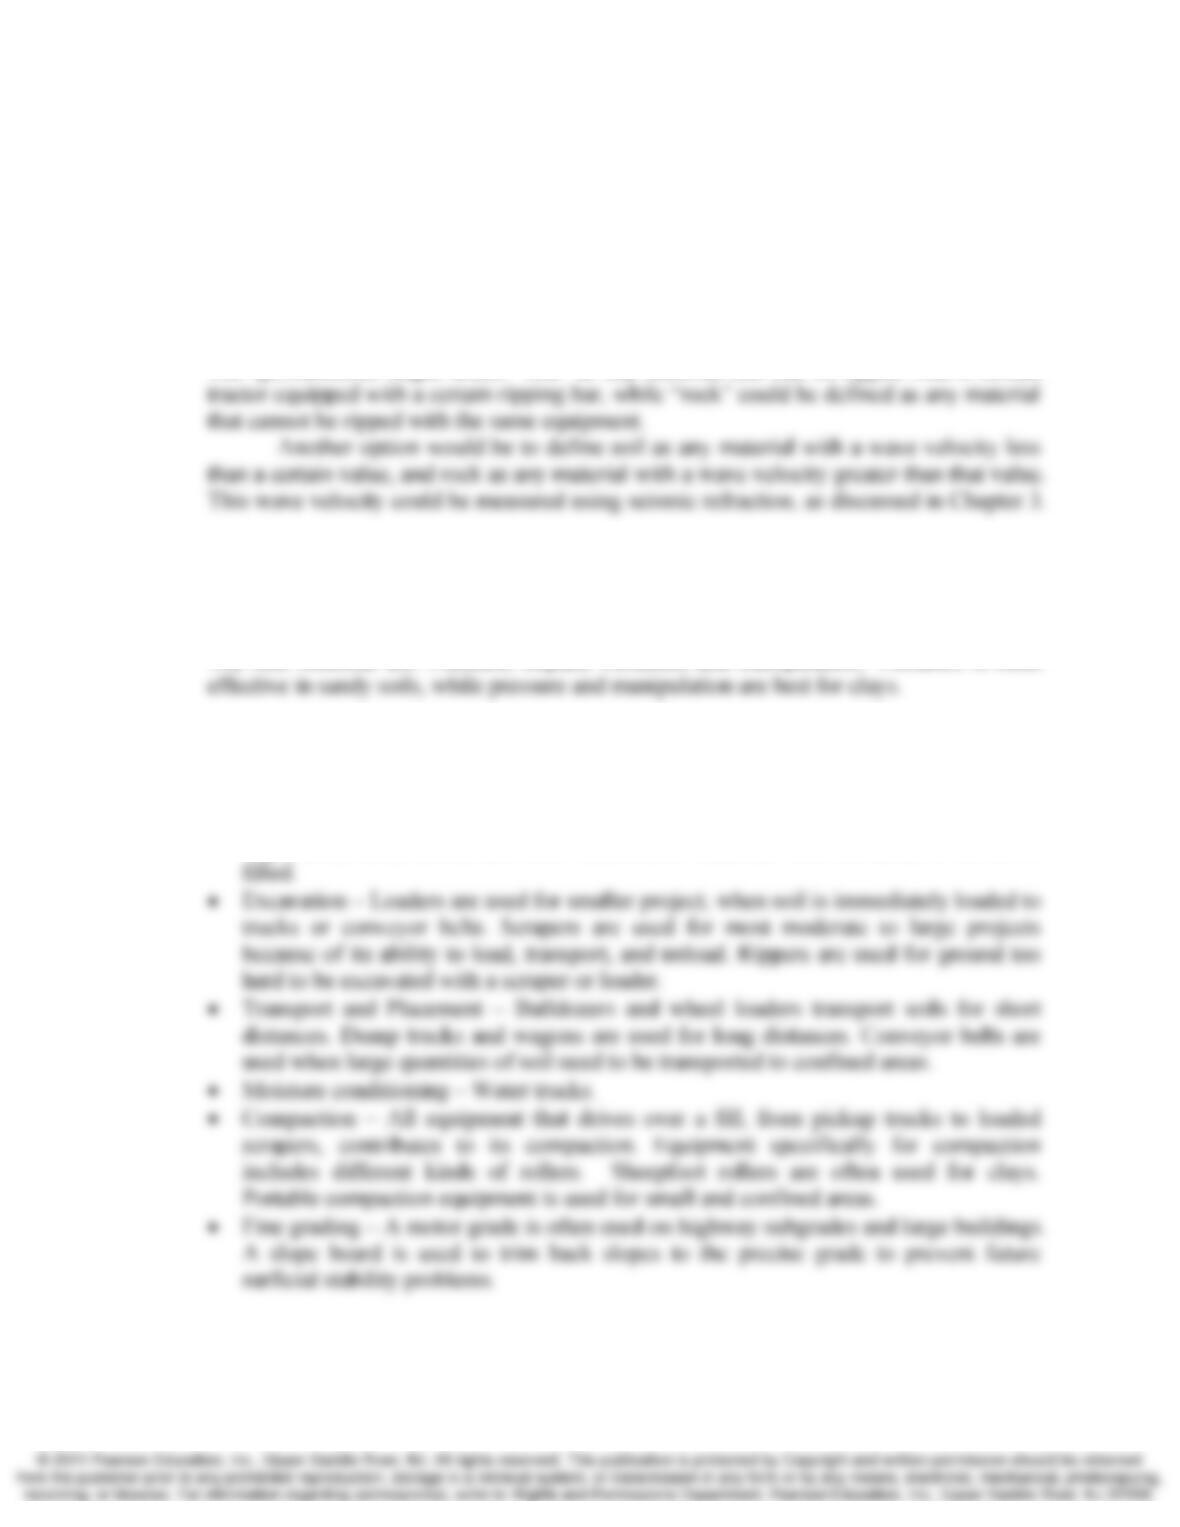
6.4 Use phase diagrams to illustrate the changes that occur in the three phases in a soil during
earthwork.
Solution
Chap. 6 Excavation, Grading, and Compacted Fill 6-3
6.5 You are preparing the earthmoving specifications for a project that will include a wide
range of materials, from loose soil to hard rock. Because of this variation, you plan to
use a classified excavation system so the contractor can give two unit prices, one for
common excavation and another for rock. However, to avoid disagreements on
classification, you also need to develop clear definitions for each type of excavation.
What criteria might you use to differentiate between common and rock excavation?
Solution
The specifications might define “soil” as any material that can be ripped with a certain
6.6 What are the four methods used by mechanical compaction equipment to densify soils?
Which of these methods are most effective in sands? In clays?
Solution
The four methods are: Pressure, impact, vibration, and manipulation. Vibration is most
6.7 List the construction equipment typically required to perform earthwork.
Solution
• Clearing and Grubbing – Loaders, backhoes, excavators are used to remove
vegetation, trash, debris, and other undesirable materials from the areas to be cut or
6-4 Excavation, Grading, and Compacted Fill Chap. 6
6.8 A contractor needs to excavate several thousand cubic yards of silty clay at one end of a
site, transport it to the other end, and place it as a compacted fill. The distance between
the cut and fill areas is about 3000 ft. The soils in the cut area can be excavated with
little or no ripping. However, they are very dry. Make a list of the construction
equipment needed to complete this project.
Solution
A haul distance of 3000 ft is well within the capabilities of scrapers. In addition, this soil
Required equipment:
• Scrapers
• Tractors with ripper bars in cut area
• Water trucks in fill area
• Tractors with bulldozers and appropriate compaction equipment
6.9 Describe how the weight of compaction equipment, number of passes and lift thickness
affect compaction of a given soil.
Solution
The compactive effort is related to the weight of the compaction equipment, the number
6.10 A developer plans to build a condominium complex on a site underlain by an old
hydraulic fill. What special geotechnical problems need to be considered at this site?
Why?
Solution
Hydraulic fills were not well compacted, so they have poor engineering properties. These
Chap. 6 Excavation, Grading, and Compacted Fill 6-5
Section 6.3 Soil Compaction Concepts
6.11 Why do we use the dry unit weight as a measure of how compacted a soil is?
Solution
Geotechnical engineers use the dry unit weight, γd, because empirical data suggest higher
6.12 For a given compactive effort, describe how the dry unit weight of the compacted soil is
affected by the as-compacted moisture content.
Solution
One of the key considerations in the design and construction of compacted fills is the
Section 6.4 Soil Compaction Standards and Specifications
6.13 How does the dry unit weight, γd, differ from the unit weight γ? Why is the Proctor
method of assessing soil compaction based on the dry unit weight and not the unit weight?
Solution
The dry unit weight, γd, is defined as Ws /V, while the unit weight, γ, is defined as W/V.
6-6 Excavation, Grading, and Compacted Fill Chap. 6
6.14 A certain soil has a dry unit weight of 18.0 kN/m3 and a specific gravity of solids of 2.67.
Compute the moisture contents that correspond to S = 80% and S = 100%.
Solution
Equation 4.32:
6.15 Describe the differences between the standard and modified Proctor tests. Describe the S
= 100% curve (zero air voids curve) and why it is important to the evaluation of
compaction data.
Solution
Modified Proctor developed the U.S. Army Corps of Engineers, which used a higher
Chap. 6 Excavation, Grading, and Compacted Fill 6-7
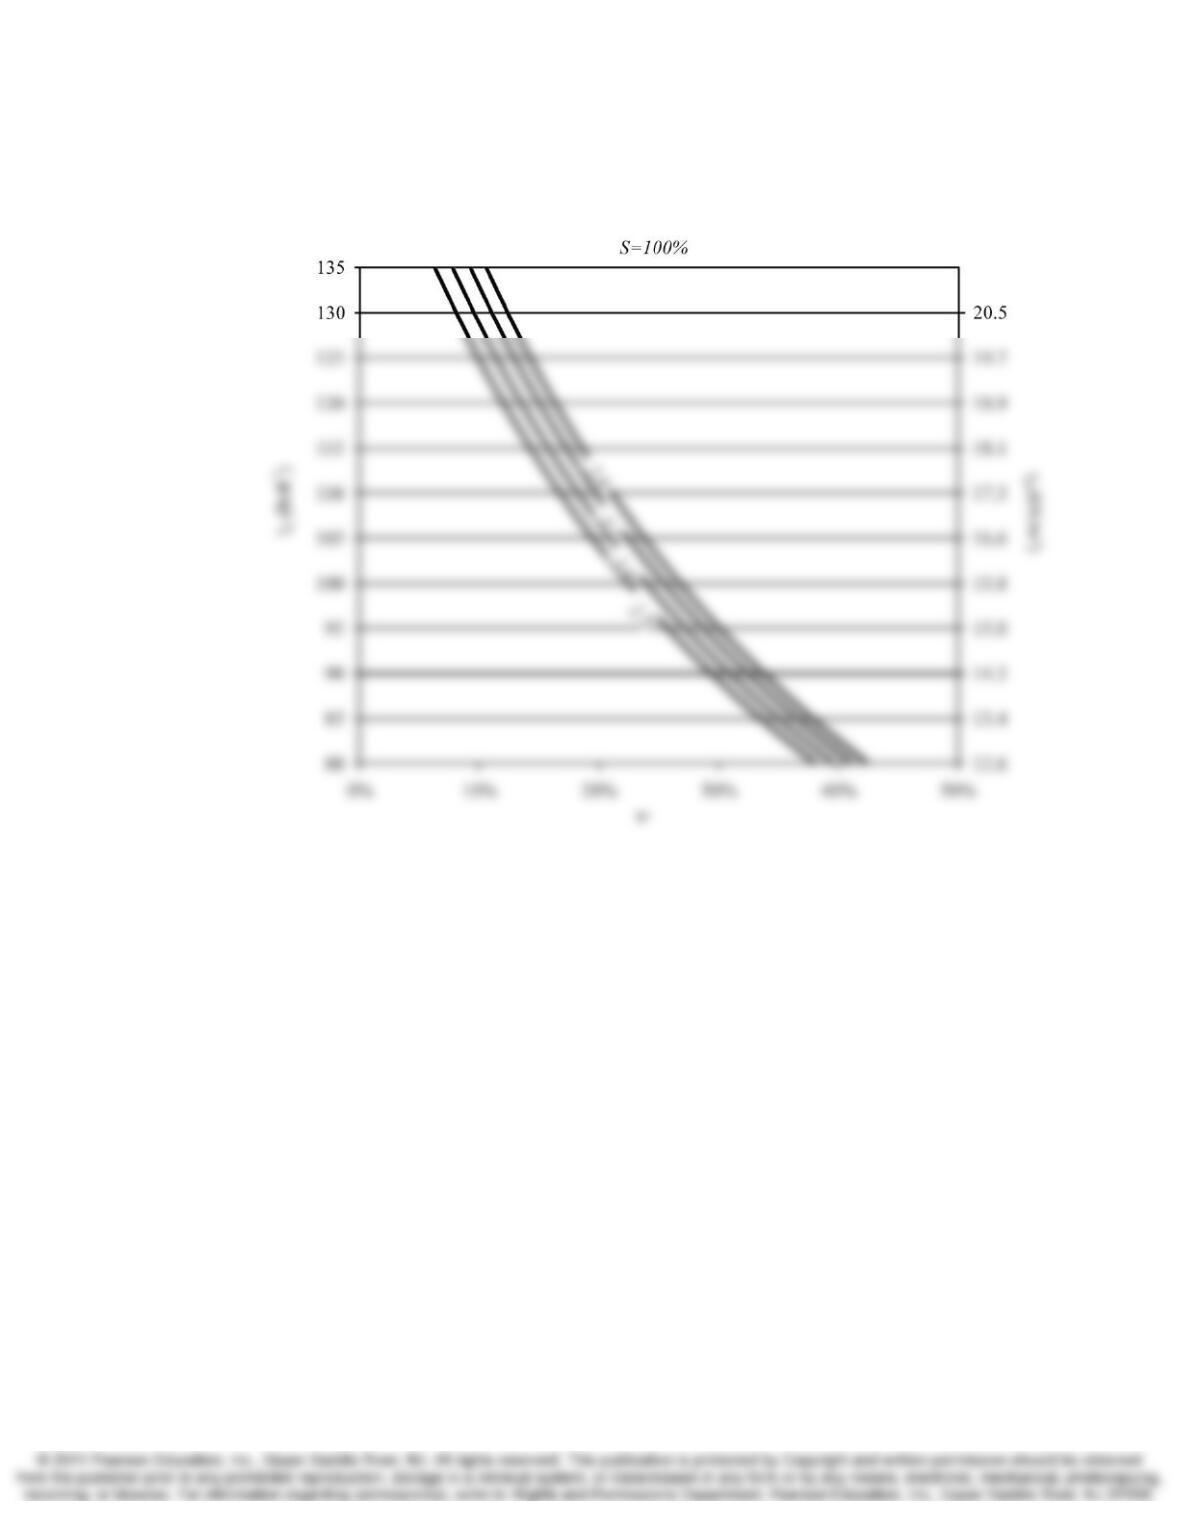
6.16 Plot the S = 100% curves assuming Gs values of 2.5, 2.6, 2.7 and 2.8.
Solution
6-8 Excavation, Grading, and Compacted Fill Chap. 6
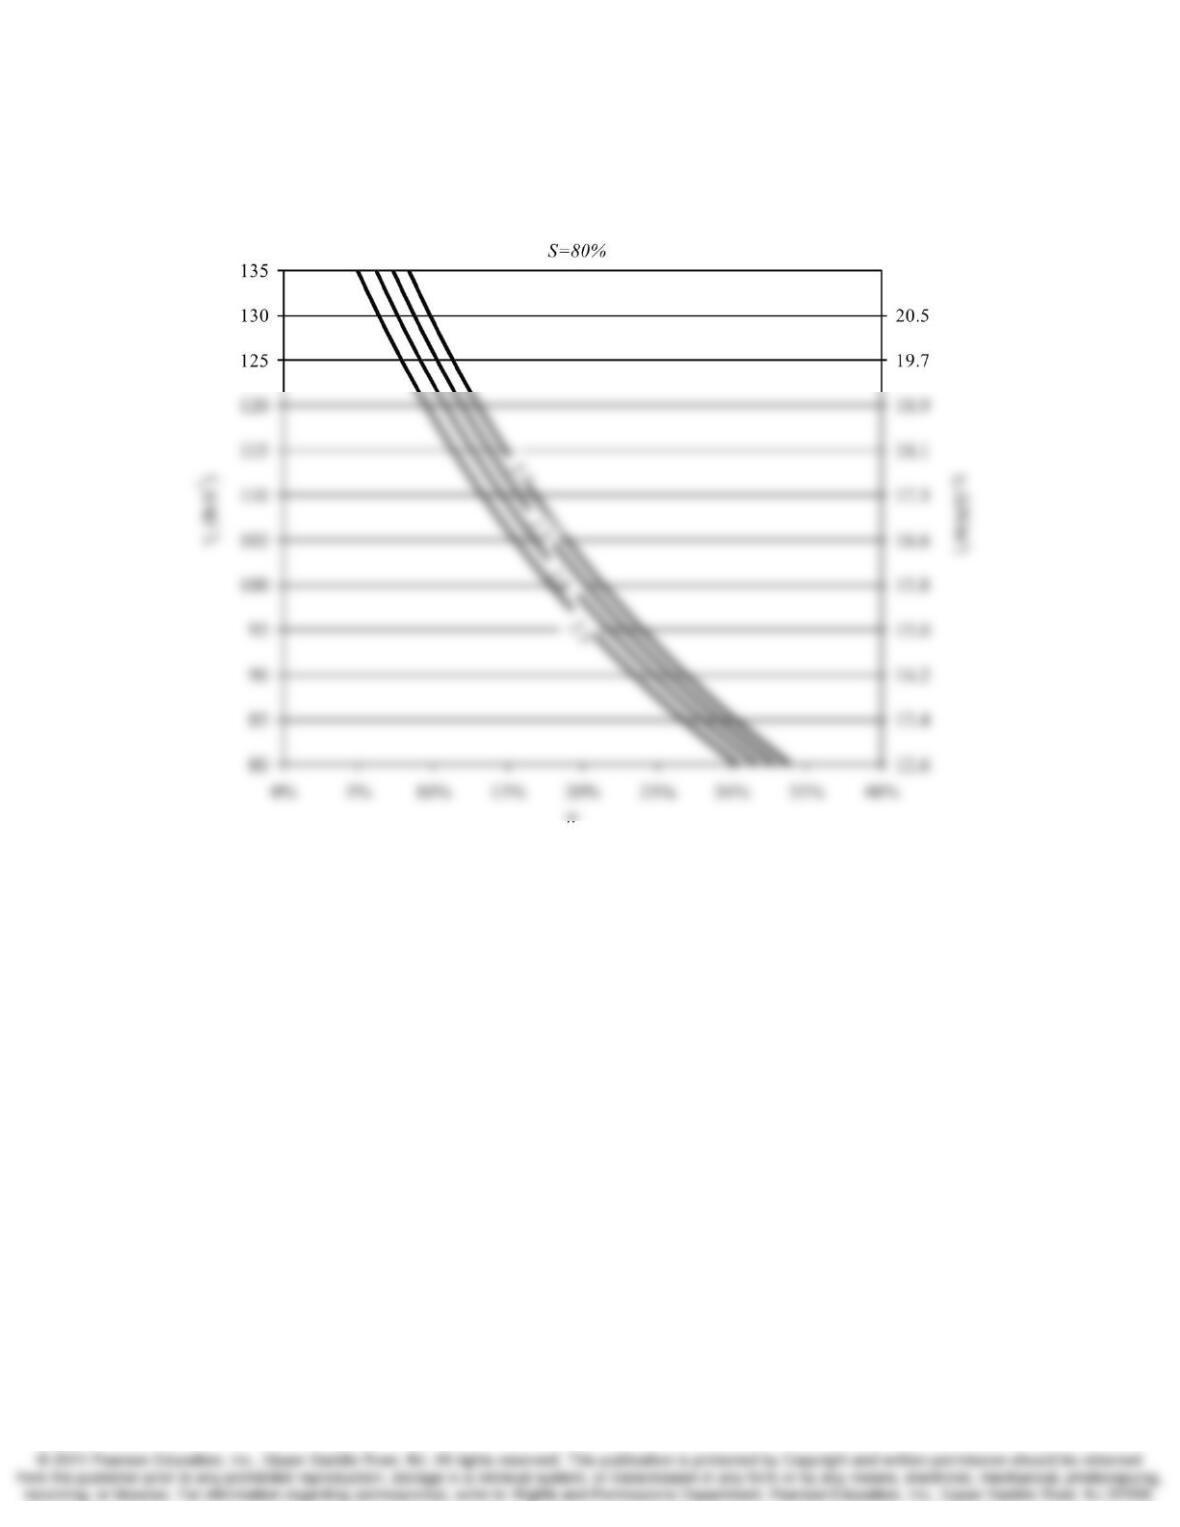
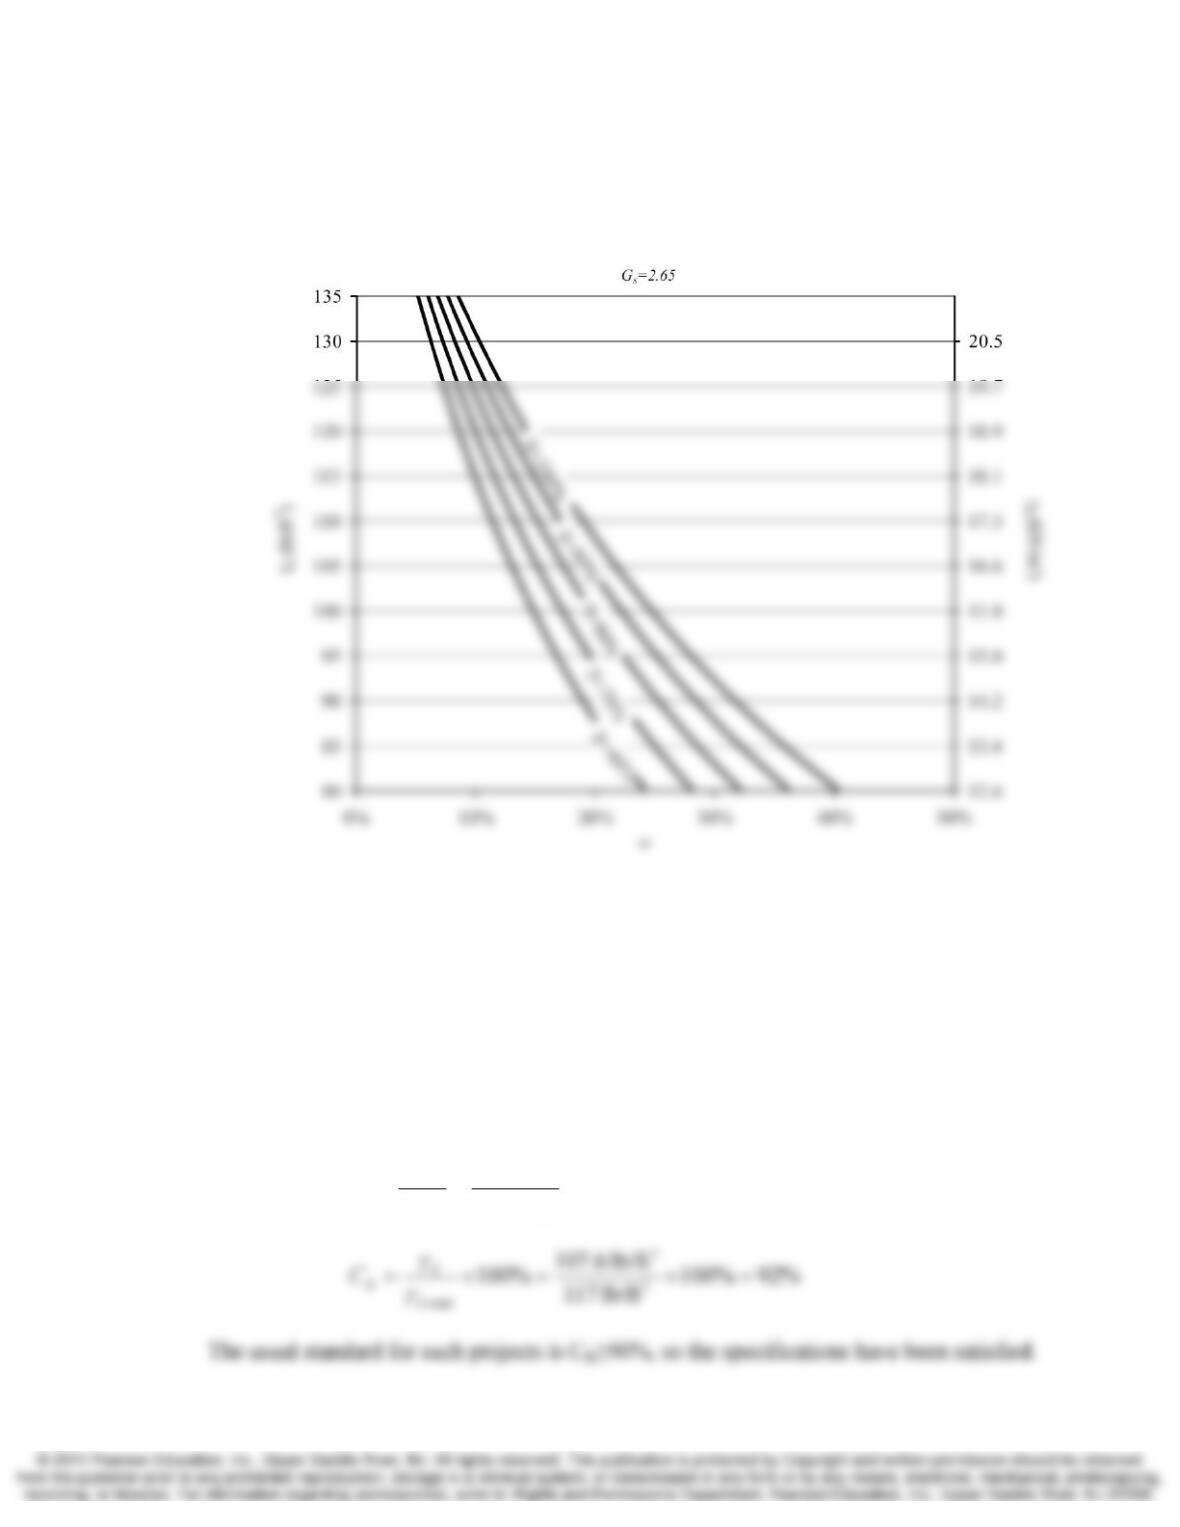
6.17 Plot the S = 80% curves assuming Gs values of 2.5, 2.6, 2.7 and 2.8.
Solution
Chap. 6 Excavation, Grading, and Compacted Fill 6-9
6.18 Plot curves corresponding to S values of 60%, 70%, 80%, 90% and 100%, assuming a Gs
of 2.65.
Solution
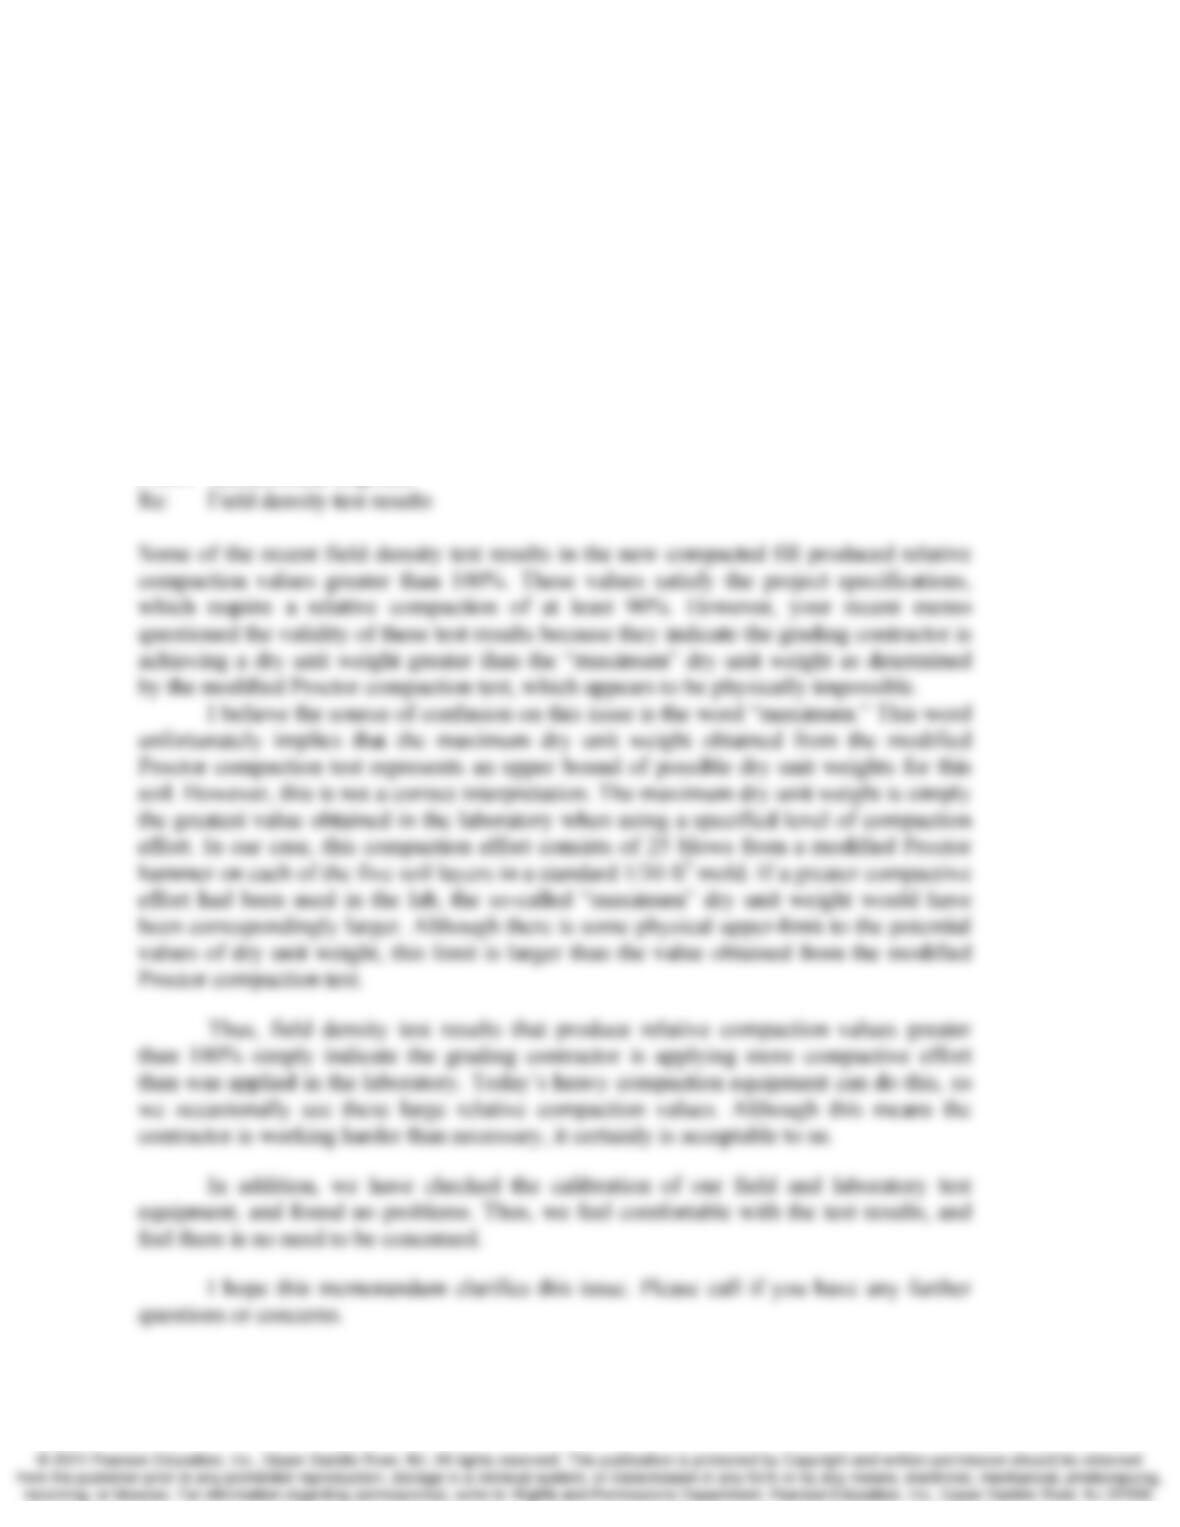
6.19 A compacted fill, currently under construction, will support a proposed supermarket.
One of the field density tests in this fill gave a unit weight of 121 lb/ft3 and a moisture
content of 12.5%. A series of modified Proctor tests have also been performed on the fill
soils per ASTM D1557, and they gave a maximum dry unit weight of 117 lb/ft3 and an
optimum moisture content of 13.0%. Compute the relative compaction based on the
modified Proctor test and determine whether or not it satisfies the normal compaction
specification for such a project.
Solution
3
3
lb/ft 107.6
0.1251
lb/ft 121
1=
+
=
+
=w
d
γ
γ
6-10 Excavation, Grading, and Compacted Fill Chap. 6
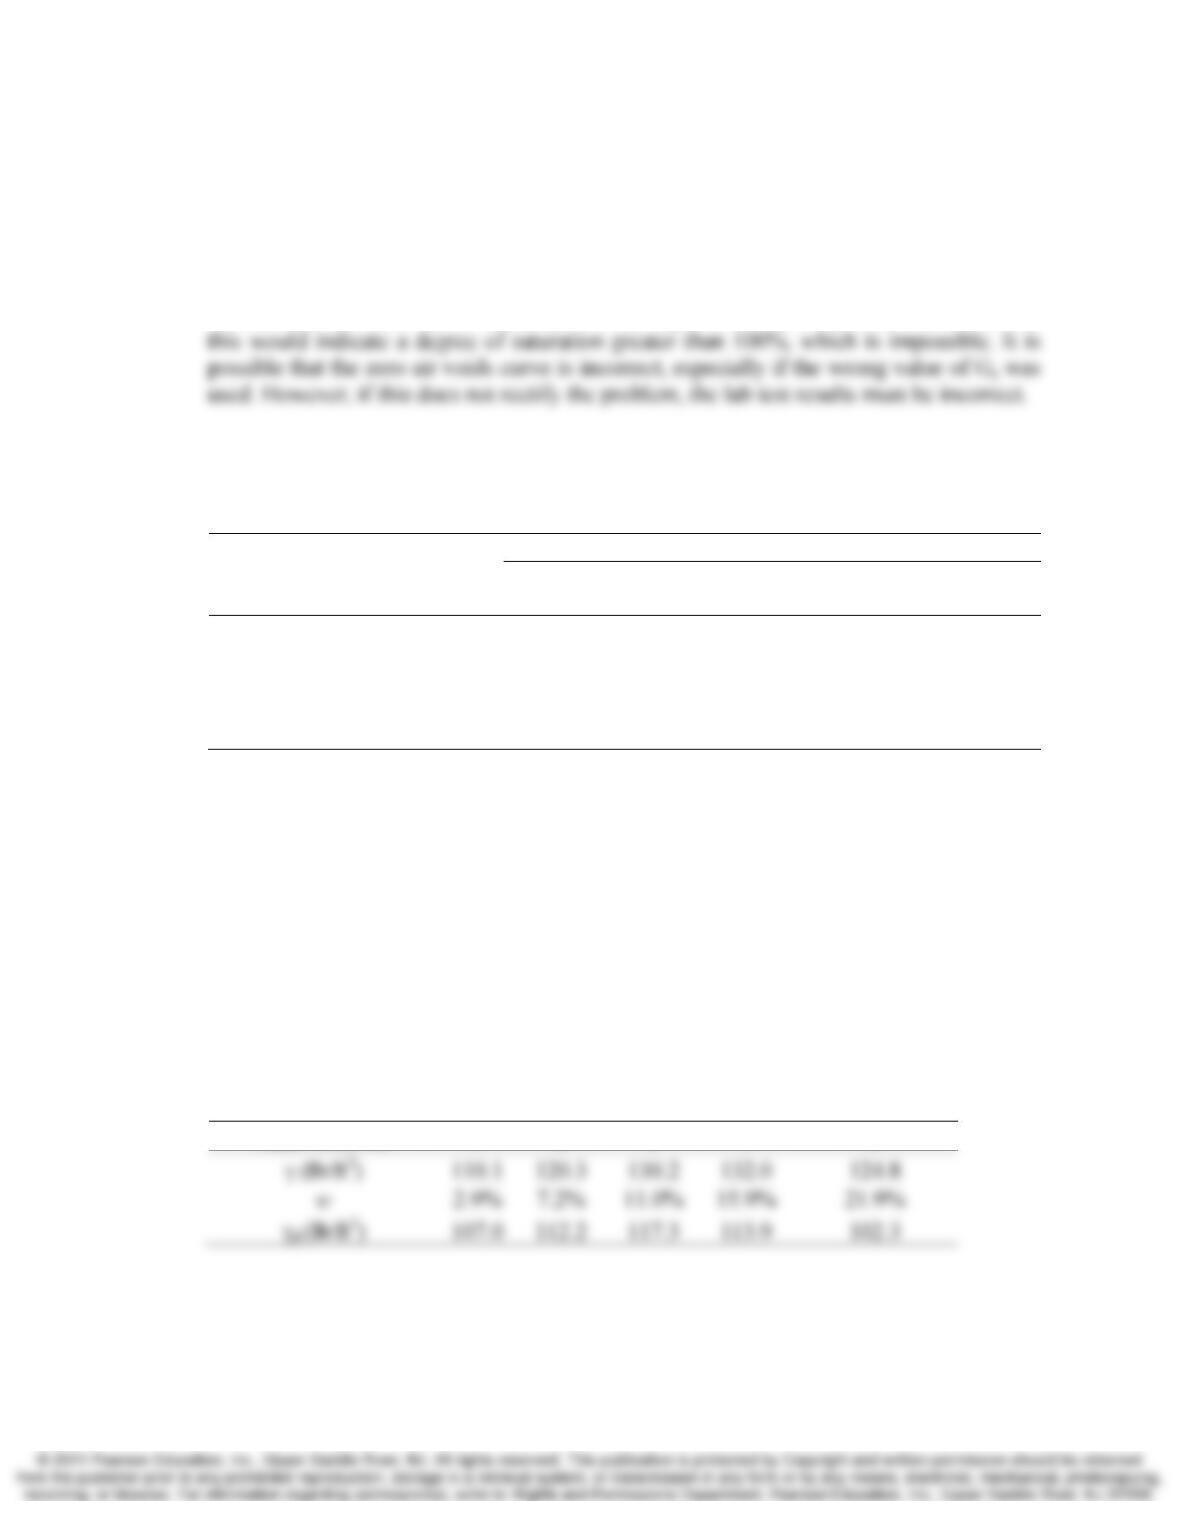
6.20 A field density test has been conducted in a compacted fill that is currently under
construction. The test results indicate a relative compaction based on the modified
Proctor test of 101–103%, which made the construction manager believe the test must be
incorrect. He believes it is impossible for the dry unit weight in the field to be greater
than the maximum dry unit weight from the modified Proctor test. Prepare a 200–400
word memo explaining why the relative compaction in the field could indeed be greater
than 100%.
Solution
Memorandum
To: Construction manager
From: Geotechnical engineer
Chap. 6 Excavation, Grading, and Compacted Fill 6-11
6.21 You are a geotechnical engineer and have just received the results from some modified
Proctor tests. In plotting the compaction curve, you notice that some of the data points
are plotted to the right of the zero air voids curve. Is this cause for concern? Why do you
think these points are plotted like this?
Solution
The modified Proctor curve cannot plot to the right of the zero air voids curve because
6.22 A series of modified Proctor tests have been performed on a soil that has a Gs of 2.68.
The test results obtained are as follows.
Point
No.
Weight of
Compacted Soil +
Mold (lb)
Moisture Content Test Results
Mass of
Can (g)
Mass of Can +
Moist Soil (g)
Mass of Can + Dry
Soil (g)
1 8.73 22.13 207.51 202.30
2 9.07 25.26 239.69 225.27
3 9.40 19.74 253.90 230.64
4 9.46 23.36 250.93 219.74
5 9.22 20.28 301.47 250.95
The weight of the empty mold was 5.06 lb.
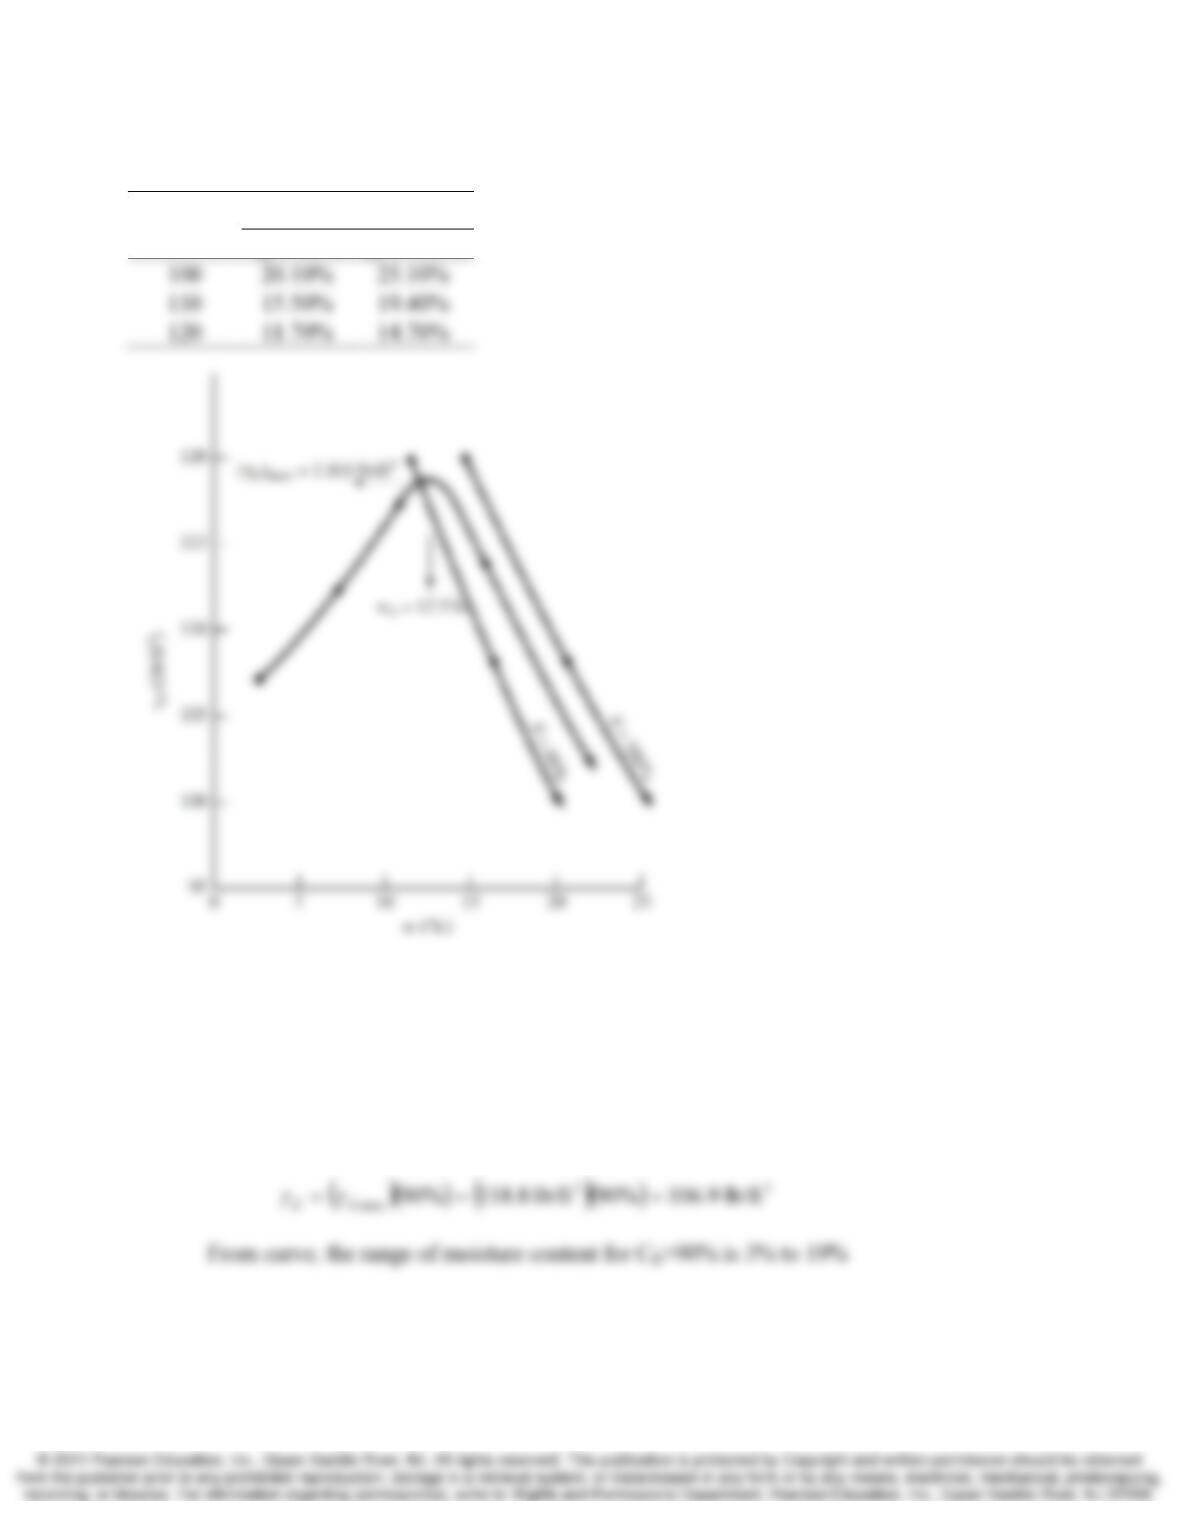
Plot the laboratory test results and the S = 80% and S = 100% curves, and then
draw the modified Proctor compaction curve. Determine the maximum dry unit weight
(lb/ft3) and the optimum moisture content, based on the modified Proctor test.
Assuming that the field compaction curve is the same as the compaction curve
obtained using the modified Proctor test, determine the range of as-compacted moisture
content required in the field to obtain a relative compaction of at least (a) 90%, and (b)
95%.
Solution
Proctor compaction results
Data Point No. 1 2 3 4 5
6-12 Excavation, Grading, and Compacted Fill Chap. 6
80% and 100% saturation curves
γd (lb/ft3)
w
@S=80% @S=100%
Results
3
max, lb/ft 118.8=
d
γ
12.5%=
o
w
a.