6-21
SLUSHER COMPANY
Comparative Income Statements
(Horizontal Analysis)
(1)
Year-to-Year
Increase (Decrease)
(2)
Base-Year-to-
Date
Increase
(Decrease)
For Years Ended December 31, 2010 to 2011 2009 to 2010 2009 to 2011
2011 2010 2009 Amount % Amount % Amount %
Sales (net)
$120,000
$100,000
$85,000
$20,000
20.0
$15,000
17.6
$35,000
41.2
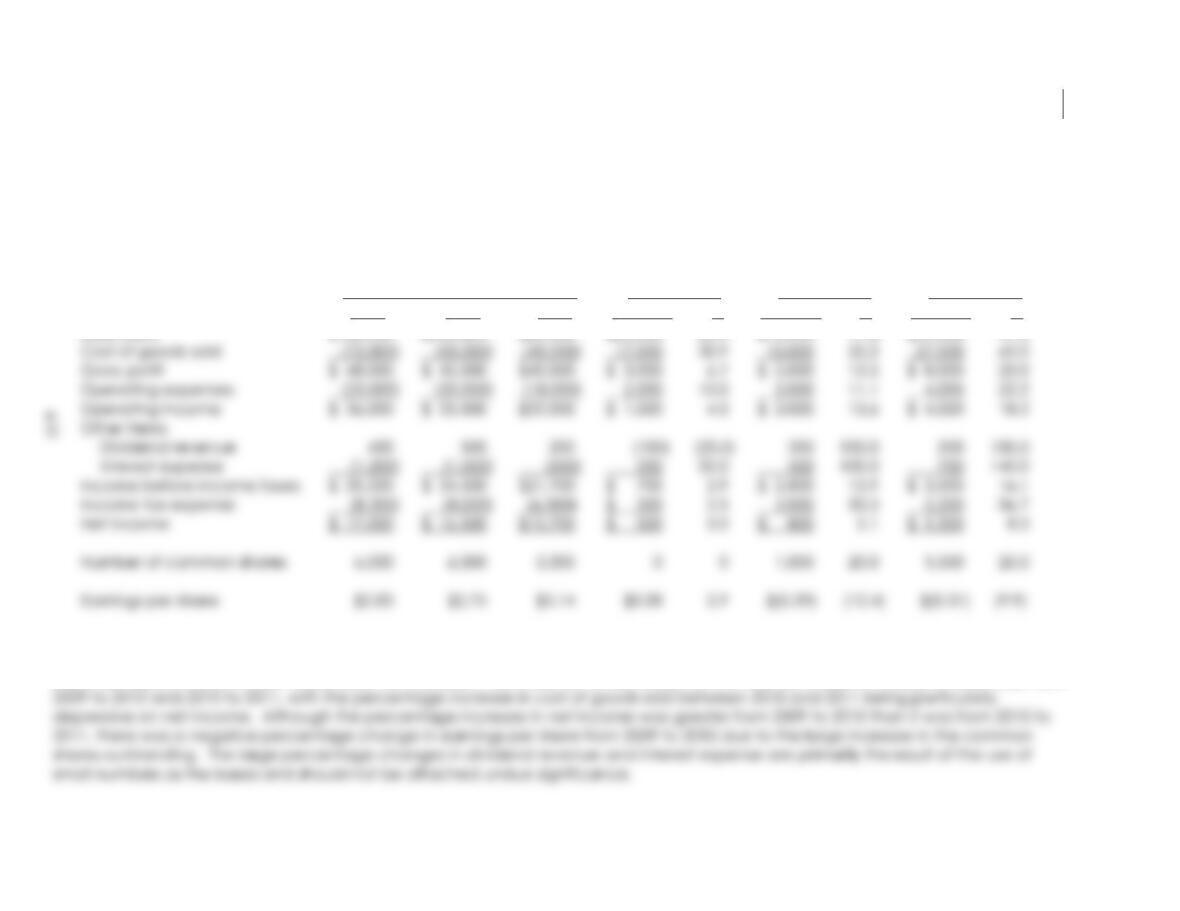
The analyses reveal that the company has experienced a significant percentage increase (41.2%) in sales over the 2-year period, but
that greater percentage increases in cost of goods sold (60.0%) and income taxes (36.7%) and a substantial increase in operating
expenses (22.2%) substantially moderated the increase in net income. Similar observations may be made on a year-to-year basis from
E6-9
E6-10 SAMUELS COMPANY
Comparative Income Statements
(Vertical Analysis)
For Years Ended December 31,
2011 2010
Amount % Amount %
Sales (net)
$100,000
100.0
$90,000
100.0
SAMUELS COMPANY
Comparative Balance Sheets
(Vertical Analysis)
December 31,
2011 2010
Amount % Amount %
Cash
Receivables (net)
$ 3,000
7,000
2.5
5.8
$ 2,000
8,000
2.0
8.0
*Rounded to balance
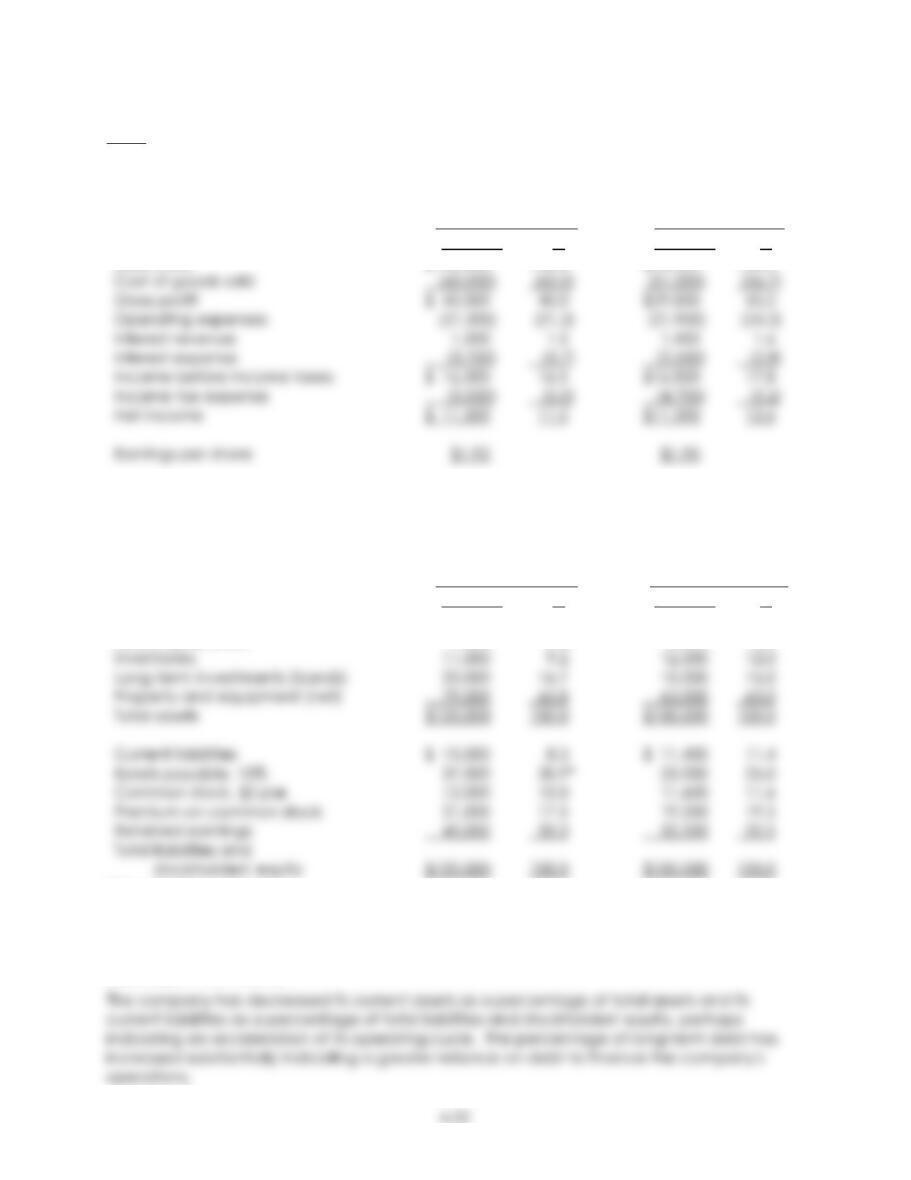
Cost of goods sold as a percentage of sales has increased from 2010 to 2011. This
unfavorable trend has been offset by a decrease in the percentage of operating expenses
to sales. The combination of these two changes accounts for most of the small percentage
decrease in net income.
6-23
1. Price/earnings ratio = times5.91
050$21,800/8,
$16
shareperEarnigns
priceMarket ==
4. Return on stockholders’ equity = 15.9%
$137,000
$21,800
2$143,200)/($138,800
$21,800
equityrs’stockholdeAverage
incomeNet ==
+
=
5. Current ratio = times1.7
$24,800
$42,200
$6,800$18,000
$19,300$14,700$8,200
sliabilitieCurrent
assetsCurrent ==
+
++
=
E6-11
6-23
3. Return on stockholders’ equity = 9.7%
2$246,000)/($250,000
$24,000
equityrs’stockholdeAverage
incomeNet =
+
=
4. Current ratio = times2.2
$40,000
$56,000$22,000$10,000
sliabilitieCurrent
assetsCurrent =
++
=
8. Book value per common share = $10,000
($110×500)–$55,000$45,000$50,000$100,000
sharescommongOutstandin
equityrs’stockholdeCommon +++
=

6-25
E6-13 (AICPA adapted solution)
I
II
III
1.
N
N
N

6-26
SOLUTIONS TO PROBLEMS
P6-1
1. FRAHM CORPORATION
Income Statement
For Year Ended December 31, 2010
Revenues
Sales (net) $600,000
Interest revenue 3,000
Total revenues $603,000
Expenses
Cost of goods sold $323,700
6-27
2. FRAHM CORPORATION
Working Paper for Segment Reporting
For Year Ended December 31, 2010
(not required)
All Operating Segments Segment Unallo-
B C Other Totals cated Totals
Total revenues (sales)
Operating expenses
Cost of goods sold
Sales salaries
$360,000
$198,000
27,000
$150,000
$ 78,000
12,000
$ 90,000
$ 47,700
8,000
$ 600,000
$ 323,700
47,000
$ 0
$ 0
0
$ 600,000
$ 323,700
47,000
FRAHM CORPORATION
Industry Segment Financial Results
For Year Ended December 31, 2010
Reportable Operating Segments
All
Other
Total
B C Segments Results
Segment revenues (sales)
$360,000
$150,000
$ 90,000
$ 600,000
6-28
P6-1 (continued)
3. Segment profit is total revenue less operating expenses. In computing
Note to Instructor: The $57,200 pretax income before extraordinary loss listed
in the operating segment financial results reconciles to the income before
extraordinary items ($40,040) plus the income tax expense ($17,160) listed on
the income statement.
4. Profit Margin Before Income Taxes = (Sales)RevenuesSegment
ProfitSegment
Division B: 15.0%
$360,000
$54,000 =
6-29
P6-2
1. REED COMPANY
Income Statement
For Year Ended December 31, 2010
Sales revenues (net) $200,000
Cost of goods sold (121,120)
6-30
2. REED COMPANY
Working Paper for Segment Reporting
For Year Ended December 31, 2010
(not required)
All Operating Segments Segment Unallo-
1 2 Remaining
Totals cated Totals
Total revenues (sales)
Operating expenses
expenses
Depreciation expense
$ 98,000
0
2,240
$ 60,000
0
1,680
$42,000
0
1,680
$200,000
0
5,600
$ 0
1,000
1,400
$200,000
1,000
7,000
REED COMPANY
Industry Segment Financial Results
For Year Ended December 31, 2010
Reportable Operating Segments
All
Other
Total
1 2 Segments Results
Segment revenues (sales)
$ 98,000
$60,000
$42,000
$200,000
6-31
P6-2 (continued)
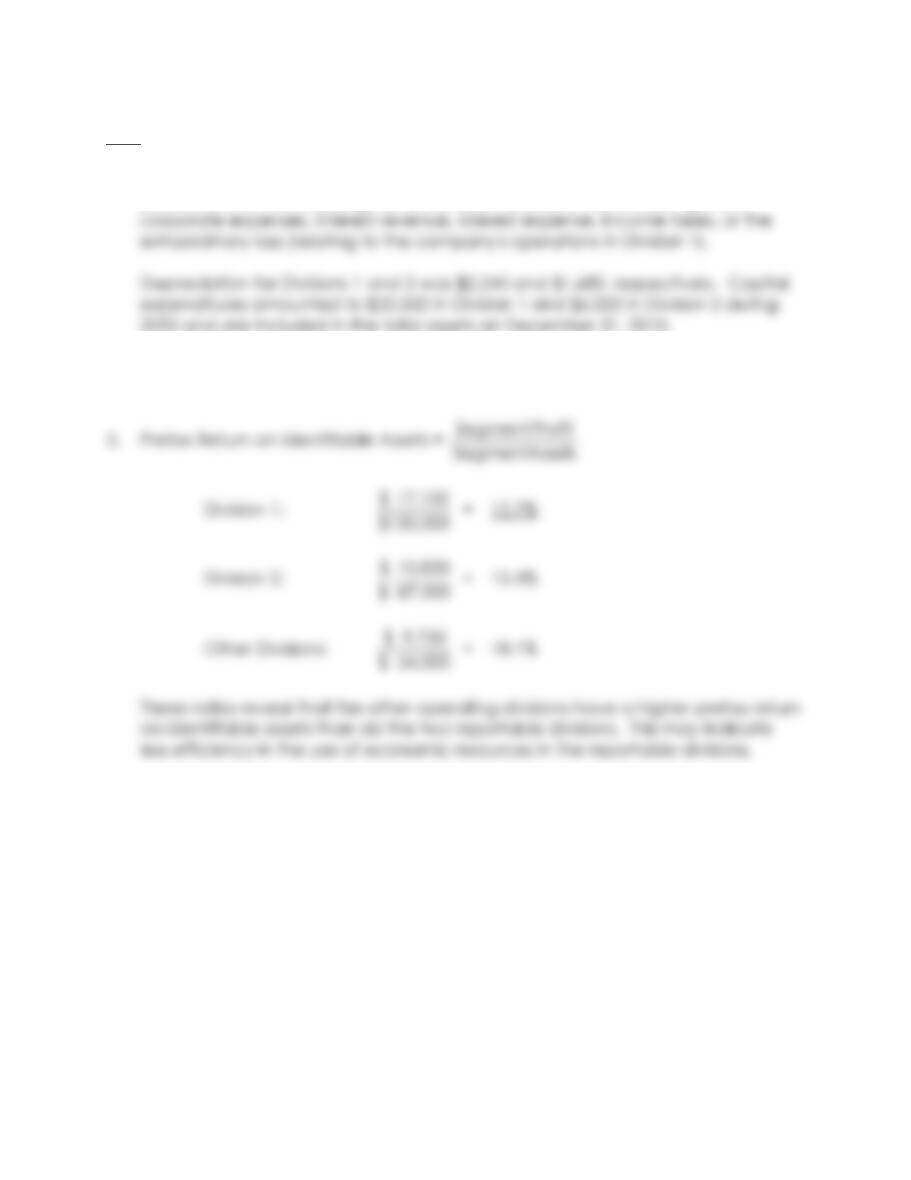
3. Segment profit is total revenue less operating expenses. In computing segment
profit, none of the following items has been added or deducted: general
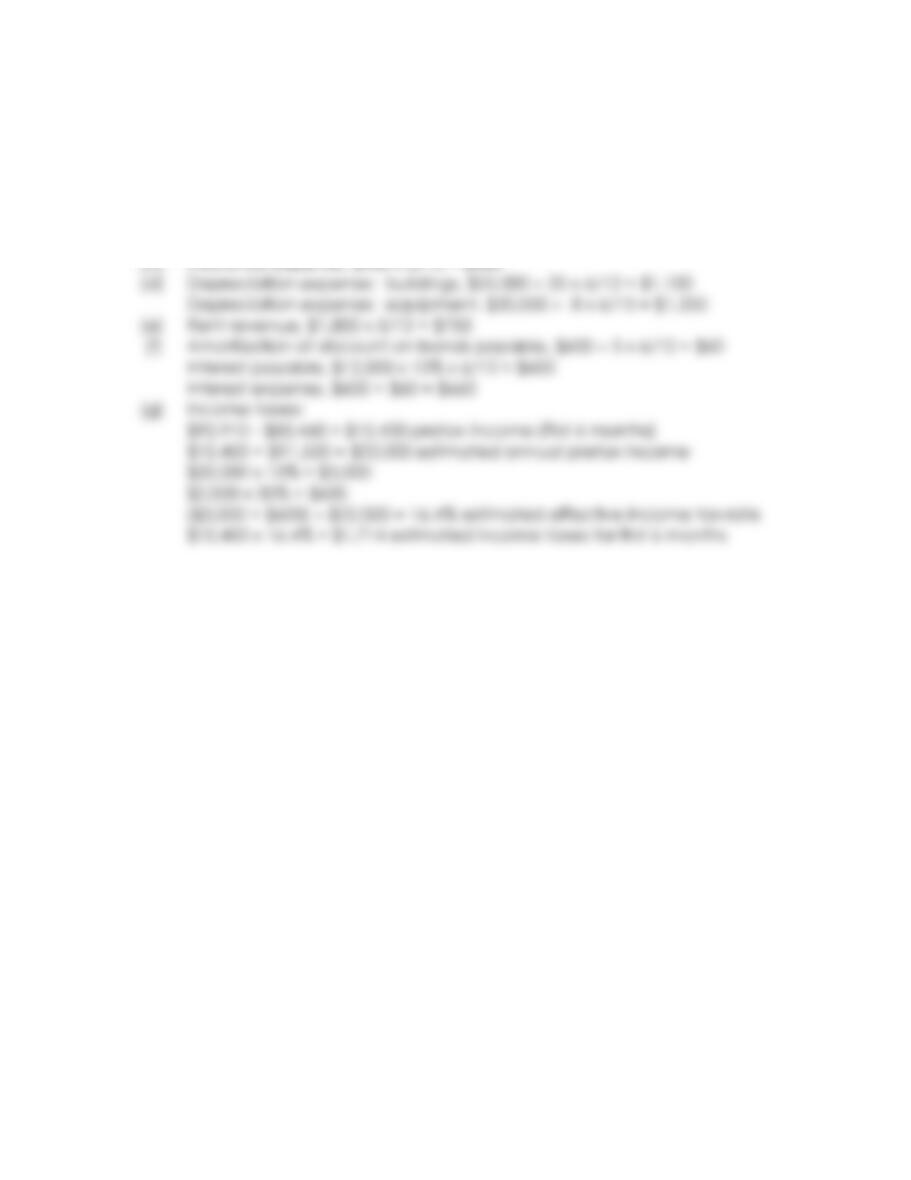
4. If Reed Company uses IFRS, it must also disclose each segment’s liabilities if this
information is regularly reported to the chief operating decision maker.
6-32
P6-3
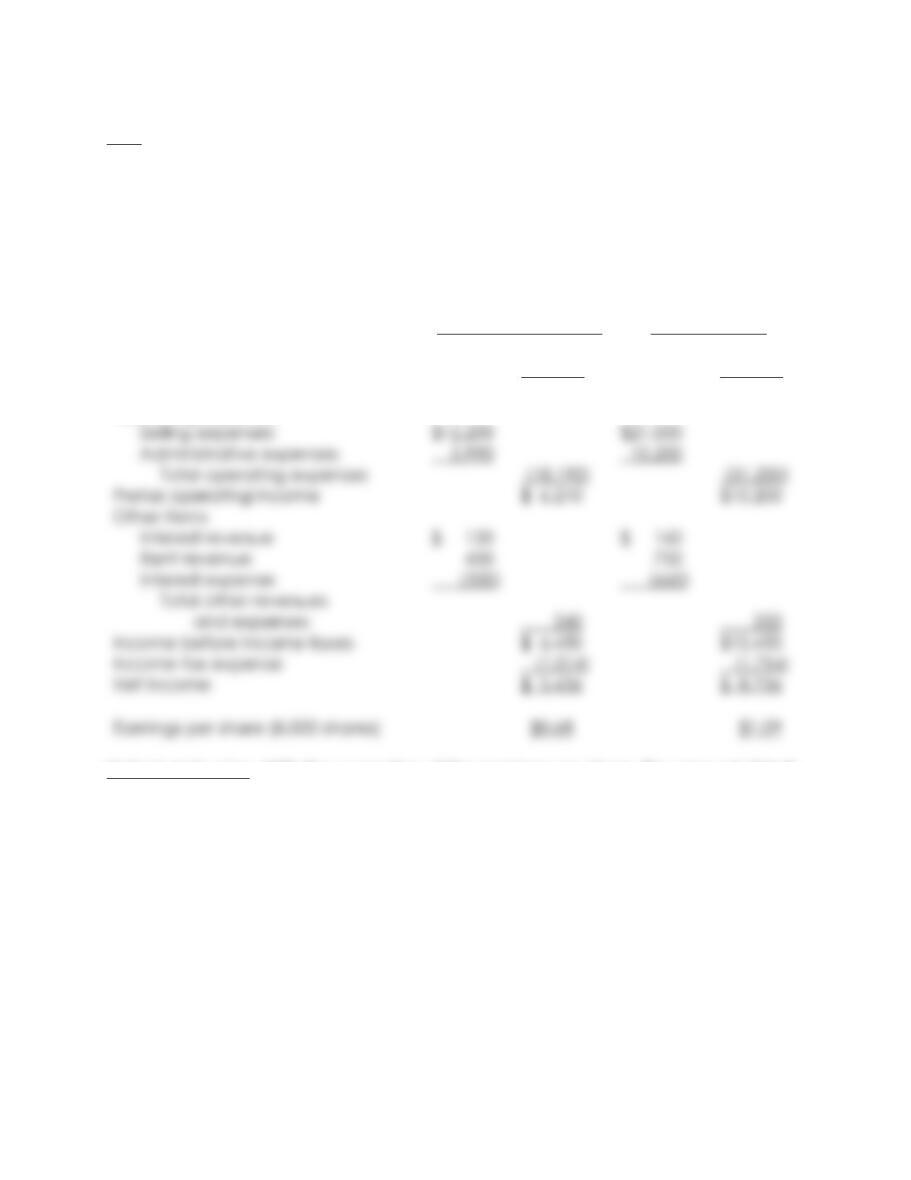
1. Worksheet on following page. Explanations are given below.
(a) Bad debts expense, $90,000 x 0.5% = $450
(b) Interest revenue, $4,000 x 12% x 4/12 = $160

6-33
E5-12
SCHULTZ COMPANY
Worksheet
For First 6 Months Ended June 30, 2010
Trial Balance
Adjustments
Income Statement
Retained
Earnings
Statement
Balance Sheet
Account Titles Debit Credit Debit Credit Debit Credit Debit Credit Debit Credit
Cash
Accounts receivable (net)
Note receivable (due 9/1/2010)
Discount on bonds payable
Common stock, $1 par
Premium on common stock
Retained earnings
Sales (net)
Cost of goods sold
7,200
10,300
4,000
600
48,600
8,000
34,580
26,400
90,000
(a) 450
(f) 60
48,600
90,000
26,400
7,200
9,850
4,000
540
8,000
34,580
6-33
P6-3 (continued)
1. (continued)
6-34
P6-3 (continued)
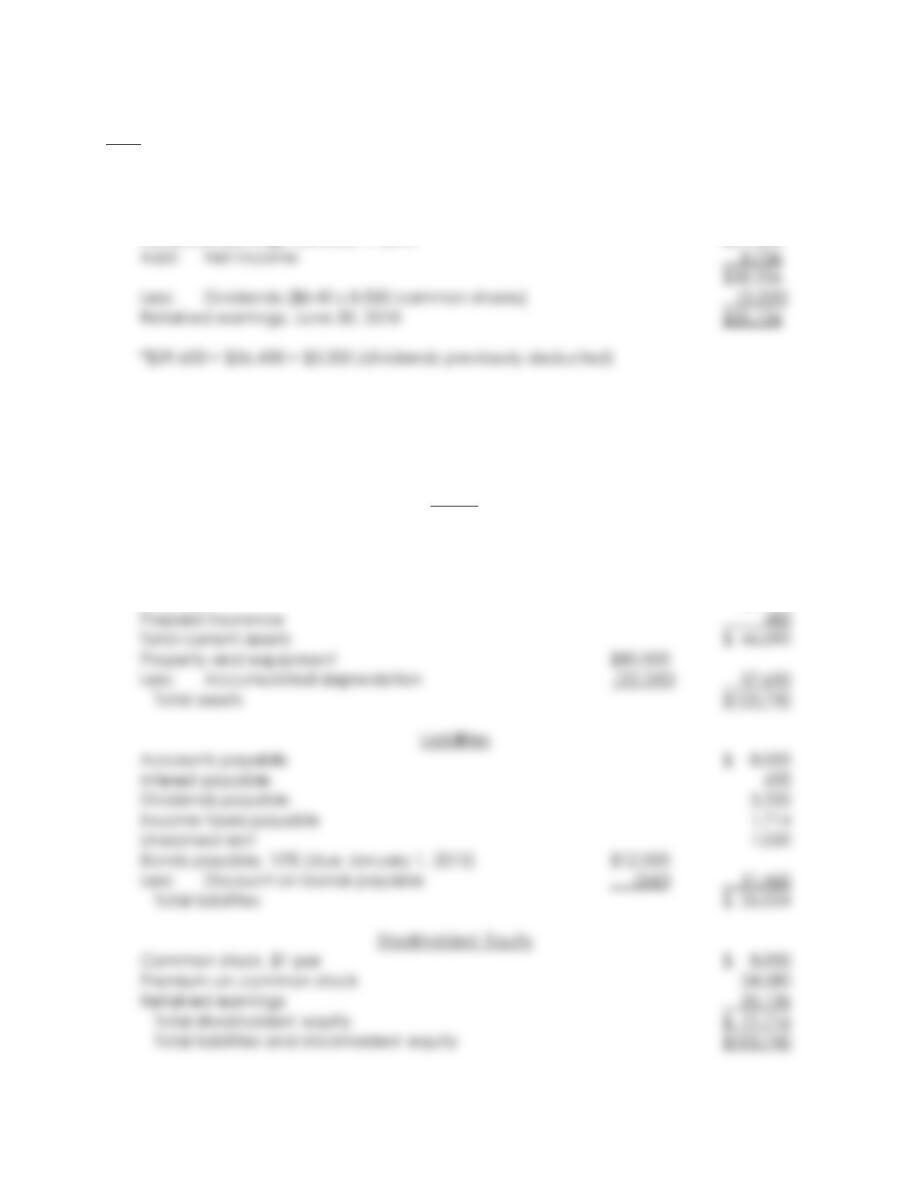
2. SCHULTZ COMPANY
Interim Income Statement
For April 1 through June 30, 2010,
and 6 Months Ended June 30, 2010
(a)
3 Months
4/1 Through 6/30/10
(b)
6 Months Ended
June 30, 2010
Sales (net)
Cost of goods sold
Gross profit
Operating expenses
$50,000
(25,600)
$24,400
$90,000
(48,600)
$41,400
Note to Instructor: With the exception of the earnings per share, the amounts listed
in the income statement for April 1 through June 30, 2010 are derived by deducting
the amounts listed in the first quarter income statement from the related amounts
listed in the 6 months income statement.
6-35
P6-3 (continued)
3. SCHULTZ COMPANY
Interim Statement of Retained Earnings
For First 6 Months Ended June 30, 2010
Retained earnings, January 1, 2010 $29,600*
4. SCHULTZ COMPANY
Interim Balance Sheet
June 30, 2010
Assets
Cash $ 7,200
Accounts receivable (net) 9,850
Note receivable (due September 1, 2010) 4,000
Interest receivable 160
Inventory 24,400

P6-4
Note to Instructor: Students must use the retail inventory method (average cost) of estimating inventory to solve
this problem. Many elementary accounting books discuss this method; it is also explained in Chapter 8.
SIKYTA COMPANY
Worksheet
For First 6 Months Ended June 30, 2010
Trial Balance
Adjustments
Income Statement
Retained Earnings
Statement
Balance Sheet
Account Titles Debit Credit Debit Credit Debit Credit Debit Credit Debit Credit
Cash
Accounts receivable
Premium on bonds payable
Common stock, $0.50 par
Additional paid-in capital
Retained earnings
Sales (net)
10,200
14,700
960
5,000
52,000
22,968
120,000
(f) 48
120,000
22,968
10,200
14,700
912
5,000
52,000
P6-4
6-37
P6-4 (continued)
1. (continued)
(a) Bad debts expense, $120,000 x 0.5% = $600
(b) Rent expense, $2,400 x 4/12 = $800
(c) Interest revenue, $5,000 x 14% x 3/12 = $175
6-38
P6-4 (continued)
2. SIKYTA COMPANY
Interim Income Statement
For April 1, Through June 30, 2010,
and 6 Months Ended June 30, 2010
(b)
3 Months
4/1 Through 6/30/10
(a)
6 months Ended
June 30, 2010
Sales (net)
Cost of goods sold
Gross profit
$58,000
(34,220)
$23,780
$120,000
(71,420)
$ 48,580
Note to Instructor: With the exception of the earnings per share, the amounts listed
in the income statement for April 1 through June 30, 2010 are derived by deducting
the amounts listed in the first-quarter income statement from the related amounts
listed in the 6-month income statement.
3. SIKYTA COMPANY
Interim Statement of Retained Earnings
For First 6 Months Ended June 30, 2010
Retained earnings, January 1, 2010 $25,968*
Add: Net income 14,763
6-39
P6-4 (continued)
4. SIKYTA COMPANY
Interim Balance Sheet
June 30, 2010
Assets
Cash $ 10,200
Accounts receivable $14,700
Less: Allowance for doubtful accounts (1,000) 13,700
Liabilities
Accounts payable $ 9,100
Dividends payable 3,000
Interest payable 1,695
6-40
P6-5 (AICPA adapted solution)
1. When publicly traded companies report summarized interim financial
information to their security holders at interim dates, the following data should
be reported, as a minimum:
Sales or gross revenues, provision for income taxes, extraordinary items, and net
earnings
Significant changes in financial position
When summarized interim financial data are regularly reported on a quarterly
basis, the foregoing information with respect to the current quarter and the
2. There are two general weaknesses in the form and content of presentation of
the first-quarter information: (a) some information in the statement needs