6-1
CHAPTER 6
ADDITIONAL ASPECTS OF FINANCIAL REPORTING
AND FINANCIAL ANALYSIS
CONTENT ANALYSIS OF EXERCISES AND PROBLEMS
Number
Content
Time Range
(minutes)
E6-1
Segment Reporting. (Easy) Schedule showing segment
revenues, profit, and assets.
10-15
E6-5
Interim Reporting. (Moderate) First quarter income statement,
balance sheet. Perpetual inventory system. Trial balance,
additional information given.
15-20
E6-9
(Appendix). Horizontal Analyses. (Easy) Of comparative
income statements, balance sheets. Year-to-year and base–
year-to-date approaches.
15-20
6-2
Number
Content
Time Range
(minutes)
E6-12
(Appendix). Ratios. (Moderate) Earnings per share, dividend
yield, return on stockholders‘ equity, current, acid-test,
receivables turnover, times interest earned, book value per
common share.
15-20
P6-2
Income Statement and Segment Reporting. (Moderate)
Multiple-step income statement. Allocation of revenues,
expenses, assets to segments. Schedule. Related notes.
Compute return on identifiable assets (Appendix). IFRS
disclosures.
50-80
P6-6
(AICPA adapted). Financial Statement Presentation and Ratios.
(Challenging) Identification of appropriate and inappropriate
disclosures. Justification. Description of ratio significance.
Ratio computations.
20-40
P6-7
(AICPA adapted). Multiple-Step Income Statement.
(Challenging) Preparation of income statement, including
extraordinary item and deferred taxes. Reconciliation of net
income and taxable income.
45-60
6-3
Number
Content
Time Range
(minutes)
P6-10
(Appendix). Vertical Analysis and Ratios. (Moderate) Current,
acid-test, inventory turnover, receivables turnover, payables
turnover, return on total assets, return on stockholders’ equity,
debt, times interest earned.
60-75
P6-12
(Appendix). Ratio Analysis. (Moderate) Dividend yield,
price/earnings, profit margin, return on total assets, return on
30-45
ANSWERS TO QUESTIONS
Q6-1 The efficient capital markets hypothesis research tends to show that (1) the prices of
securities traded in the capital markets fully reflect all publicly available information,
Q6-2 In an audit report, the two opinions that an auditor expresses are:
1. That the company’s financial statements present fairly the financial position of the
Q6-3 An audit committee is a group that has oversight over the financial reporting process
of a company. Generally, the duties of an audit committee are to oversee the
Q6-4 Investors and creditors desire operating segment information about a company in
order to evaluate both risk and return in their investment and credit decisions. Risk
involves uncertainty or unpredictability that results from the way that the company is
Q6-5 An operating segment is considered a reportable segment if it satisfies one of three
tests. The three tests are the revenue test, operating profit test, and asset test.
1. Revenue test. Its reported revenues (including sales to external customers and
intersegment sales) are 10% or more of the combined revenues of all the
Q6-6 1. Information about profit (or loss). A company must report its profit (or loss) for
each reportable segment. It must also disclose certain amounts used to
2. Information about assets. A company must report the total assets of each
Q6-7 A company must disclose (a) its revenue from external customers for each product
and service, and (b) information about geographic areas including (1) revenues from
Q6-8 Interim financial statements are financial reports for periods of less than one year
Q6-9 In regard to the reporting of its inventories in interim reports, a company using an
estimation technique must report the method used and any significant adjustments
resulting from the reconciliation with the annual physical inventory. A company that
Q6-10 A company matches its expenses not directly associated with product sales during
an interim period against its revenues using a variety of bases. In this regard,
Q6-11 (a) The accounting procedures that a company uses to prepare its interim reports
are similar to those for its annual reports in that a year-to-date trial balance is taken,
Q6-12 The minimum interim report disclosures include:
1. Sales or gross revenues, income taxes, extraordinary items (net of tax), and net
income
Q6-13 The Chief Accountant of the SEC helps in the establishment of administrative policies
regarding accounting matters, is directly responsible for Regulation S-X, and is
Q6-13 (continued)
The Division of Corporation Finance of the SEC is responsible for the establishment of
Q6-14 The two SEC reports that are important to accountants are:
Q6-16 External users may make comparisons of a company’s current financial performance
and financial position with its financial performance and position during previous
accounting periods. These are referred to as intracompany comparisons. External
Q6-17 In horizontal analysis, a company shows the changes in its operating results and
financial position over time in percentages as well as in dollars. When a 2-year
comparison is made, the earlier year is used as the base year and the amount of
Q6-18 In vertical analysis, percentages are developed that show the monetary relationships
between items on the financial statements of a company for a particular period.
6-7
Q6-19 Ratio analysis is a form of percentage analysis in which one or more items on a
company’s financial statements are divided by another related item or items. The
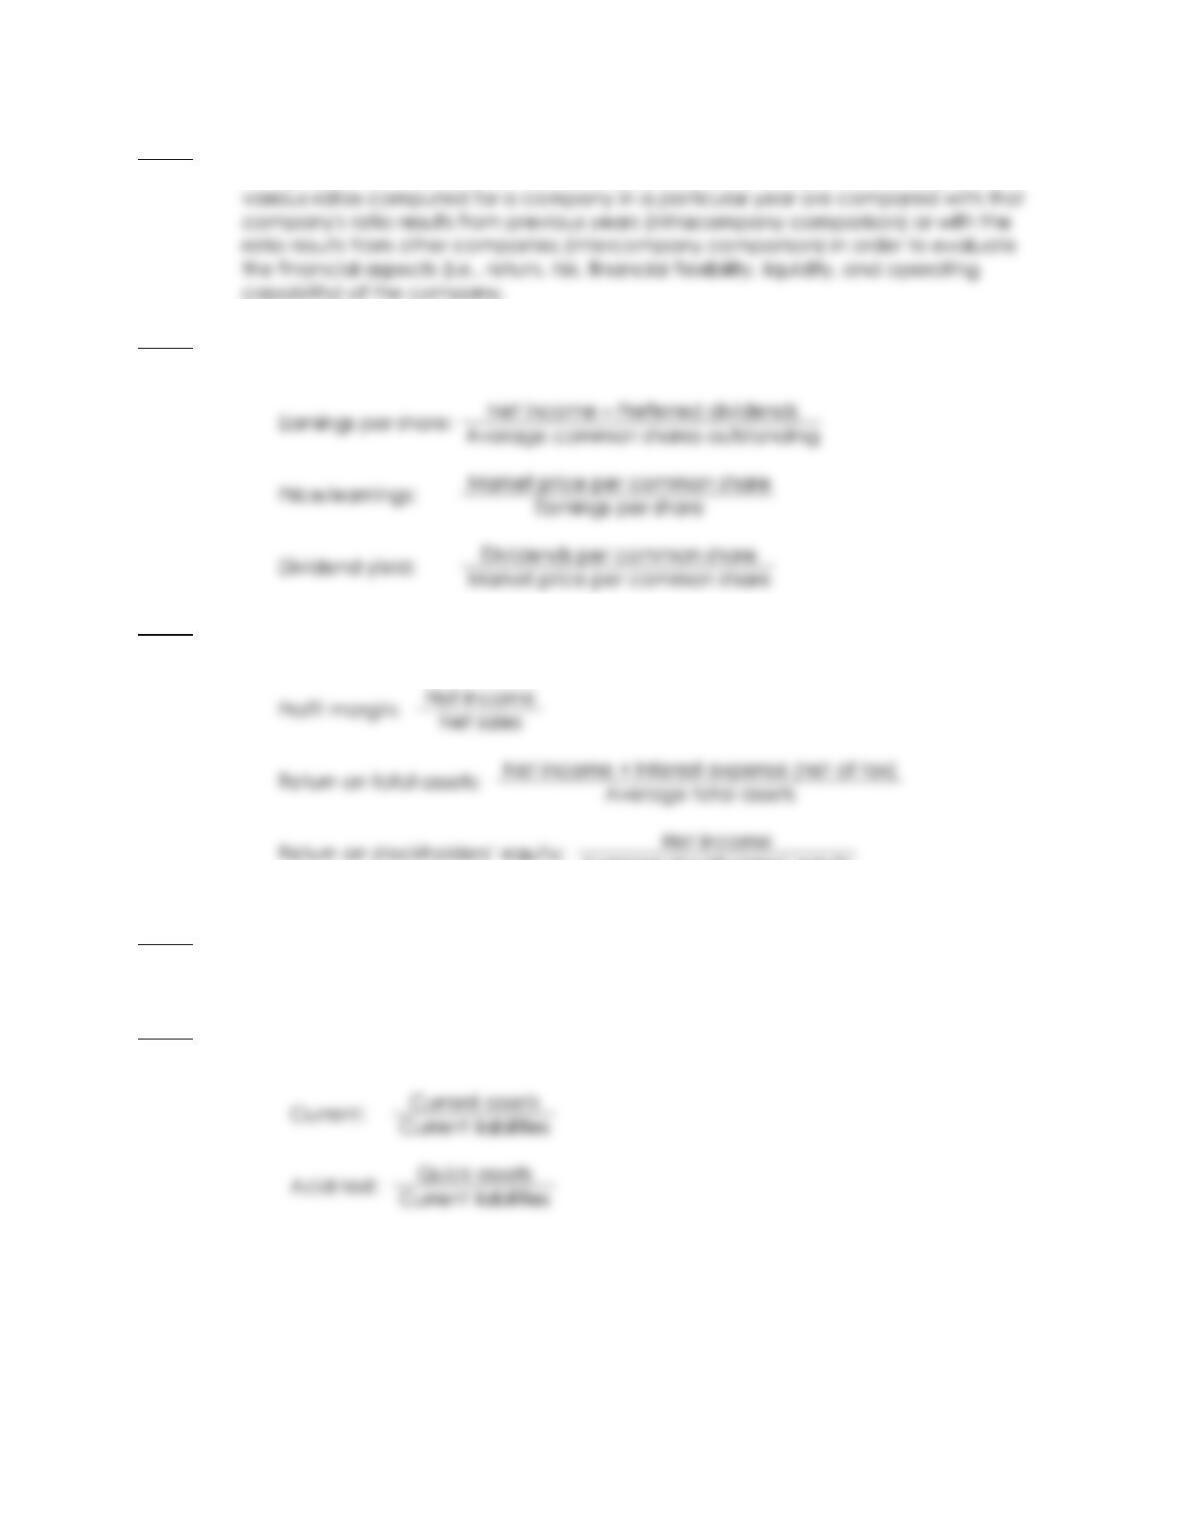
Q6-20 The stockholder profitability ratios are the earnings per share, price/earnings, and
dividend yield. They are computed as follows:
Q6-21 The company profitability ratios are the profit margin, return on total assets, and
return on stockholders’ equity. They are computed as follows:
Q6-22 The ratios that may be applied in regard to a company’s reportable operating
segments include the profit margin, return on total assets, and return on stockholders’
equity.
Q6-23 The liquidity ratios include the current ratio and acid-test ratio. They are computed
as follows:
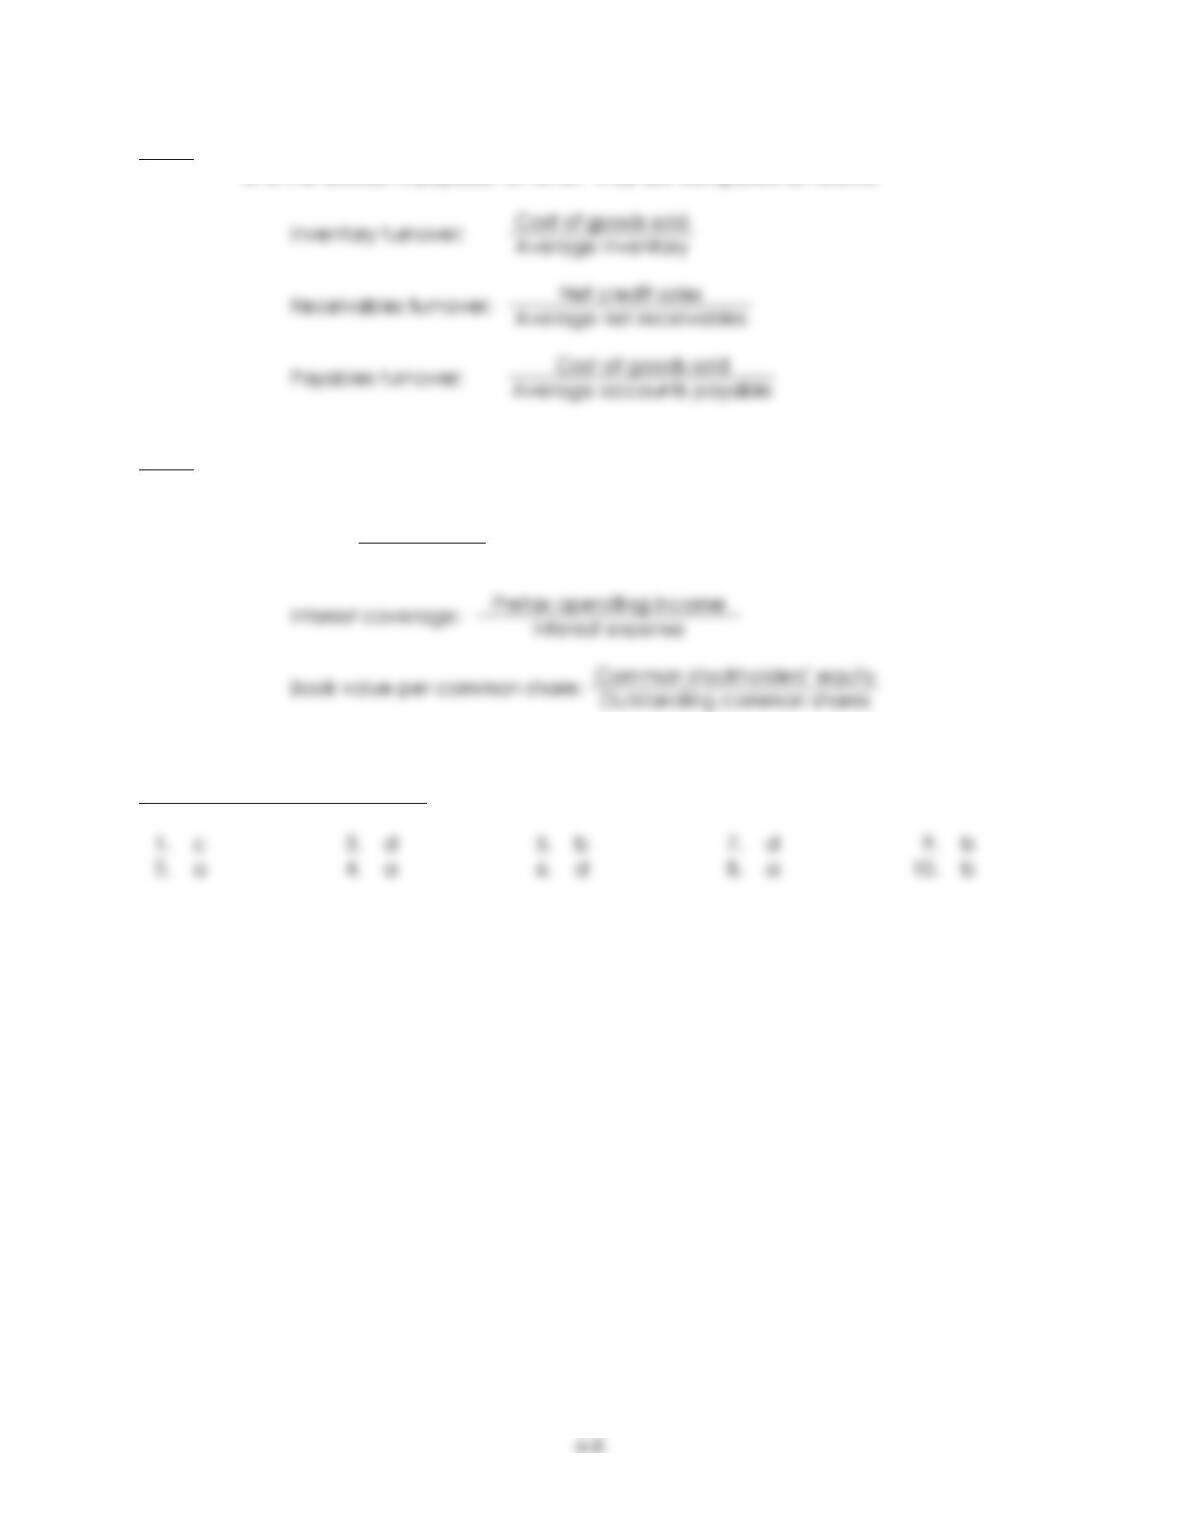
Q6-24 The activity ratios include the inventory turnover, the accounts receivable turnover,
and the accounts payable turnover. They are computed as follows:
Q6-25 The stability ratios include the debt ratio, times interest earned, and book value per
common share. They are computed as follows:
Total liabilities
Debt: Total assets
ANSWERS TO MULTIPLE CHOICE
SOLUTIONS TO REVIEW EXERCISES
RE6-1
RE6-2
RE6-3
Division C is not a reportable segment because it does not pass any of the three
RE6-4
Reportable All
Operating Other Total
Segment L
Segments Results
RE6-5
st Qtr
6-10
RE6-6
GOMEZ COMPANY
Income Statement (Vertical Analysis)
For Current Year
Amount %
Sales $100,000 100.0
RE6-7
HOLDEN COMPANY
Income Statement (Vertical Analysis)
For Current Year
Amount %
Current assets $12,000 12.5
RE6-8
RE6-9
RE6-10
Cost of Goods Sold
$87,000*
Inventory Turnover = Average Inventory
=
$12,500
= 6.96 times or 52 days
RE6-11
Total Liabilities
$41,700
Debt ratio = Total Assets
=
$119,000
= 35%
6-12
SOLUTIONS TO EXERCISES
E6-1
YORK DRUG COMPANY
Industry Segment Financial Results
For Year Ended December 31, 2010
Reportable Operating Segments
All
Other
Total
A B Segments Results
Segment revenues (sales) $52,000 $26,000 $12,000 $ 90,000
E6-2
WILSON DIVERSIFIED COMPANY
Industry Segment Financial Results
For Year Ended December 31, 2010
Reportable Operating Segments
All
Other
Total
1 2 Segments Results
Segment revenues (sales) $51,700 $24,400 $13,900 $ 90,000
E6-3
PARKS CONGLOMERATE COMPANY
Working Paper for Segment Reporting
For Year Ended December 31, 2010
(not required)
All Operating Segments Segment
A B Other Totals Unallocated Totals
Total revenues (sales)
$120,000
$138,000
$42,000
$300,000
$ 0
$300,000
PARKS CONGLOMERATE COMPANY
Industry Segment Financial Results
For Year Ended December 31, 2010
Reportable Operating
Segments
All
Other
Total
A B Segments Results
Segment revenues (sales)
$120,000
$138,000
$42,000
$300,000
E6-4
1. Determination of reportable segments (see the working paper that follows).
a. Revenue test. Since the sales of Segment 4 ($63,900) are more than 10%
($100,000 x 0.10 = $10,000) of the sales for all industry segments, Segment 4 is
considered to be a reportable segment.
Based on the above tests, Segments 1, 4, and 5 are the reportable segments and
Segments 2 and 3 should be combined for reporting purposes.
STRAUB DIVERSIFIED COMPANY
Working Paper for Segment Reporting
For Year Ended December 31, 2010
(not required)
All Operating Segments Segment
1 2 3 4 5 Totals
Total revenues
(sales)
$ 9,200
$ 8,800
$ 9,000
$63,900c
$ 9,100
$100,000
6-15
E6-4 (continued)
2. STRAUB DIVERSIFIED COMPANY
Industry Segment Financial Results
For Year Ended December 31, 2010
Reportable Operating
Segments
All Other
Total
1 4 5 Segments Results
Segment revenues (sales)
$ 9,200
$63,900
$ 9,100
$17,800
$100,000
3. If Straub Diversified Company uses IFRS, it must also disclose each segment’s liabilities if this
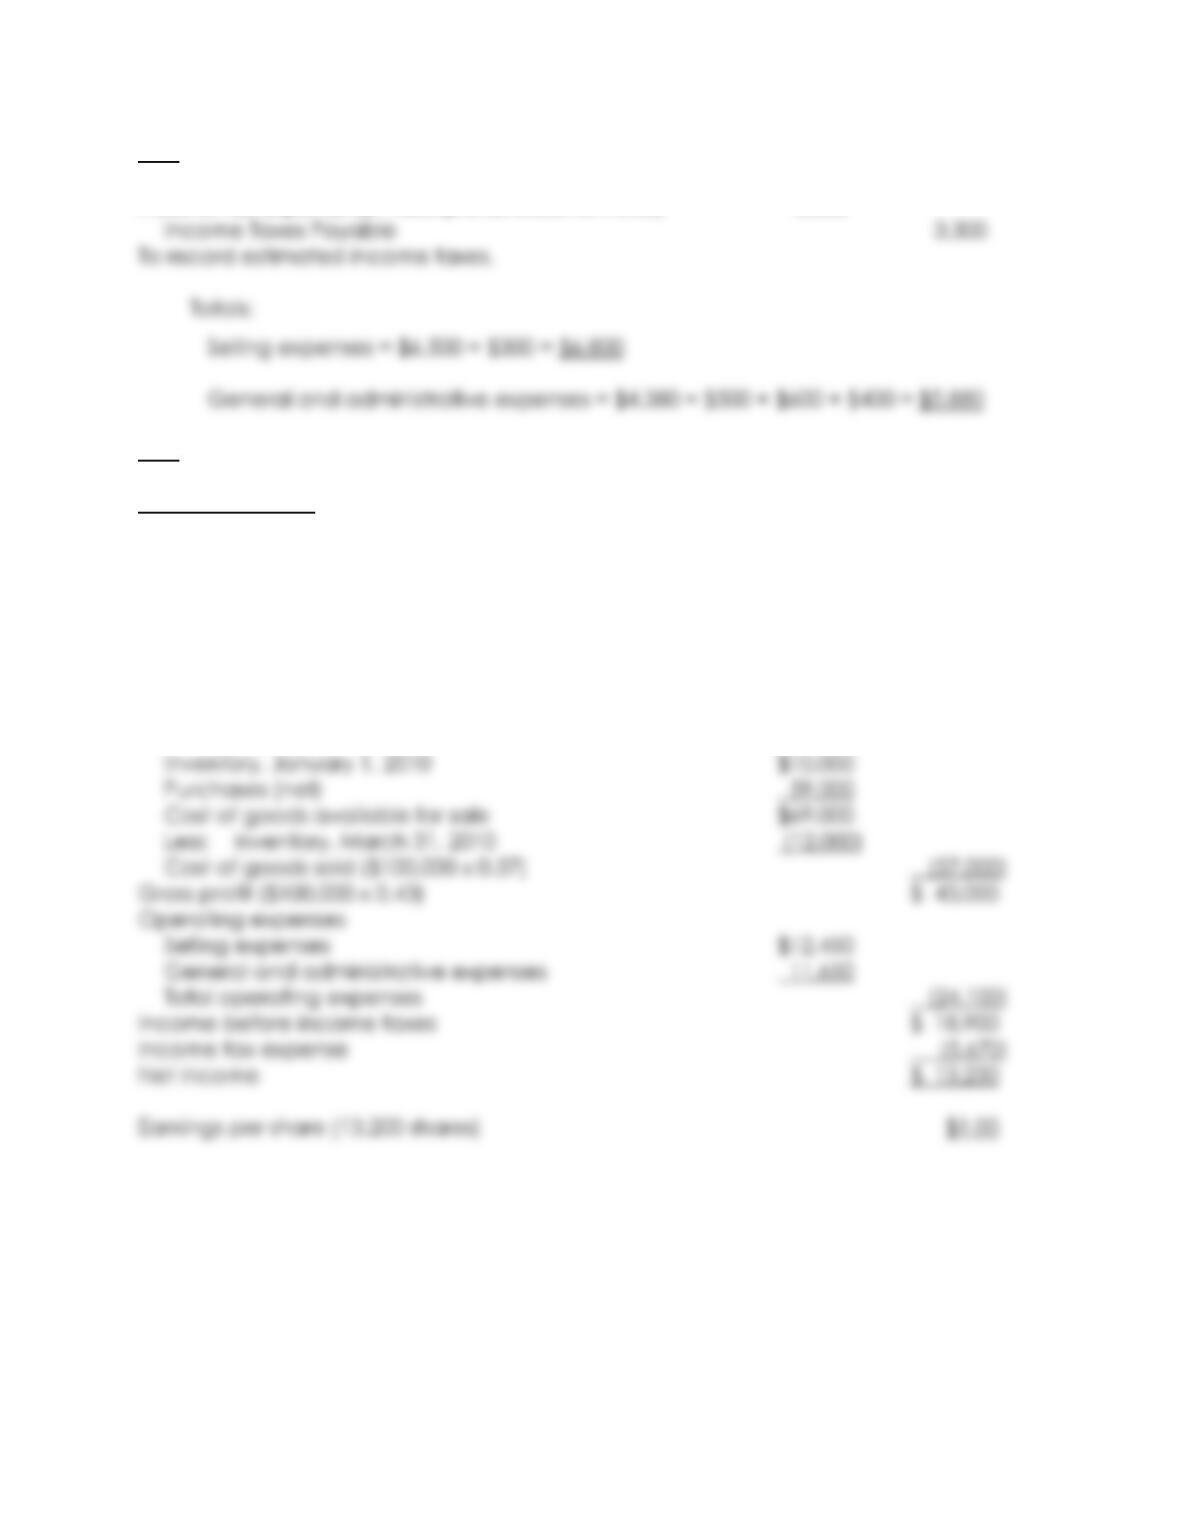
E6-5
JERSEY COMPANY
Interim Income Statement
For Quarter Ended March 31, 2010
Sales (net) $50,000
Cost of goods sold (26,500)
E6-5 (continued)
JERSEY COMPANY
Interim Balance Sheet
March 31, 2010
Assets
Cash $ 900
Accounts receivable (net) 3,500
Liabilities and Stockholders’ Equity
Accounts payable $ 9,100
Note to Instructor: The following adjustments have been made to the Selling Expenses
and General and Administrative Expenses control accounts as well as to certain other
General and Administrative Expenses
($4,800 x ⅓ x 1/4) 400
Prepaid Insurance 400
To record expired insurance.
6-17
E6-5 (continued)
Income Tax Expense ($11,000 pretax income x 0.30) 3,300
E6-6
Note to Instructor: Students must use the gross profit method of estimating inventory to
solve this exercise. Most elementary accounting books discuss this method; it is also
explained in Chapter 9.
HOWARD CORPORATION
Interim Income Statement
For Quarter Ended March 31, 2010
Sales $100,000
Cost of goods sold
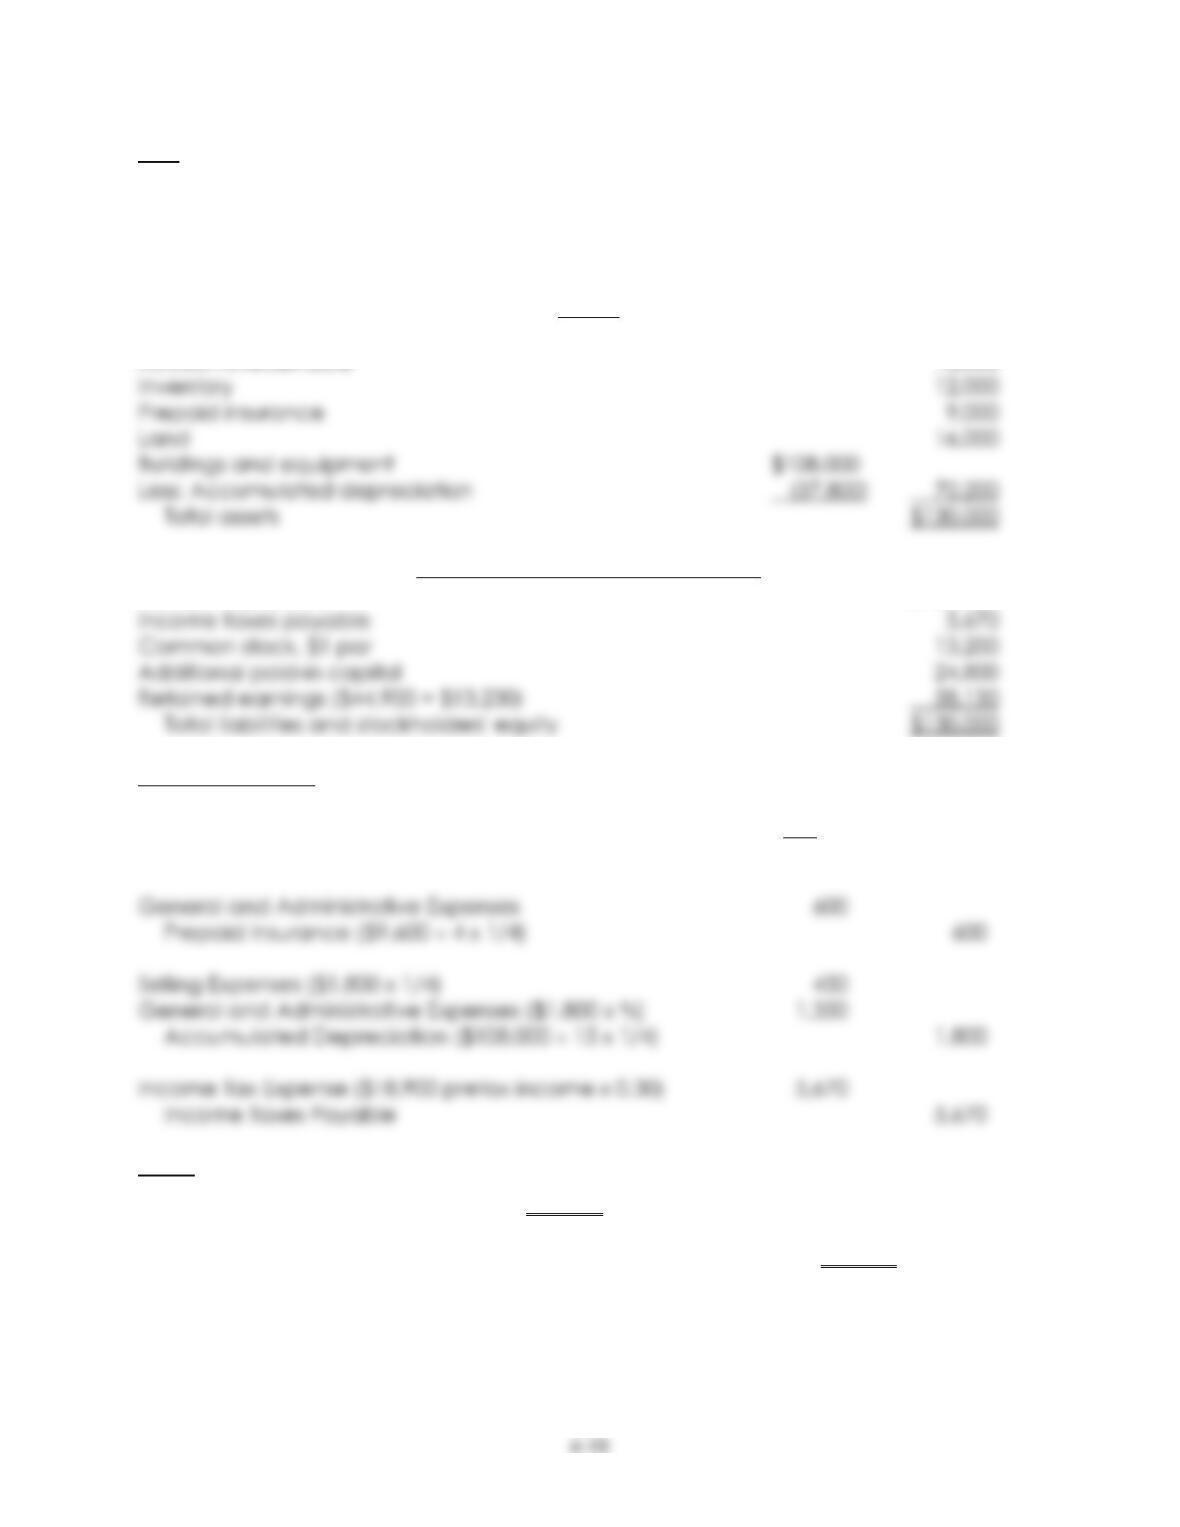
E6-6 (continued)
HOWARD CORPORATION
Interim Balance Sheet
March 31, 2010
Assets
Cash $ 9,800
Accounts receivable 13,000
Liabilities and Stockholders’ Equity
Accounts payable $ 28,200
Note to Instructor: The following adjustments have been made to the Selling Expenses
and General and Administrative Expenses control accounts as well as to certain other
income statement and balance sheet accounts. These would not be recorded in the
general journal, but are shown in journal entry form for illustrative purposes.
Totals:
Selling expenses = $12,000 + $450 = $12,450
General and administrative expenses = $9,700 + $600 + $1,350 = $11,650
6-19
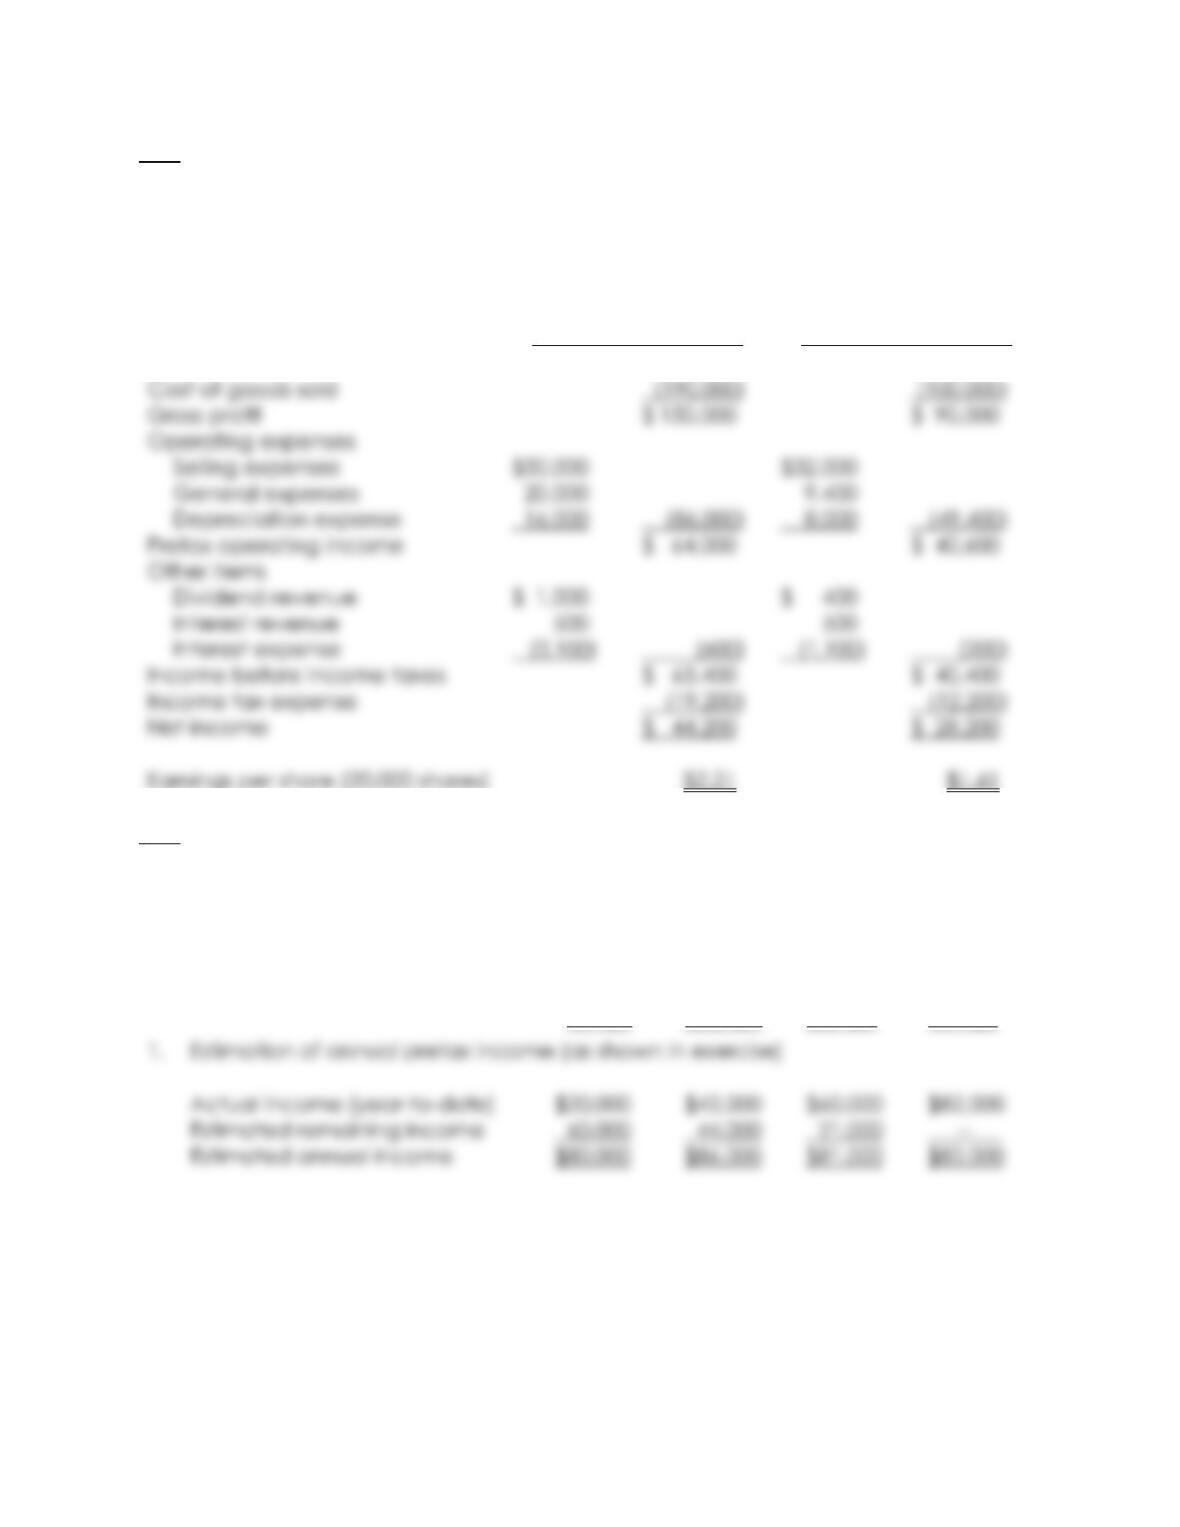
E6-7
HILL COMPANY
Interim Income Statement
(1)
For 6-Month Period
Ended June 30, 2010
(2)
For Second Quarter
Ended June 30, 2010
Sales (net)
$ 340,000
$190,000
E6-8
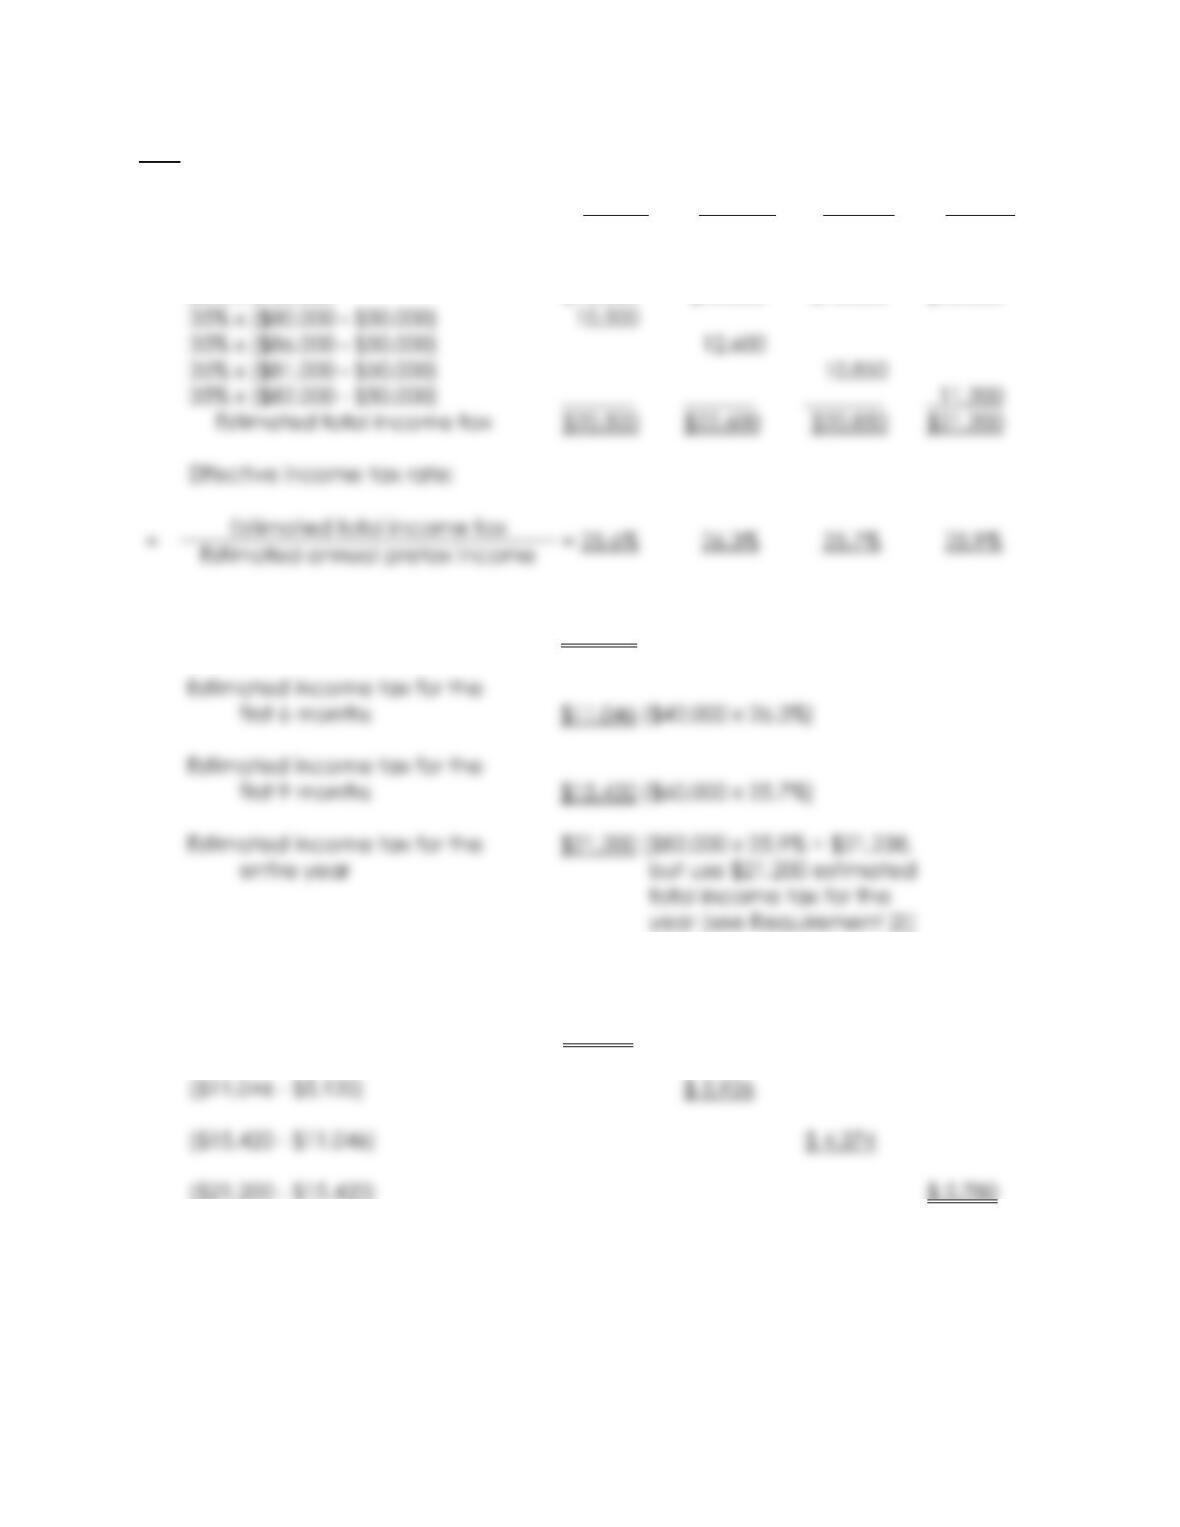
FARRIS COMPANY
Schedule of Computed Income Tax Expense
For Quarters Ended March 31, June 30,
September 30, and December 31
1st Qtr 2nd Qtr 3rd Qtr 4th Qtr
6-20
E6-8 (continued)
1st Qtr 2nd Qtr 3rd Qtr 4th Qtr
2. Estimated effective income tax rate
20% x $ 50,000
$10,000
$10,000
$10,000
$10,000
3. Estimated income tax for the
first quarter
$ 5,120 ($20,000 x 25.6%)
4. Estimated income tax expense for each quarter:
($5,120 – $0)
$ 5,120