Problem 6-23 (continued)
4. The following points should be brought to the attention of management:
a. Sales in Southern Europe are much lower than in the other two
territories. This is not due to lack of salespeople—salaries in Southern
Europe are about the same as in Middle Europe, which has the
highest sales of the three territories.
Problem 6-24 (30 minutes)
1. Because of soft demand for the Australian Division’s product, the
inventory should be drawn down to the minimum level of 1,500 units.
Drawing inventory down to the minimum level would require production
as follows during the last quarter:
Desired inventory, December 31 …………
1,500 units
Expected sales, last quarter ………………
18,000 units
Total needs ……………………………………
19,500 units
Less inventory, September 30 …………….
12,000 units
Required production ………………………..
7,500 units
2. To maximize the Australian Division’s operating income, Mr. Constantinos
could produce as many units as storage facilities will allow. By building
inventory to the maximum level, Mr. Constantinos will be able to defer a
portion of the year’s fixed manufacturing overhead costs to future years
Desired inventory, December 31 …………
Expected sales, last quarter ………………
Total needs ……………………………………
Less inventory, September 30 …………….
Required production ………………………..
Problem 6-24 (continued)
3. By setting a production schedule that will maximize his division’s net
operating income—and maximize his own bonus—Mr. Constantinos will
be acting against the best interests of the company as a whole. The
extra units aren’t needed and will be expensive to carry in inventory.
Problem 6-25 (75 minutes)
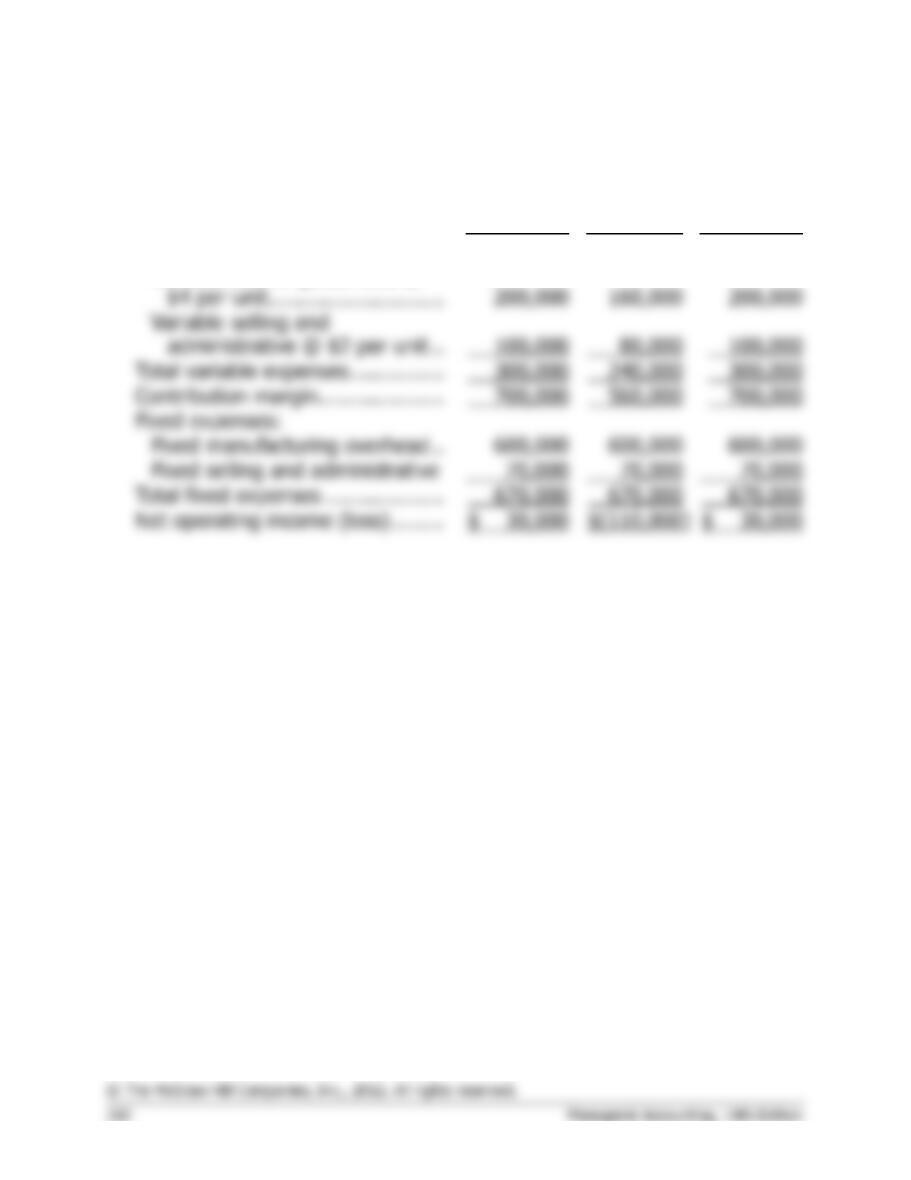
1.
Year 1
Year 2
Year 3
Unit sales ……………………………..
50,000
40,000
50,000
Sales …………………………………..
$1,000,000
$ 800,000
$1,000,000
Variable expenses:
Total variable expenses ……………
Contribution margin ………………..
Fixed expenses:
70,000
Total fixed expenses ……………….
Net operating income (loss) ……..
Variable cost of goods sold @
2.
a.
Year 1
Year 2
Year 3
Variable manufacturing cost ………….
$ 4
$ 4
$ 4
Fixed manufacturing cost:
$600,000 ÷ 50,000 units ……………
12
$600,000 ÷ 60,000 units ……………
10
$600,000 ÷ 40,000 units ……………
15
Absorption costing unit product cost .
$16
$14
$19
unit) ……………………………………..
200,000
(200,000)
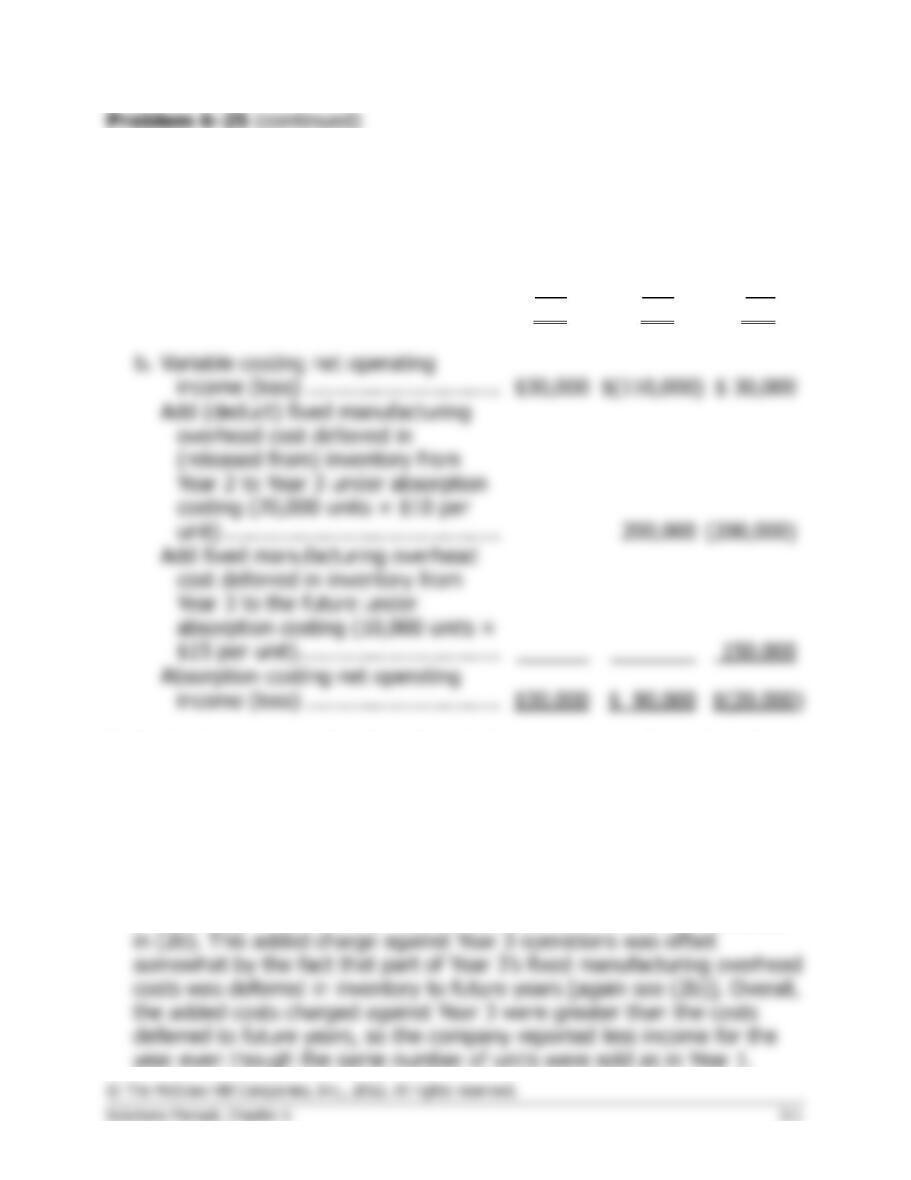
3. Production went up sharply in Year 2 thereby reducing the unit product
cost, as shown in (2a). This reduction in cost, combined with the large
amount of fixed manufacturing overhead cost deferred in inventory for
the year, more than offset the loss of revenue. The net result is that the
company’s net operating income increased.
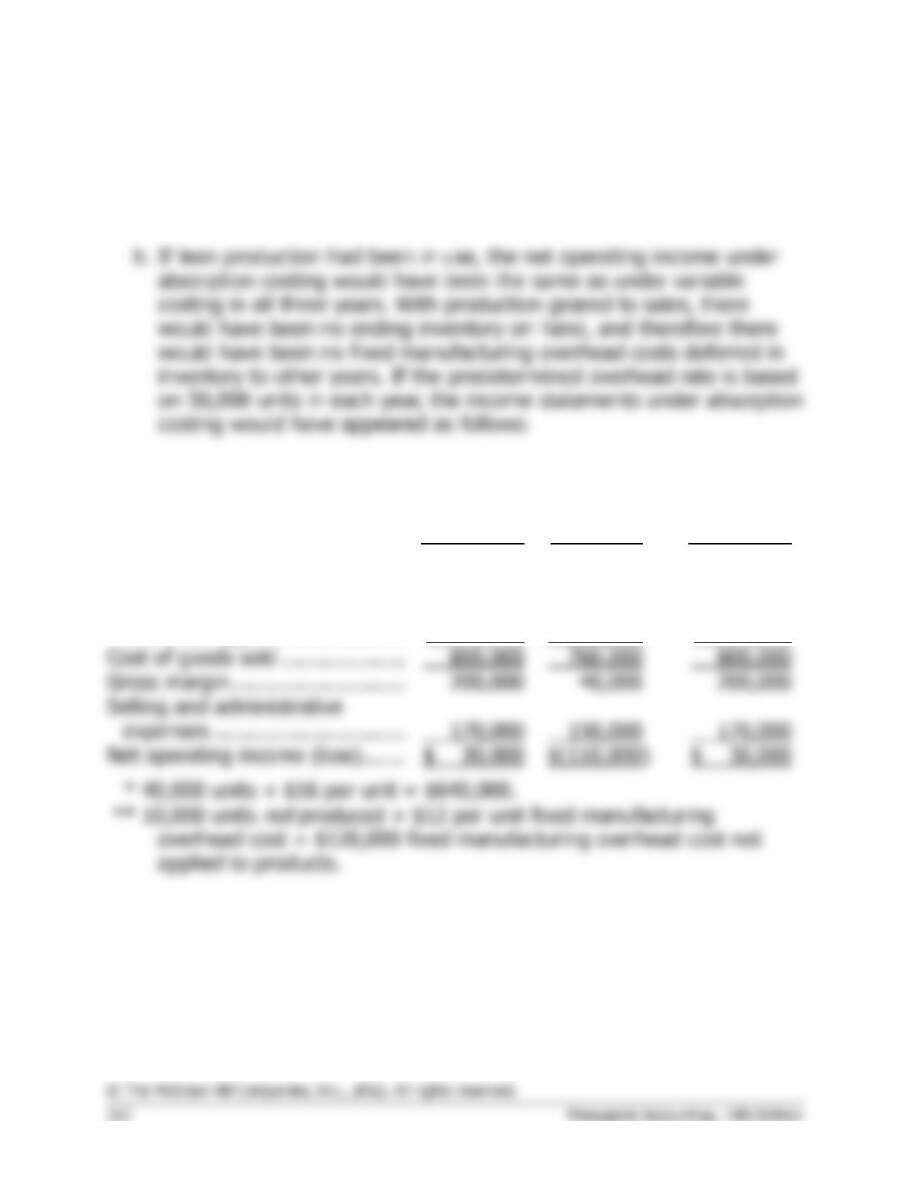
4. The fixed manufacturing overhead cost deferred in inventory from Year
2 was charged against Year 3 operations, as shown in the reconciliation
Problem 6-25 (continued)
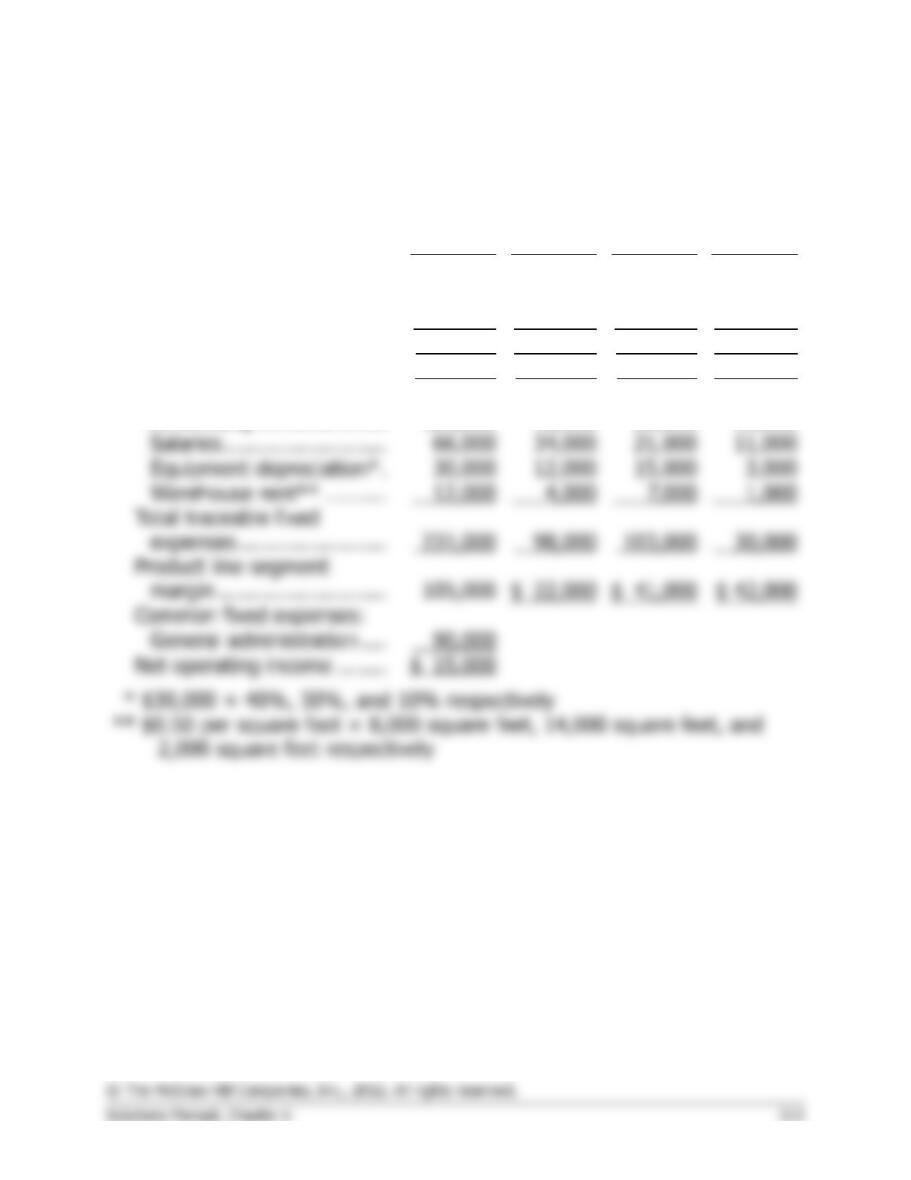
5. a. With lean production, production would have been geared to sales in
each year so that little or no inventory of finished goods would have
been built up in either Year 2 or Year 3.
Year 1
Year 2
Year 3
Unit sales …………………………...
50,000
40,000
50,000
Sales ………………………………….
$1,000,000
$ 800,000
$1,000,000
Cost of goods sold:
Cost of goods manufactured
@ $16 per unit ………………..
800,000
640,000
*
800,000
Add underapplied overhead ….
120,000
**
Cost of goods sold ………………..
800,000
760,000
Gross margin ……………………….
40,000
170,000
150,000
Net operating income (loss) …….
$ 30,000
$(110,000)
*
40,000 units × $16 per unit = $640,000.
Problem 6-26 (45 minutes)
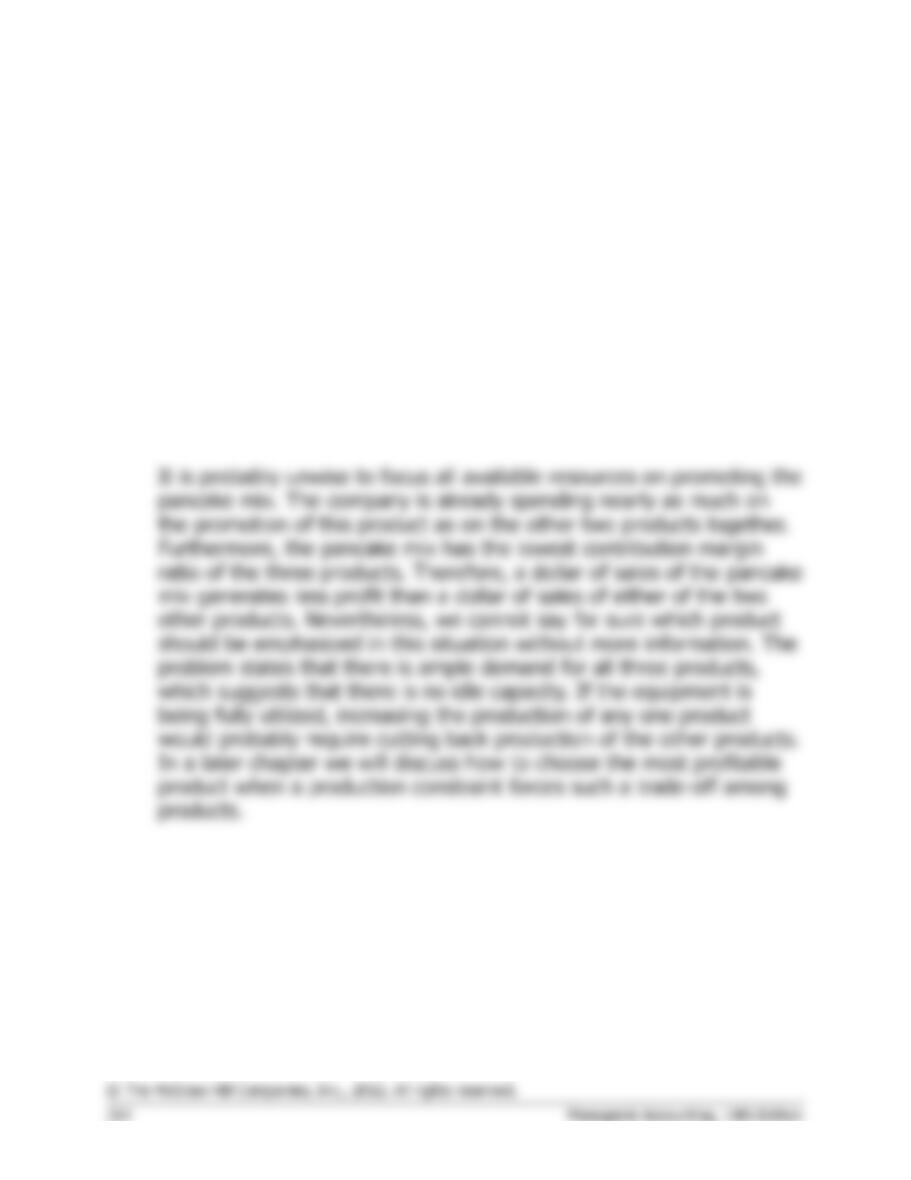
1. The segmented income statement follows:
Total
Company
Wheat
Cereal
Pancake
Mix
Flour
Sales …………………………..
$600,000
$200,000
$300,000
$100,000
Variable expenses:
Materials, labor & other …
204,000
60,000
126,000
18,000
Sales commissions ……….
60,000
20,000
30,000
10,000
Total variable expenses ……
264,000
80,000
156,000
28,000
Contribution margin ………..
336,000
120,000
144,000
72,000
Traceable fixed expenses:
Advertising …………………
123,000
48,000
60,000
15,000
Salaries ……………………..
66,000
34,000
21,000
11,000
Equipment depreciation* .
30,000
12,000
15,000
12,000
7,000
1,000
231,000
98,000
103,000
30,000
$ 22,000
$ 41,000
$ 42,000
General administration ….
90,000
Net operating income ……..
*
$30,000 × 40%, 50%, and 10% respectively
Problem 6-26 (continued)
2. a. No, the wheat cereal should not be eliminated. The wheat cereal
product is covering all of its own costs and is generating a $22,000
segment margin toward covering the company’s common costs and
toward profits. (Note: Problems relating to the elimination of a
product line are covered in more depth in a later chapter.)
b.
Wheat
Cereal
Pancake
Mix
Flour
Contribution margin (a) ……………..
$120,000
$144,000
$72,000
Sales (b) …………………………………
$200,000
$300,000
$100,000
Contribution margin ratio (a) ÷ (b) .
60%
48%
72%
Case 6-27 (45 minutes)
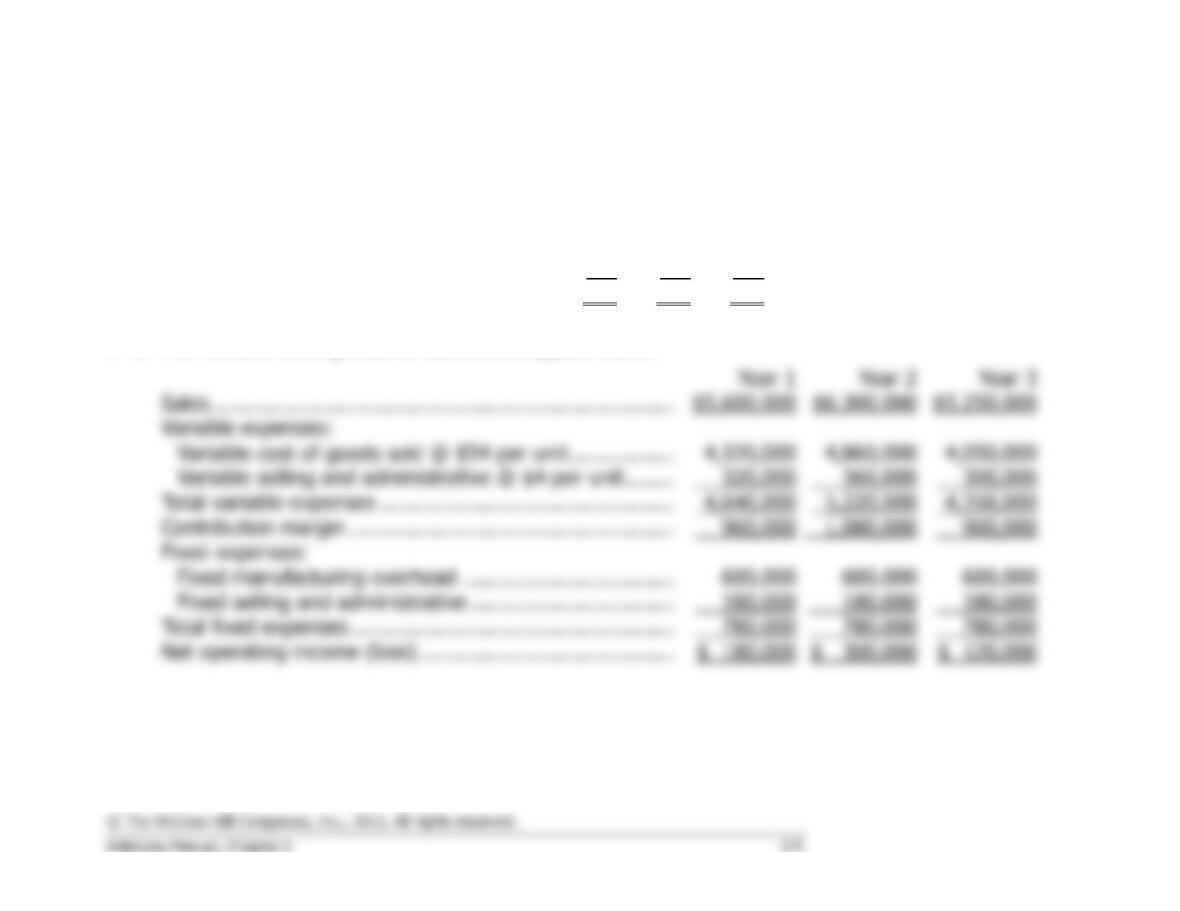
1 a. Under variable costing, only the variable manufacturing costs are included in product costs.
Year 1
Year 2
Year 3
Direct materials ………………………………
$30
$30
$30
Direct labor ……………………………………
18
18
18
Variable manufacturing overhead ……….
6
6
6
Variable costing unit product cost ……….
$54
$54
$54
1 b. The variable costing income statements appear below:
Sales …………………………………………………………………
Variable expenses:
Total variable expenses …………………………………………
Contribution margin ……………………………………………..
1,080,000
Fixed expenses:
Total fixed expenses ……………………………………………..
Net operating income (loss) ……………………………………
2a and 2b.
The answers to 2a and 2b are the same as 1a and 1b because the unit product costs are the same
for all three years. The inventory flow assumption is irrelevant when the unit product cost stays
constant.
Case 6-27 (continued)
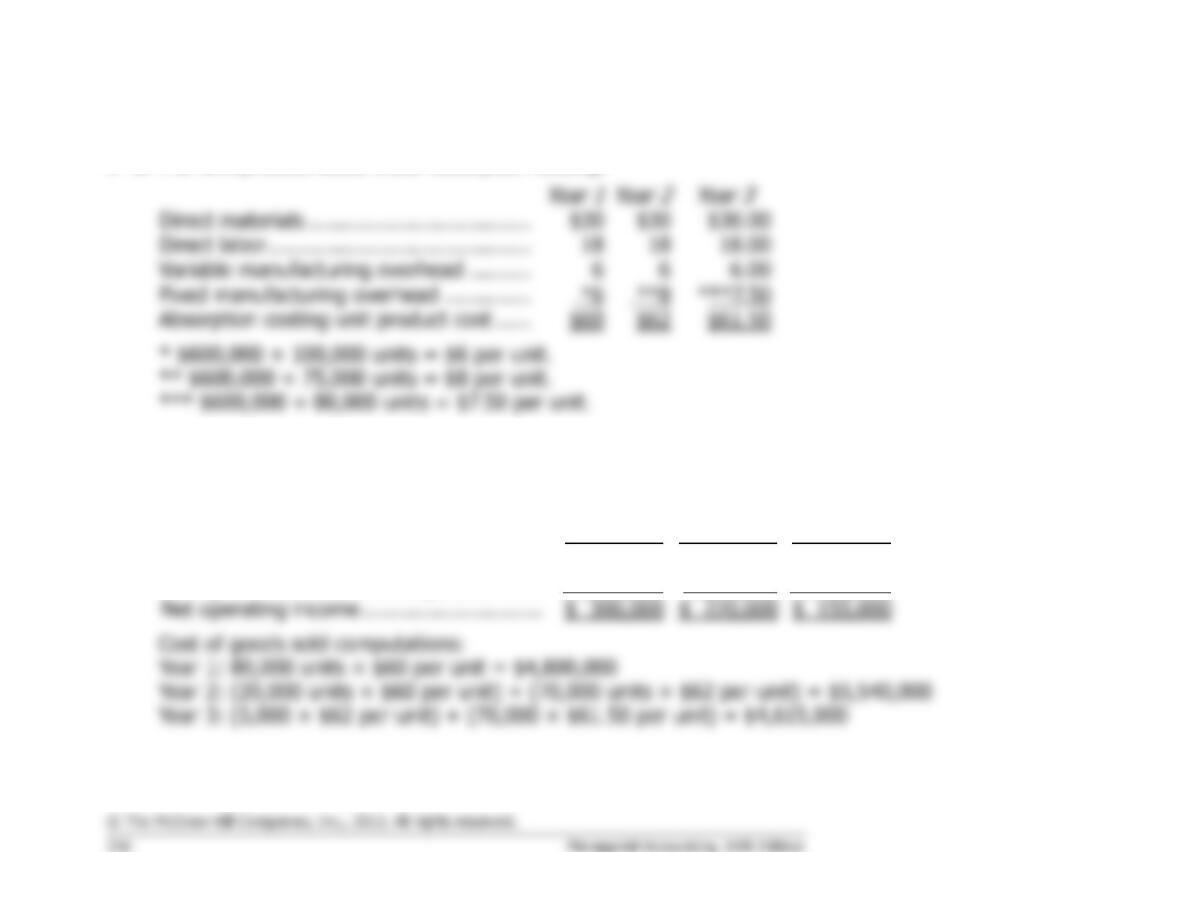
3 a. The unit product costs under absorption costing:
Direct materials ………………………………
Direct labor ……………………………………
Variable manufacturing overhead ……….
Fixed manufacturing overhead …………..
Absorption costing unit product cost ……
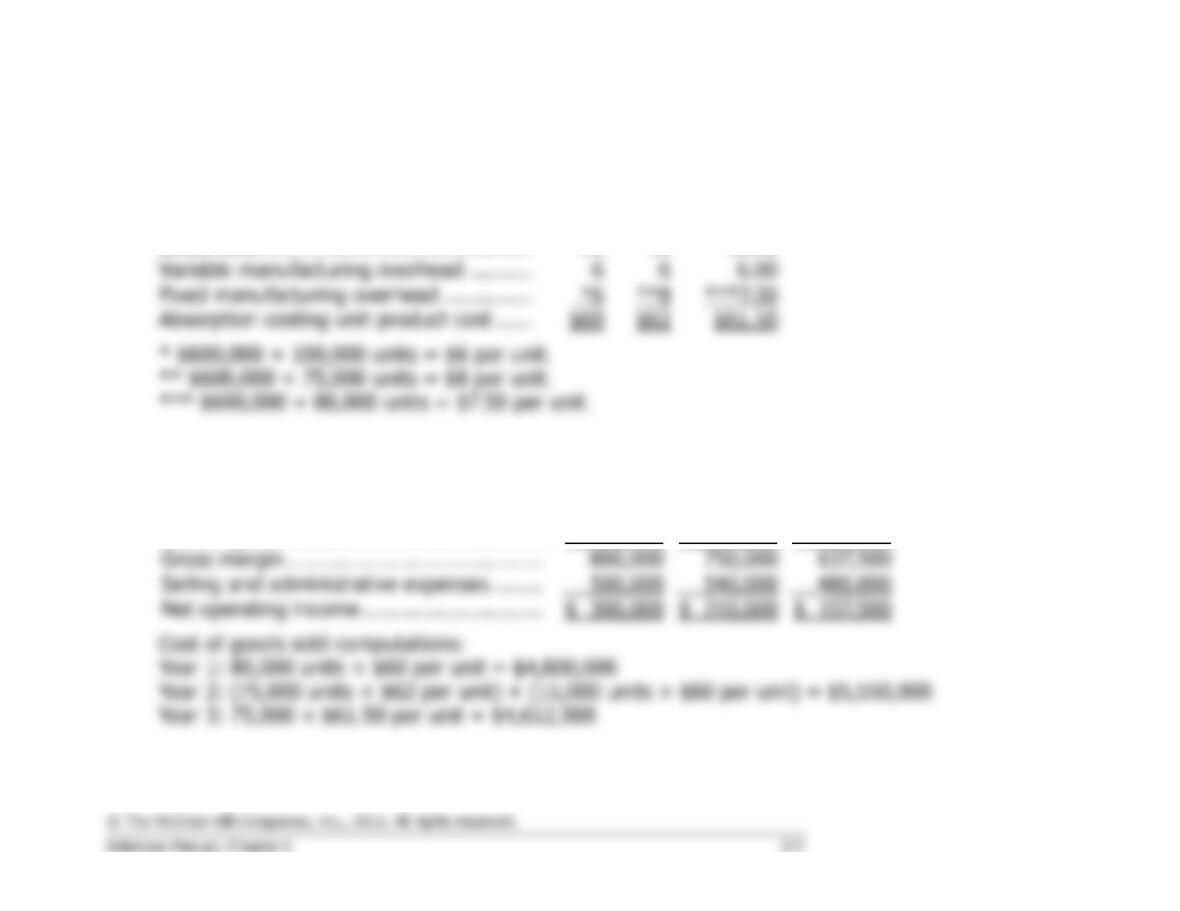
3 b. The absorption costing income statements appear below (FIFO):
Year 1
Year 2
Year 3
Sales ……………………………………………..
$5,600,000
$6,300,000
$5,250,000
Cost of goods sold…………………………….
4,800,000
5,540,000
4,615,000
Gross margin …………………………………..
800,000
760,000
635,000
Selling and administrative expenses ……..
500,000
540,000
480,000
Net operating income ………………………..
$ 220,000
$ 155,000
Case 6-27 (continued)
4 a. The unit product costs under absorption costing:
Year 1
Year 2
Year 3
Direct materials ………………………………
$30
$30
$30.00
Direct labor ……………………………………
18
18
18.00
Variable manufacturing overhead ……….
6
6
Fixed manufacturing overhead …………..
**8
Absorption costing unit product cost ……
$60
$62
$61.50
4 b. The absorption costing income statements appears below (LIFO):
Year 1
Year 2
Year 3
Sales ……………………………………………..
$5,600,000
$6,300,000
$5,250,000
Cost of goods sold…………………………….
4,800,000
5,550,000
4,612,500
Gross margin …………………………………..
Selling and administrative expenses ……..
Net operating income ………………………..
Case 6-28 (75 minutes)
1. See the segmented statement that follows. Supporting computations for
the statement are given below:
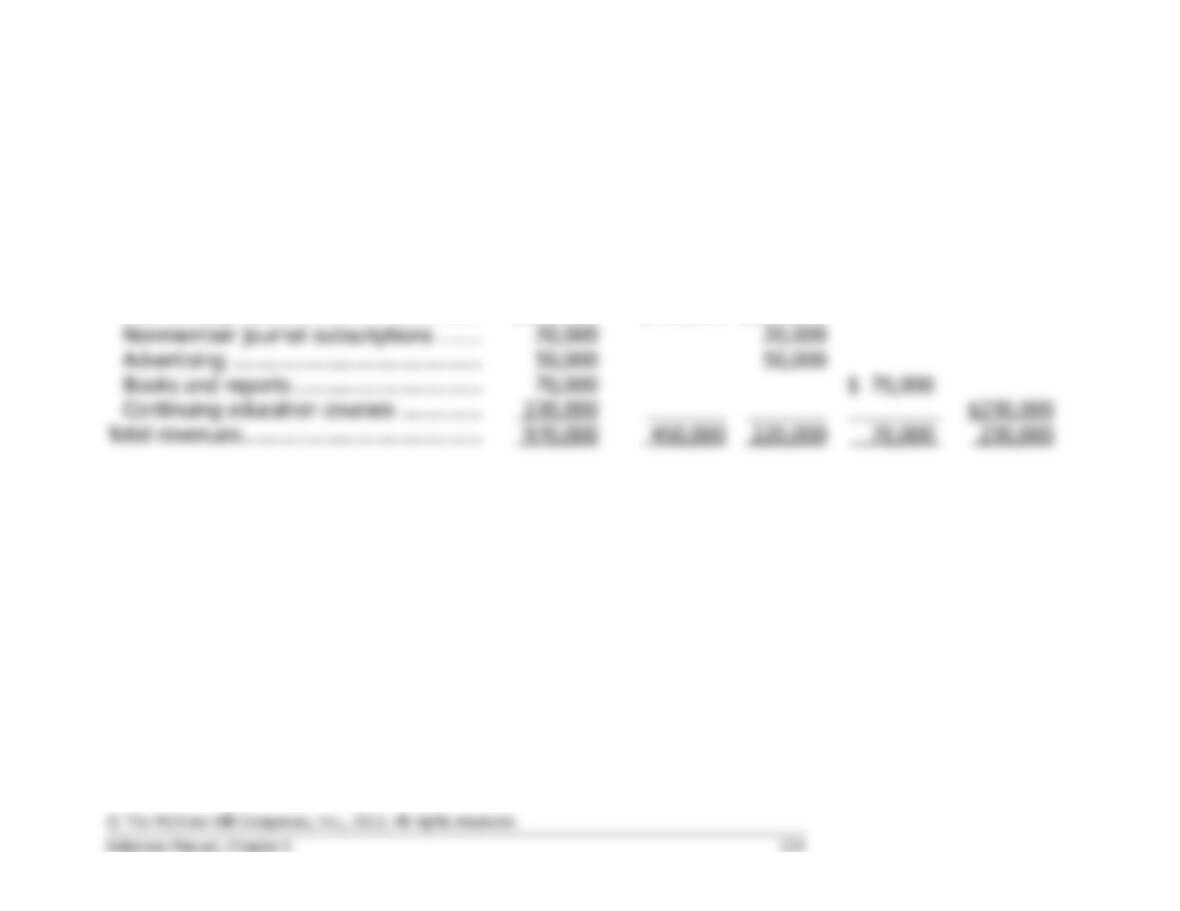
Revenues:
Membership dues (10,000 × $60) ……………………….
$600,000
Assigned to the Journal (10,000 × $15) ……………….
150,000
Assigned to Membership Service …………………………
$450,000
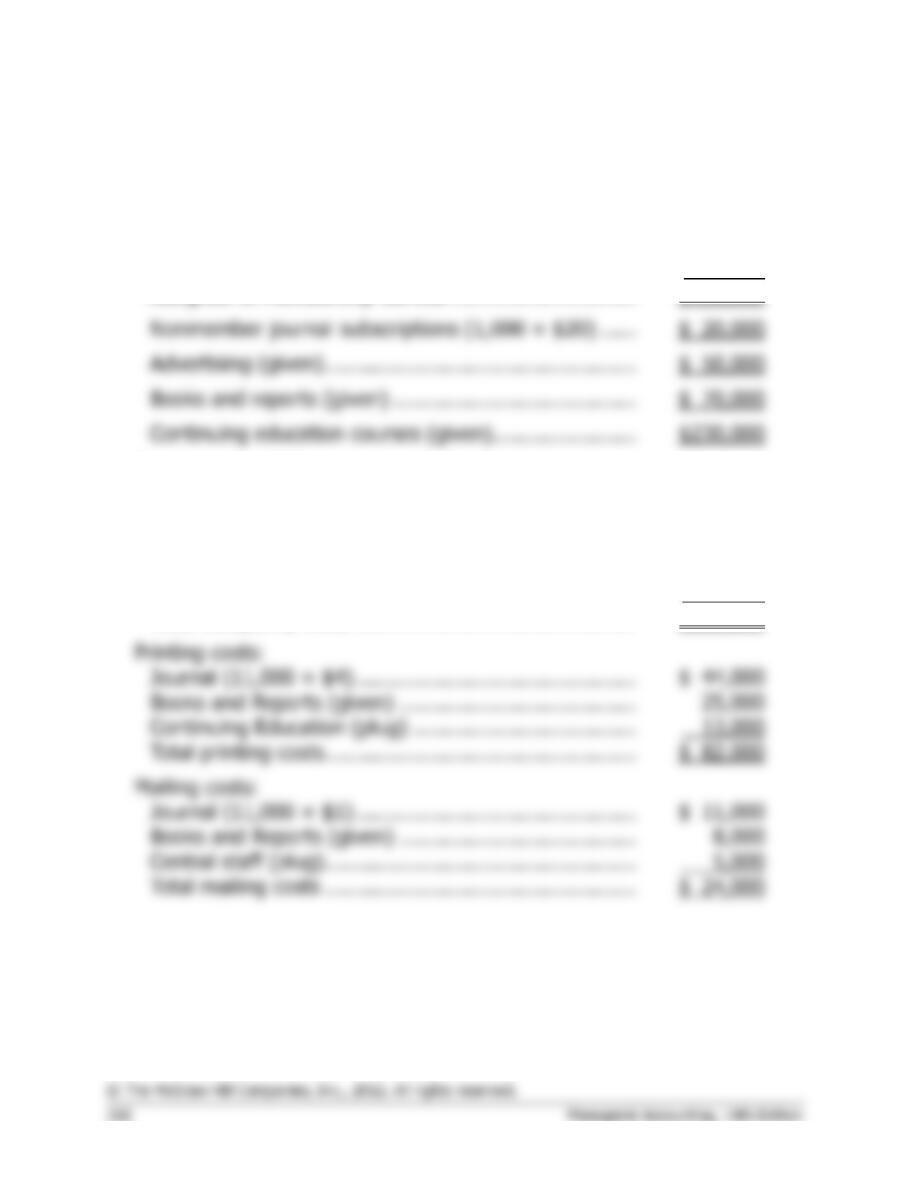
Nonmember journal subscriptions (1,000 × $20) ……
$ 20,000
Books and reports (given) …………………………………
$ 70,000
Continuing education courses (given) …………………..
$230,000
Occupancy costs:
Membership Services ($100,000 × 0.3 + $20,000) ….
$ 50,000
Journal ($100,000 × 0.1) ………………………………….
10,000
Books and Reports ($100,000 × 0.1) …………………..
10,000
Continuing Education ($100,000 × 0.2) ………………..
20,000
Central staff ($100,000 × 0.3) …………………………...
30,000
Total occupancy costs ………………………………………
$120,000
Printing costs:
Journal (11,000 × $4) ………………………………………
$ 44,000
Books and Reports (given) ………………………………..
25,000
Continuing Education (plug) ………………………………
Total printing costs …………………………………………..
$ 82,000
Mailing costs:
Journal (11,000 × $1) ………………………………………
$ 11,000
Books and Reports (given) ………………………………..
Total mailing costs …………………………………………..
$ 24,000
Case 6-28 (continued)
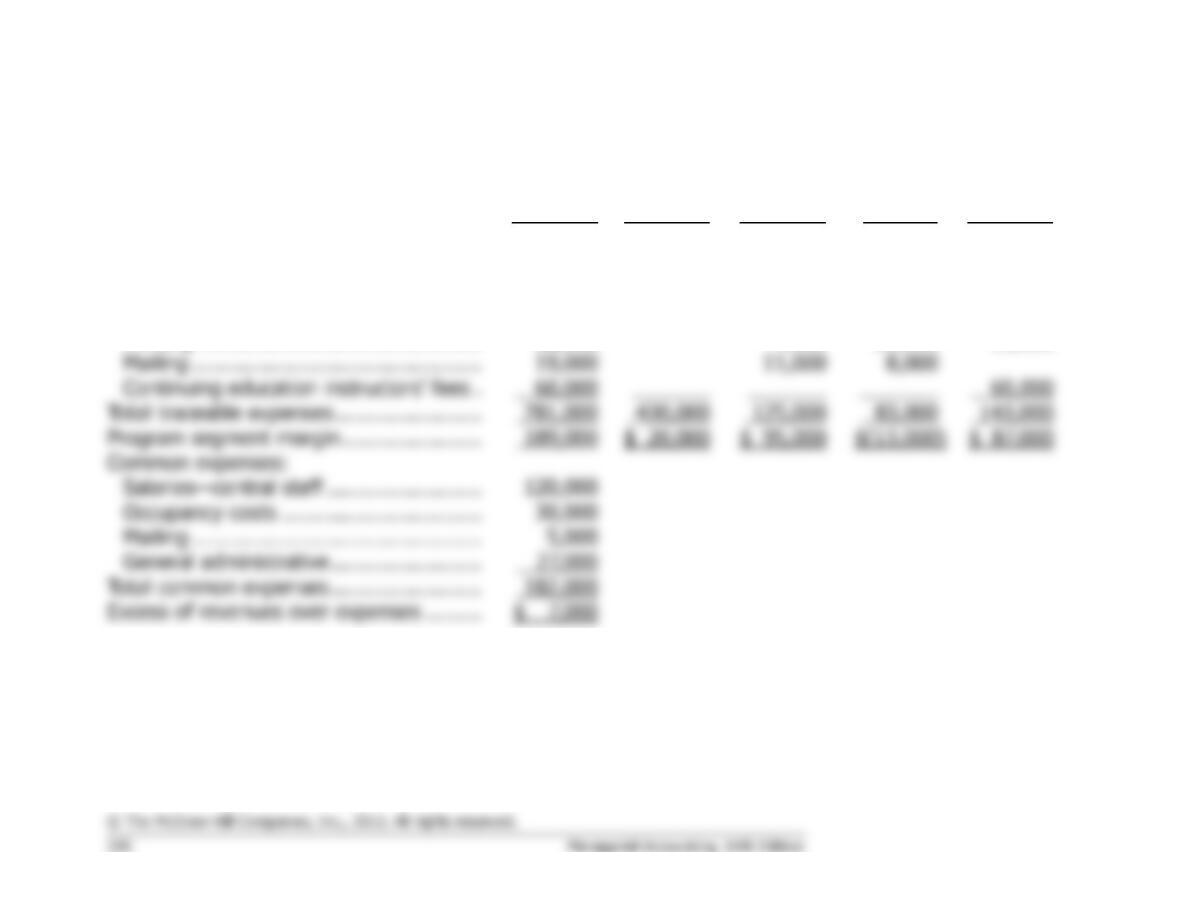
A statement detailing revenues by program appears directly below. The segmented income statement
follows on the next page.
Total
Membership
Services
Journal
Books and
Reports
Continuing
Education
Revenues:
Membership dues ………………………….
$600,000
$450,000
$150,000
Nonmember journal subscriptions …….
Total revenues ………………………………..
Case 6-28 (continued)
Total
Membership
Services
Journal
Books and
Reports
Continuing
Education
Total revenues ………………………………..
$970,000
$450,000
$220,000
$70,000
$230,000
Expenses traceable to segments:
Salaries ………………………………………
320,000
170,000
60,000
40,000
50,000
Occupancy costs …………………………..
90,000
50,000
10,000
10,000
20,000
Distributions to local chapters ………….
210,000
210,000
Printing ………………………………………
82,000
44,000
25,000
13,000
Mailing …………………………..…………..
19,000
11,000
Total traceable expenses …………………..
143,000
Program segment margin ………………….
189,000
$ 20,000
$ 95,000
Common expenses:
120,000
Occupancy costs …………………………..
30,000
Mailing …………………………..…………..
General administrative ……………………
Total common expenses ……………………
182,000
Excess of revenues over expenses ………
$ 7,000
Note: Some may argue that apart from the $20,000 in rental cost directly attributed to Membership
Services, occupancy costs are common costs that should not be allocated to programs. The correct
treatment of the occupancy costs depends on whether they could be avoided in part by eliminating a
program. We have assumed that they could be avoided.
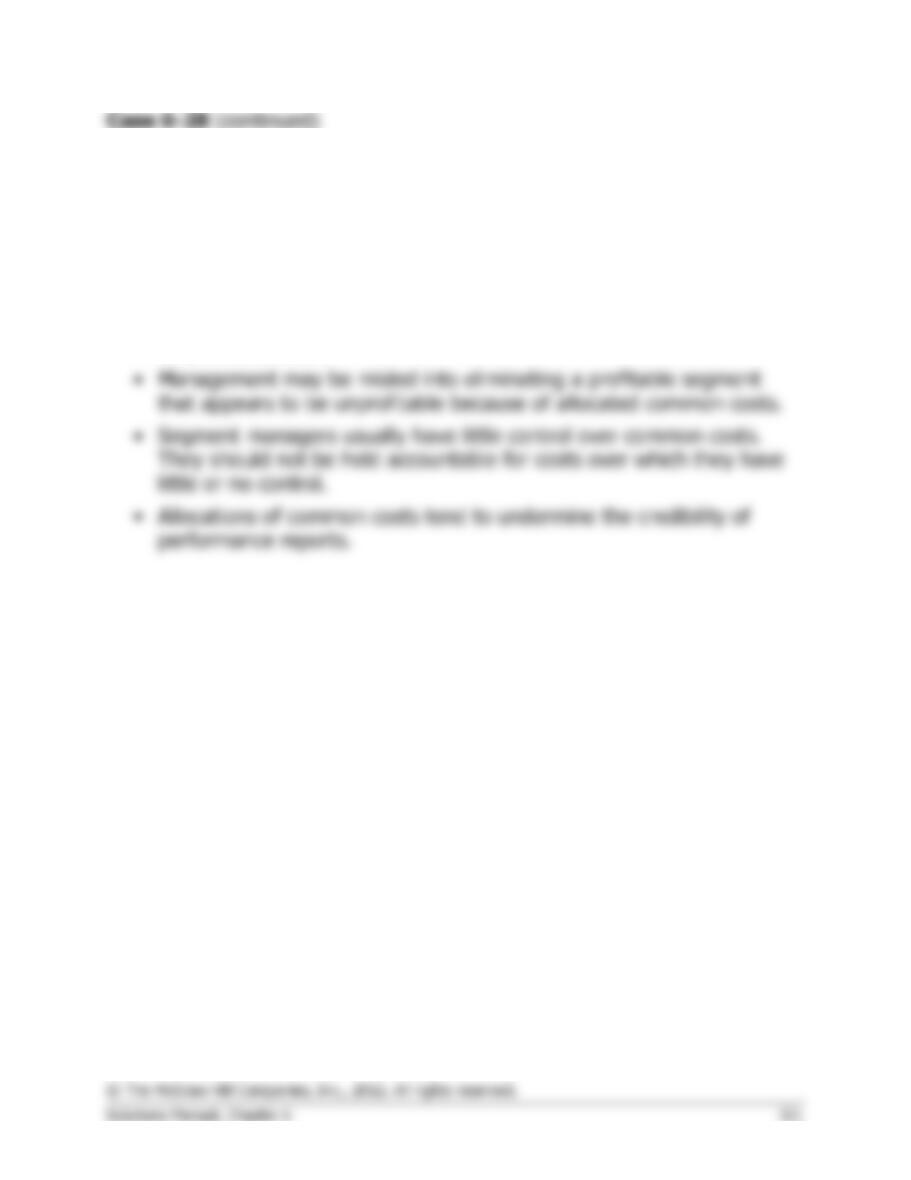
2. While we do not favor the allocation of common costs to segments, the
reason most often given for this practice is that segment managers need
to be aware of the fact that common costs exist and that they must be
covered.
Arguments against allocation of common costs include:
• Allocation bases must be chosen arbitrarily since no cause-and-effect
relationship exists between common costs and the segments to which
they are allocated.