104
WHAT’S NEW IN THE SIXTH EDITION:
There is a new
In the News
feature on “Should Unpaid Internships Be Allowed?”
LEARNING OBJECTIVES:
By the end of this chapter, students should understand:
➢ the effects of government policies that place a ceiling on prices.
CONTEXT AND PURPOSE:
Chapter 6 is the third chapter in a three-chapter sequence that deals with supply and demand and how
markets work. Chapter 4 developed the model of supply and demand. Chapter 5 added precision to the
model of supply and demand by developing the concept of elasticity—the sensitivity of the quantity
KEY POINTS:
• A price ceiling is a legal maximum on the price of a good or service. An example is rent control. If the
price ceiling is below the equilibrium price, so the price ceiling is binding, the quantity demanded
6
SUPPLY, DEMAND, AND
GOVERNMENT POLICIES
Chapter 6/Supply, Demand, and Government Policies ❖ 105
exceeds the quantity supplied. Because of the resulting shortage, sellers must in some way ration the
good or service among buyers.
• A tax on a good places a wedge between the price paid by buyers and the price received by sellers.
When the market moves to the new equilibrium, buyers pay more for the good and sellers receive
less for it. In this sense, buyers and sellers share the tax burden. The incidence of a tax (that is, the
division of the tax burden) does not depend on whether the tax is levied on buyers or sellers.
CHAPTER OUTLINE:
I. Controls on Prices
A. Definition of price ceiling: a legal maximum on the price at which a good can be sold.
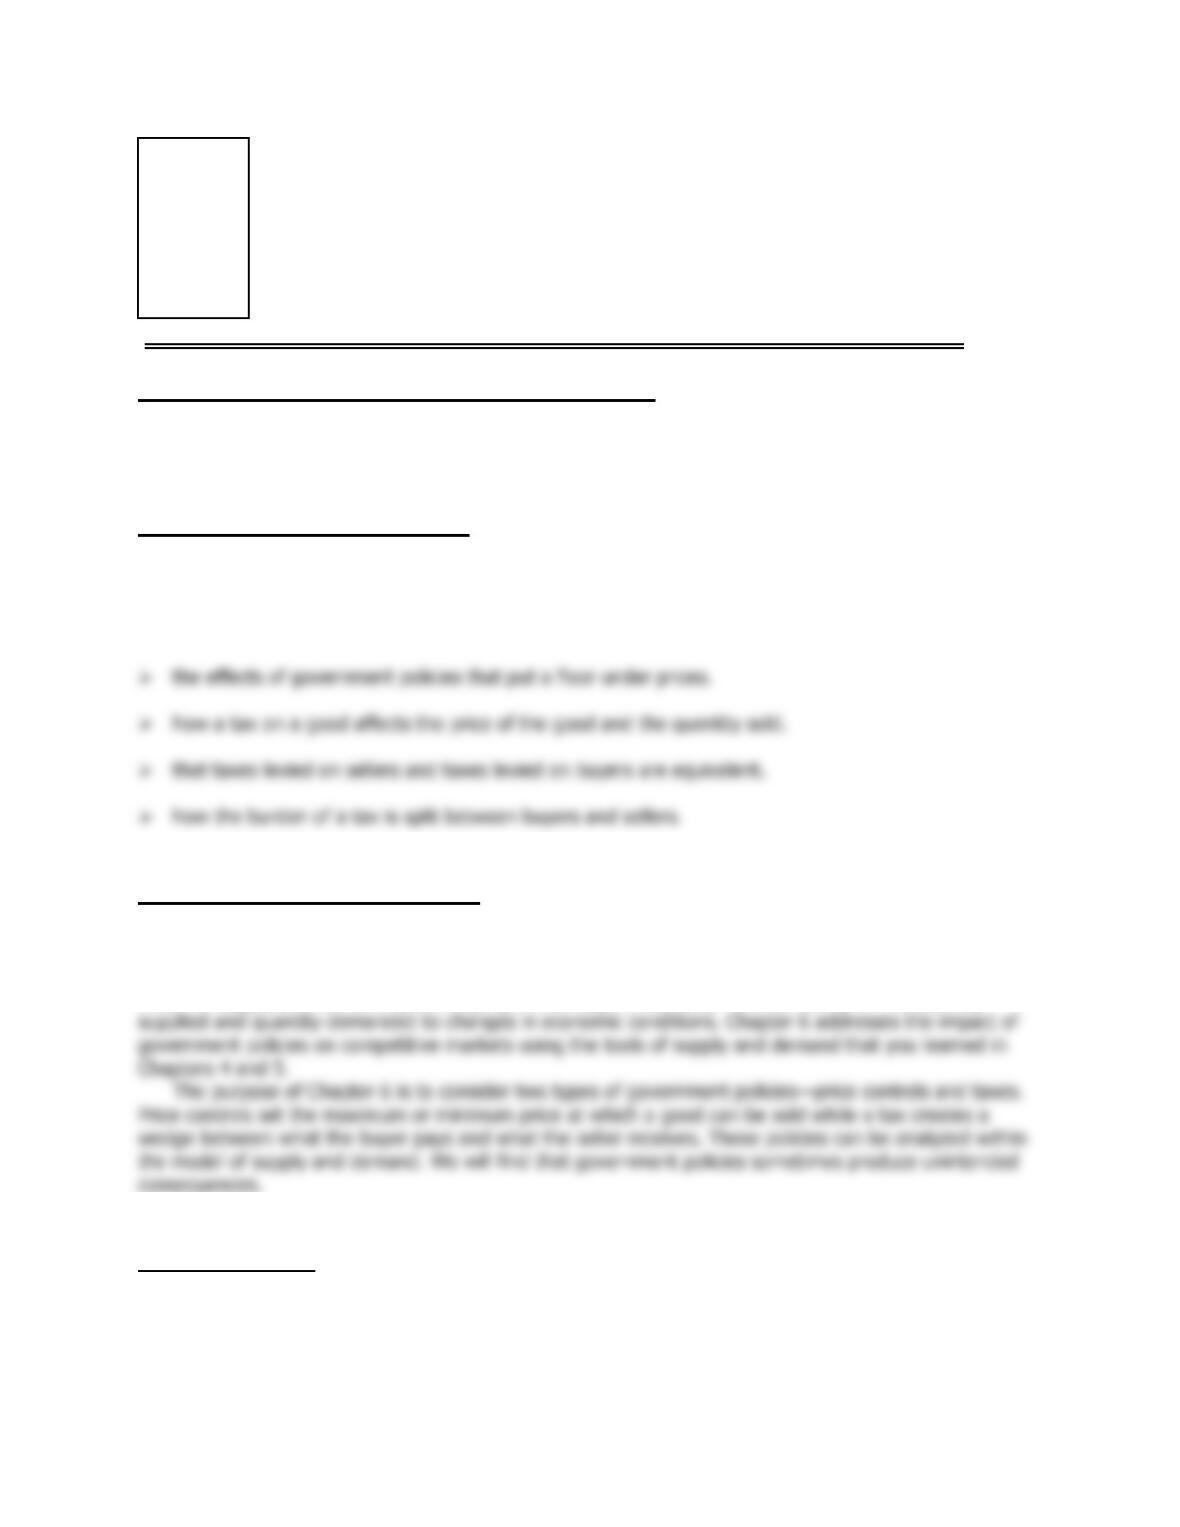
1. There are two possible outcomes if a price ceiling is put into place in a market.
a. If the price ceiling is higher than or equal to the equilibrium price, it is not binding and
has no effect on the price or quantity sold.
Figure 1
106 ❖ Chapter 6/Supply, Demand, and Government Policies
2. If a shortage for a product occurs (and price cannot adjust to eliminate it), a method for
rationing the good must develop.
a. In 1973, OPEC raised the price of crude oil, which led to a reduction in the supply of
gasoline.
5.
Case Study: Rent Control in the Short Run and the Long Run
a. The goal of rent control is to make housing more affordable for the poor.
Figure 2
Figure 3
ALTERNATIVE CLASSROOM EXAMPLE:
Ask students about the rental market in their town. Draw a supply-and-demand graph for
two-bedroom apartments asking students what they believe the equilibrium rental rate is.
Then suggest that the city council is accusing landlords of taking advantage of students and
thus places a price ceiling below the equilibrium price. Make sure that students can see that a
shortage of apartments would result. Ask students to identify the winners and losers of this
government policy.
Chapter 6/Supply, Demand, and Government Policies ❖ 107
D. How Price Floors Affect Market Outcomes
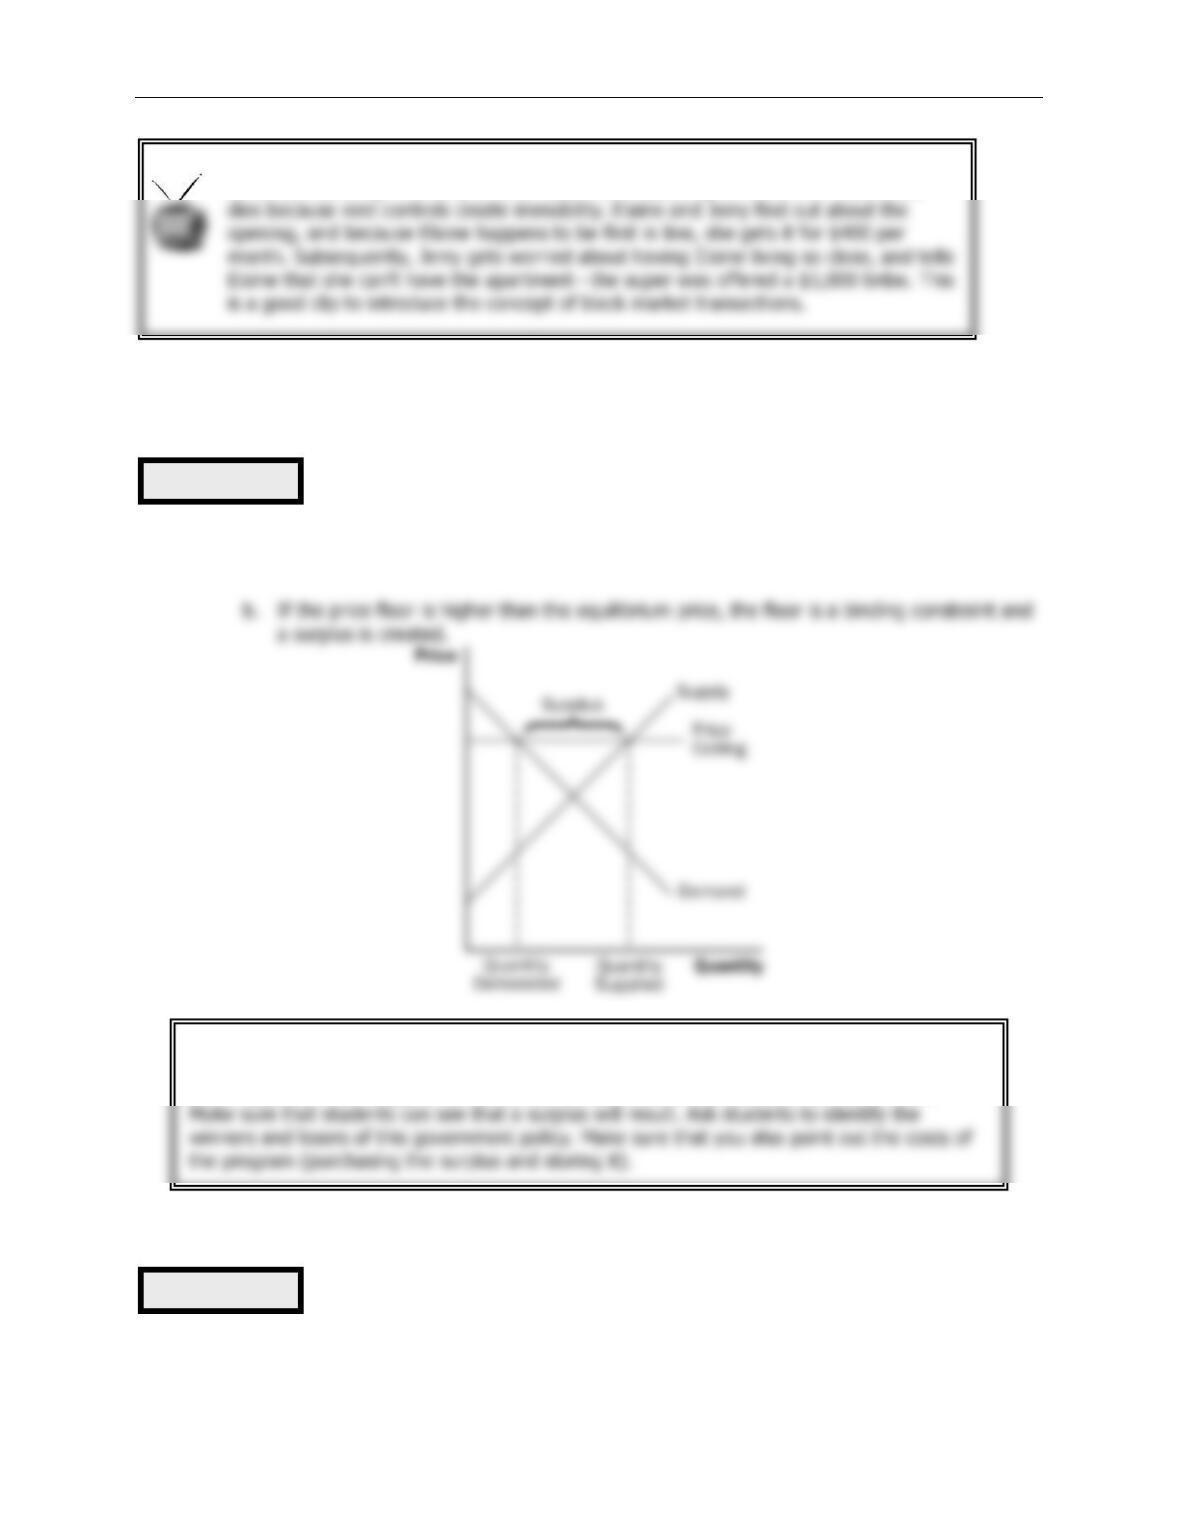
1. There are two possible outcomes if a price floor is put into place in a market.
a. If the price floor is lower than or equal to the equilibrium price, it is not binding and has
no effect on the price or quantity sold.
2.
Case Study: The Minimum Wage
a. The market for labor looks like any other market: downward-sloping demand, upward–
sloping supply, an equilibrium price (called a wage), and an equilibrium quantity of labor
hired.
Seinfeld, “The Apartment.”
Season 2 (1:55-5:20, 9:02-9:49). Jerry lives in a rent-
controlled building. The only time an apartment opens up is when Mrs. Hudwalker
Figure 4
ALTERNATIVE CLASSROOM EXAMPLE:
Go through an example with an agricultural price support. Show students that, even though a
price support is not a legal minimum price, its result is exactly the same as a price floor.
Figure 5
108 ❖ Chapter 6/Supply, Demand, and Government Policies
E.
In the News: Should Unpaid Internships Be Allowed?
F. Evaluating Price Controls
1. Because most economists feel that markets are usually a good way to organize economic
activity, most oppose the use of price ceilings and floors.
a. Prices balance supply and demand and thus coordinate economic activity.
2. Price ceilings and price floors often hurt the people they are intended to help.
a. Rent controls create a shortage of quality housing and provide disincentives for building
maintenance.
Chapter 6/Supply, Demand, and Government Policies ❖ 109
Examples of unit taxes include most government excise taxes on products such as
gasoline, alcohol, and tobacco.
Activity 1—Ducks in a Row
Type: In-class demonstration
Topics: Price ceilings, subsidies, and unintended consequences
Materials needed: 2 toy ducks, some play money, 3 volunteers
Time: 10 minutes
Class limitations: Works in any size class
Purpose
This demonstration illustrates some common problems of government intervention in
markets.
Instructions
One volunteer plays the role of the government in a poor country. Give the play money to the
“government,” except for $1. The government uses this money to buy ducks from the farmer
Start the game. The consumer buys one duck from the shopkeeper. The shopkeeper requests
more ducks from the government. The government comes to the farmer.
Points for Discussion
The instructor, as the duck farmer, controls the game. There are three points to make in this
demonstration:
1. Shortage. The farmer refuses to sell ducks at $1 each. The shopkeeper has no ducks.
110 ❖ Chapter 6/Supply, Demand, and Government Policies
II. Taxes
A. Definition of tax incidence: the manner in which the burden of a tax is shared among
participants in a market.
B. How Taxes on Sellers Affect Market Outcomes
3. The quantity of the good sold will decline.
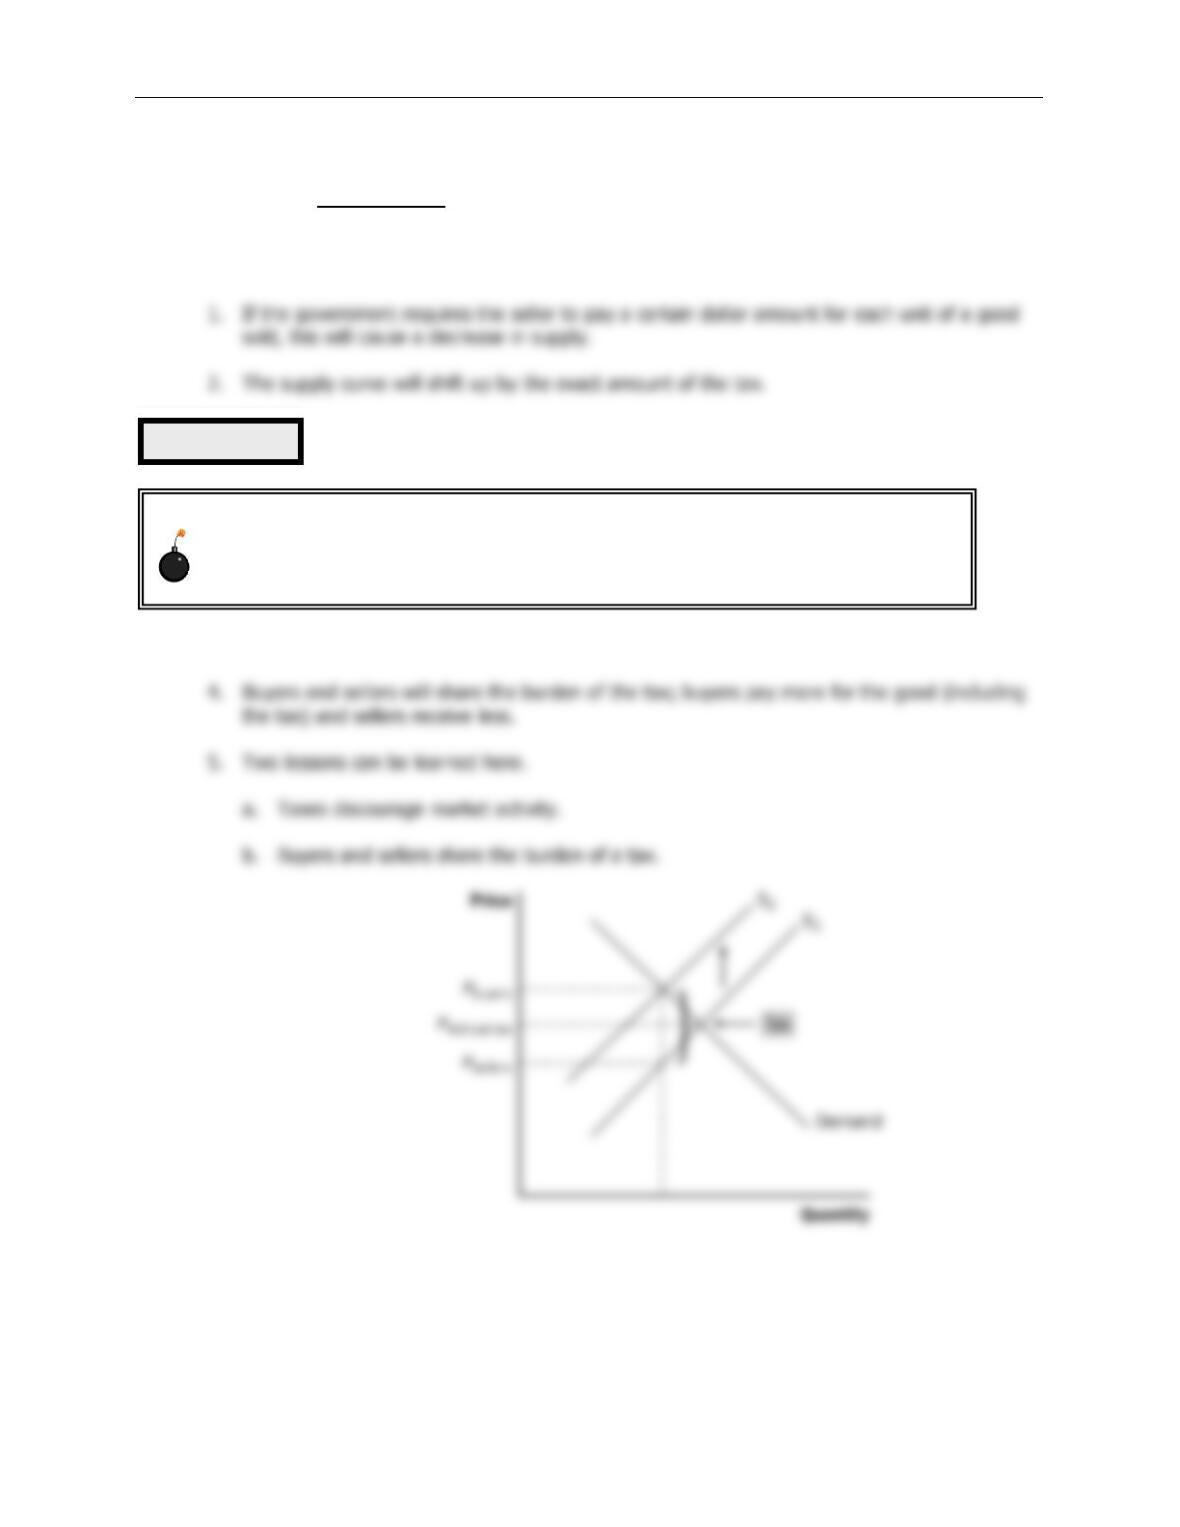
You will want to be very careful when discussing the “upward” shift of the supply
curve given that we encourage students to think of supply and demand curves
shifting “right” and “left.” Make sure to emphasize the effects of the tax on sellers’
willingness to sell.
Figure 6
Chapter 6/Supply, Demand, and Government Policies ❖ 111
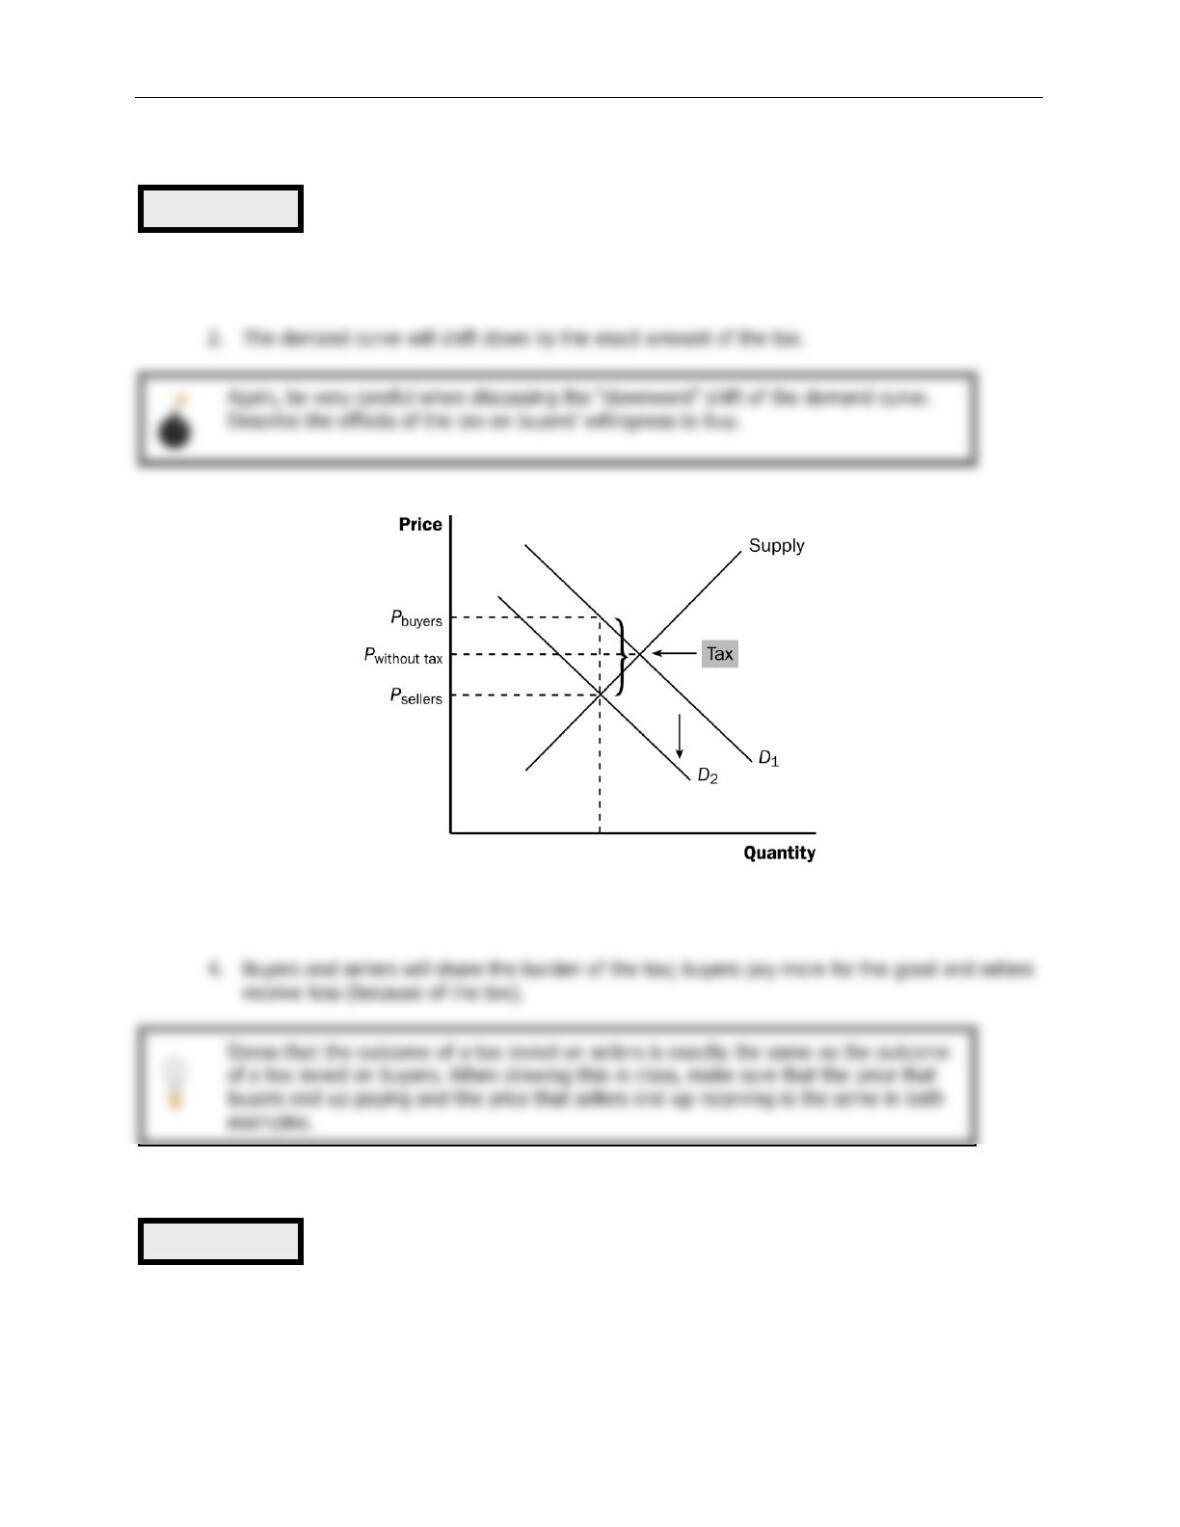
B. How Taxes on Buyers Affect Market Outcomes
1. If the government requires the buyer to pay a certain dollar amount for each unit of a good
purchased, this will cause a decrease in demand.
3. The quantity of the good sold will decline.
D.
Case Study: Can Congress Distribute the Burden of a Payroll Tax?
1. FICA (Social Security) taxes were designed so that firms and workers would equally share the
burden of the tax.
Figure 7
Figure 8
112 ❖ Chapter 6/Supply, Demand, and Government Policies
2. This type of payroll tax will simply put a wedge between the wage the firm pays and the
wage the workers will receive.
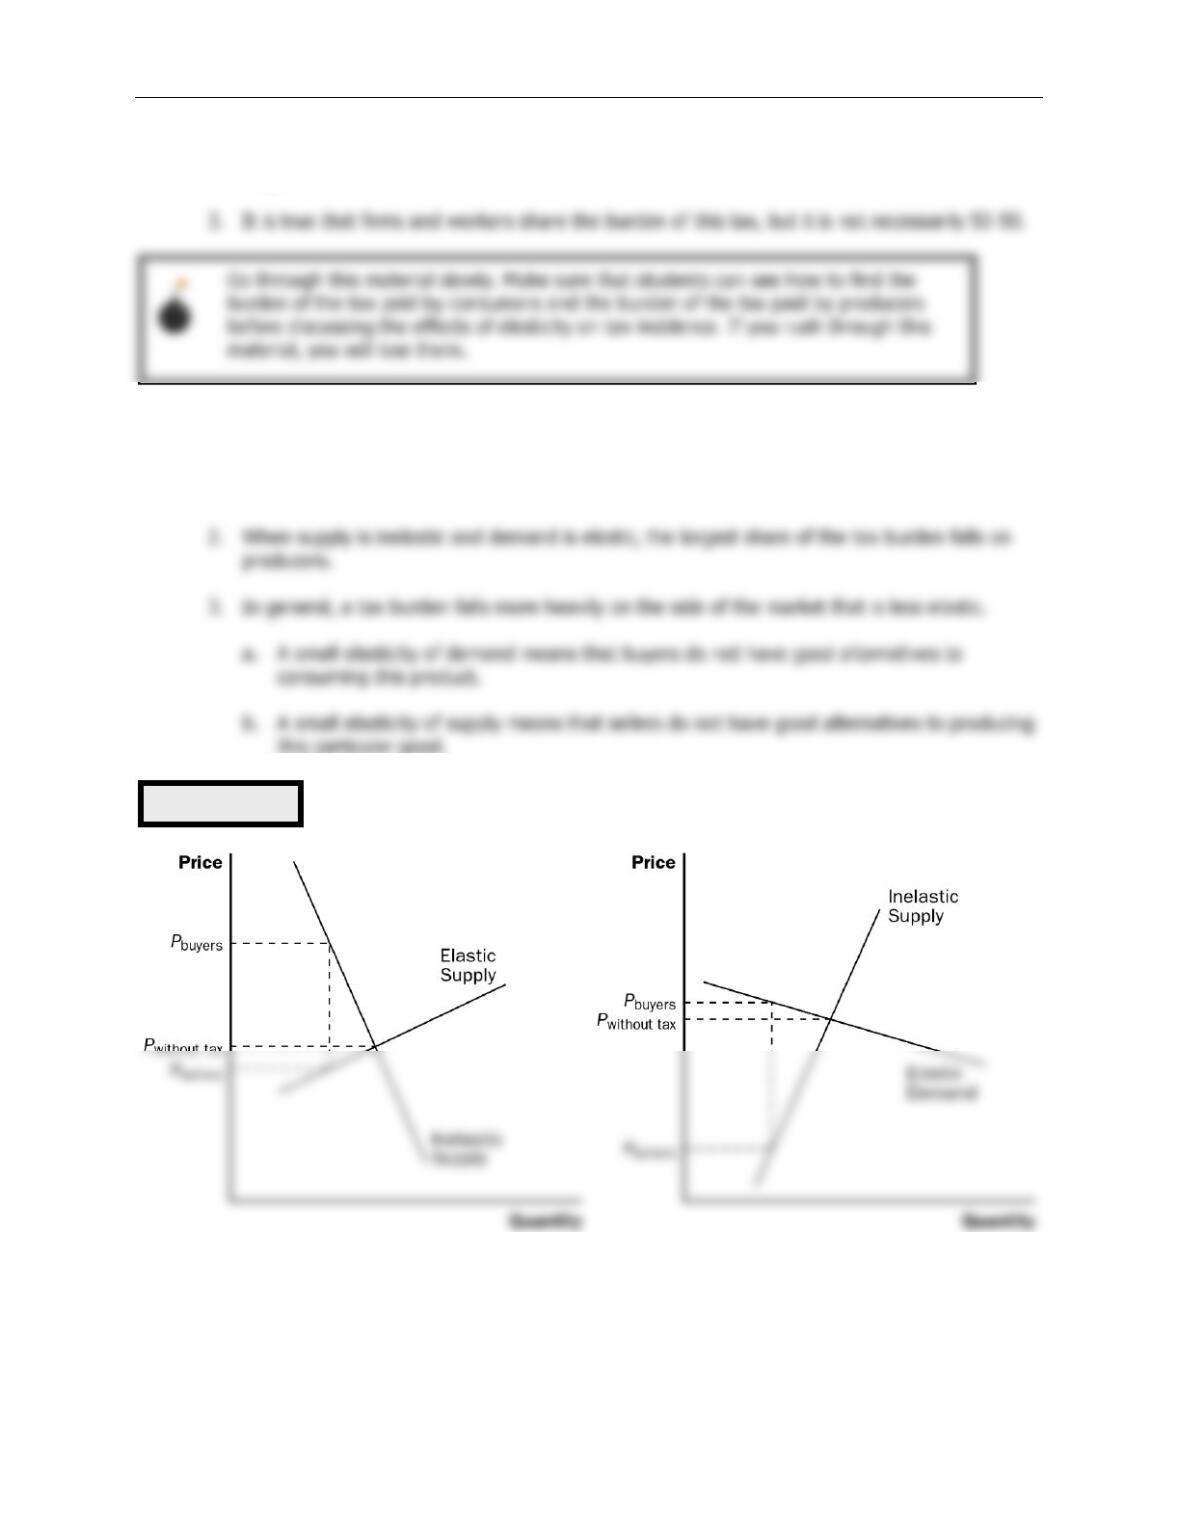
E. Elasticity and Tax Incidence
1. When supply is elastic and demand is inelastic, the largest share of the tax burden falls on
consumers.
this particular good.
4.
Case Study: Who Pays the Luxury Tax?
a. In 1990, Congress adopted a new luxury tax.
Figure 9
Chapter 6/Supply, Demand, and Government Policies ❖ 113
SOLUTIONS TO TEXT PROBLEMS:
Quick Quizzes
1. A price ceiling is a legal maximum on the price at which a good can be sold. Examples of
price ceilings include rent controls, price controls on gasoline in the 1970s, and price ceilings
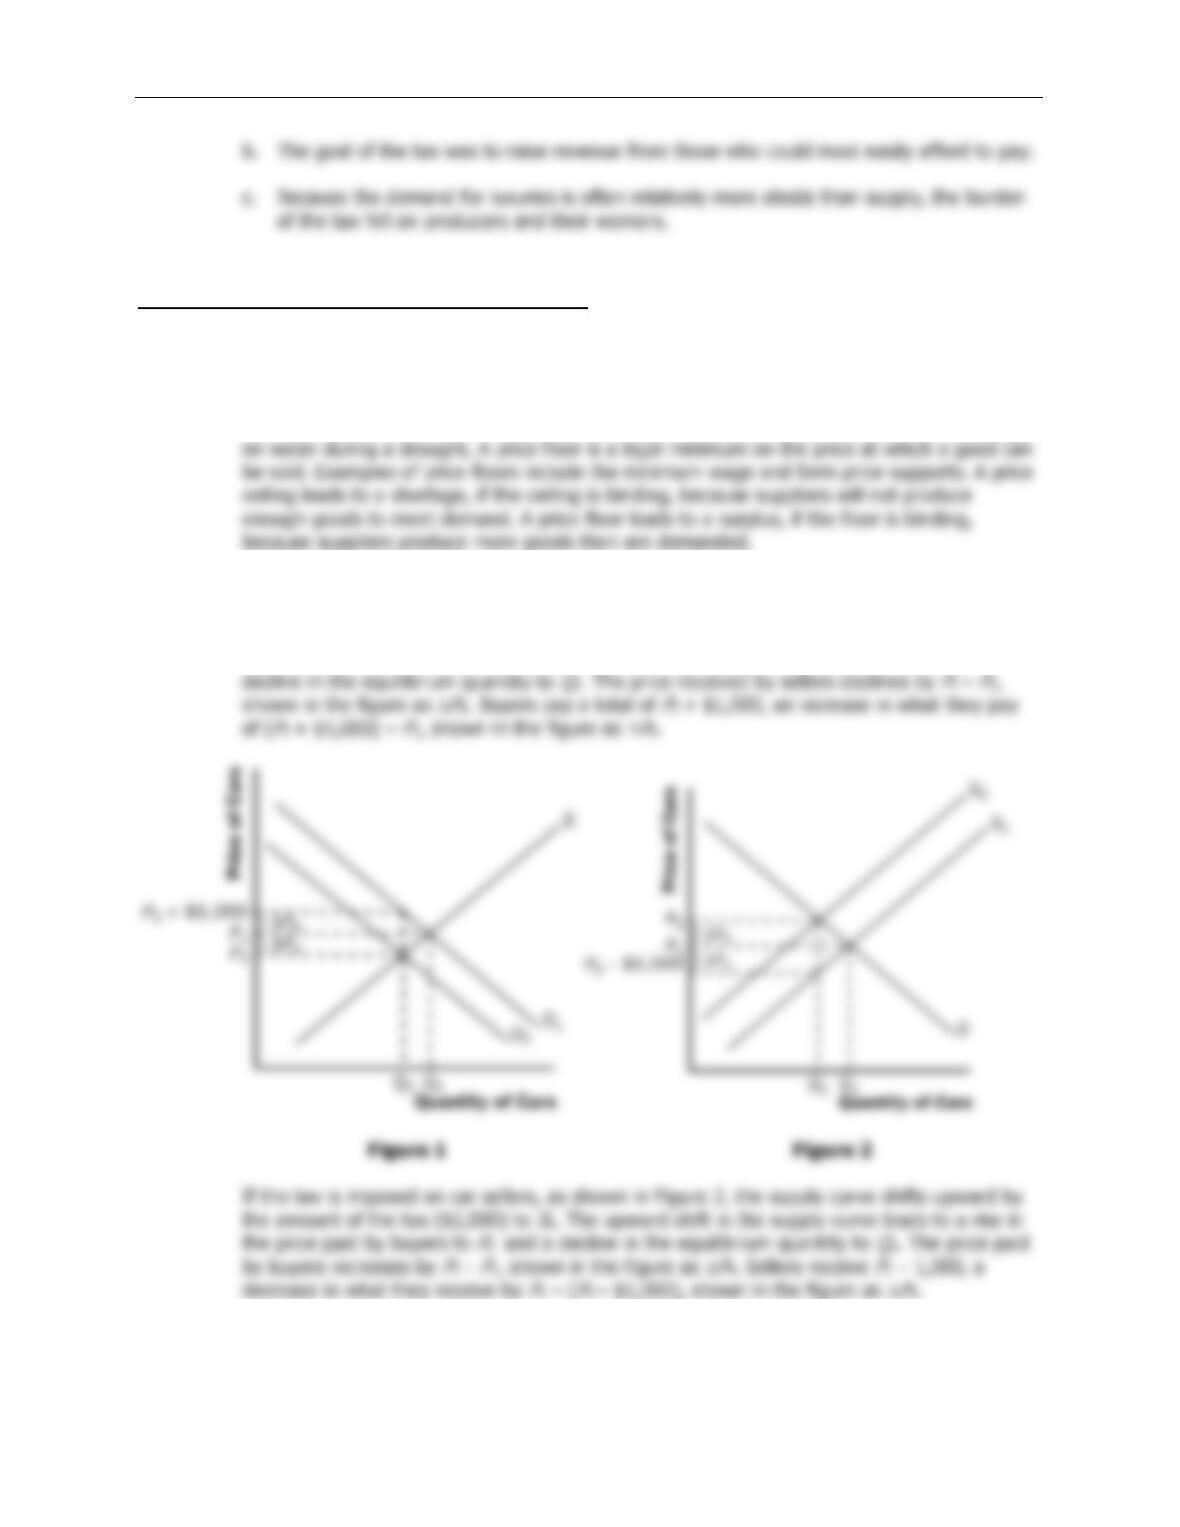
2. With no tax, as shown in Figure 1, the demand curve is
D
1 and the supply curve is
S
. The
equilibrium price is
P
1 and the equilibrium quantity is
Q
1. If the tax is imposed on car buyers,
the demand curve shifts downward by the amount of the tax ($1,000) to
D
2. The downward
shift in the demand curve leads to a decline in the price received by sellers to
P
2 and a
114 ❖ Chapter 6/Supply, Demand, and Government Policies
Questions for Review
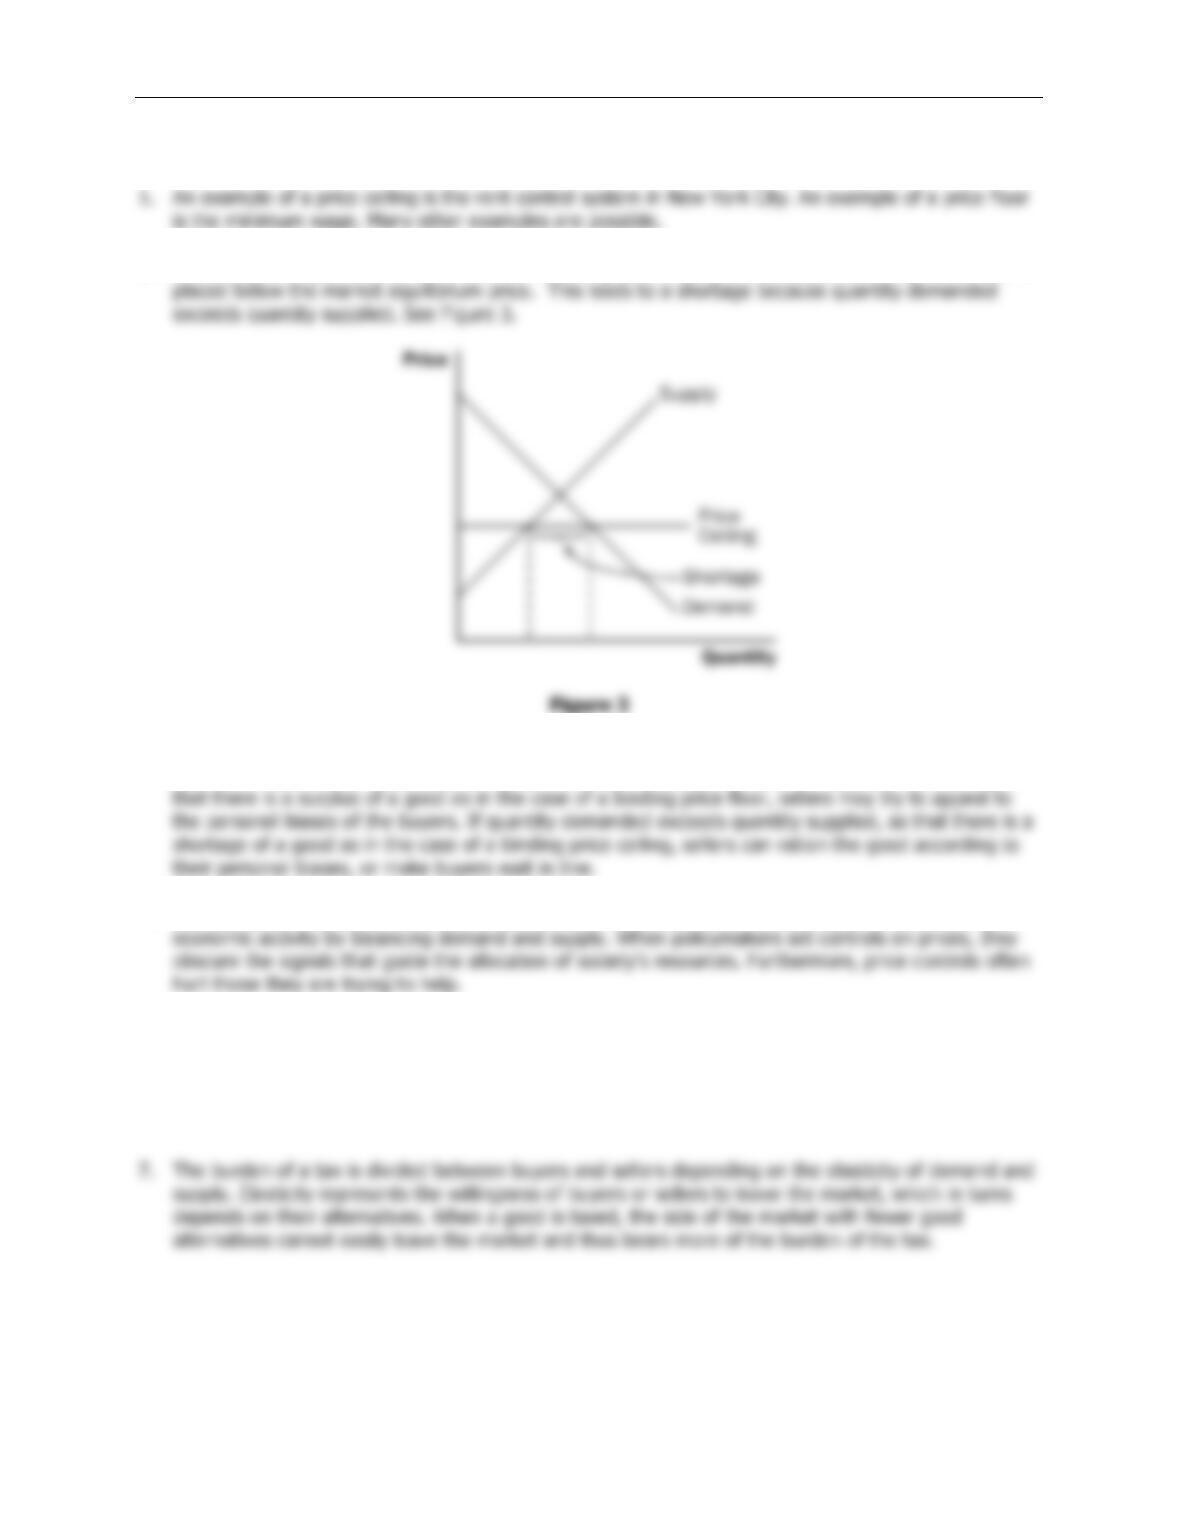
2. A shortage of a good arises when there is a binding price ceiling. A binding price ceiling is one that is
3. When the price of a good is not allowed to bring supply and demand into equilibrium, some
alternative mechanism must allocate resources. If quantity supplied exceeds quantity demanded, so
4. Economists usually oppose controls on prices because prices have the crucial job of coordinating
5. Removing a tax paid by buyers and replacing it with a tax paid by sellers has no effect on the price
that buyers pay, the price that sellers receive, and the quantity of the good sold.
6. A tax on a good raises the price buyers pay, lowers the price sellers receive, and reduces the quantity
sold.
Problems and Applications
1. If the price ceiling of $40 per ticket is below the equilibrium price, then quantity demanded exceeds
quantity supplied, so there will be a shortage of tickets. The policy decreases the number of people
Chapter 6/Supply, Demand, and Government Policies ❖ 115
who attend classical music concerts, because the quantity supplied is lower because of the lower
price.
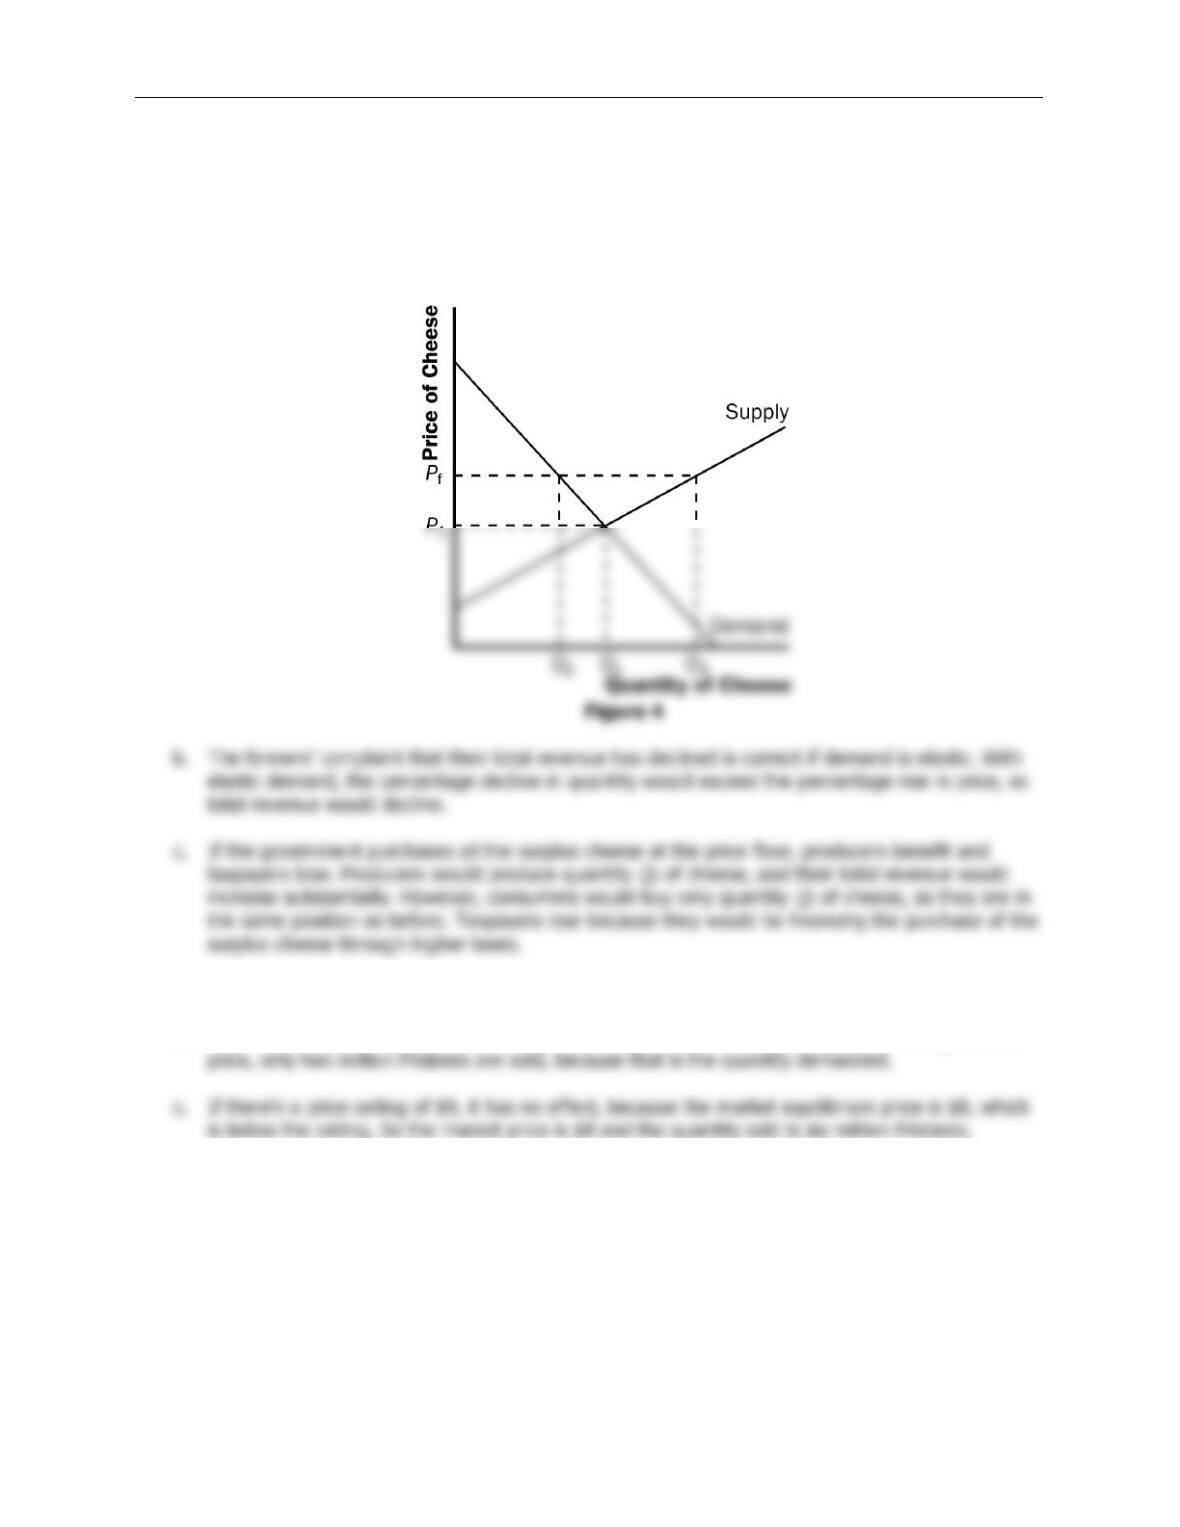
2. a. The imposition of a binding price floor in the cheese market is shown in Figure 4. In the absence
of the price floor, the price would be
P
1 and the quantity would be
Q
1. With the floor set at
P
f,
which is greater than
P
1, the quantity demanded is
Q
2, while quantity supplied is
Q
3, so there is a
surplus of cheese in the amount
Q
3 –
Q
2.
3. a. The equilibrium price of Frisbees is $8 and the equilibrium quantity is six million Frisbees.
b. With a price floor of $10, the new market price is $10 because the price floor is binding. At that
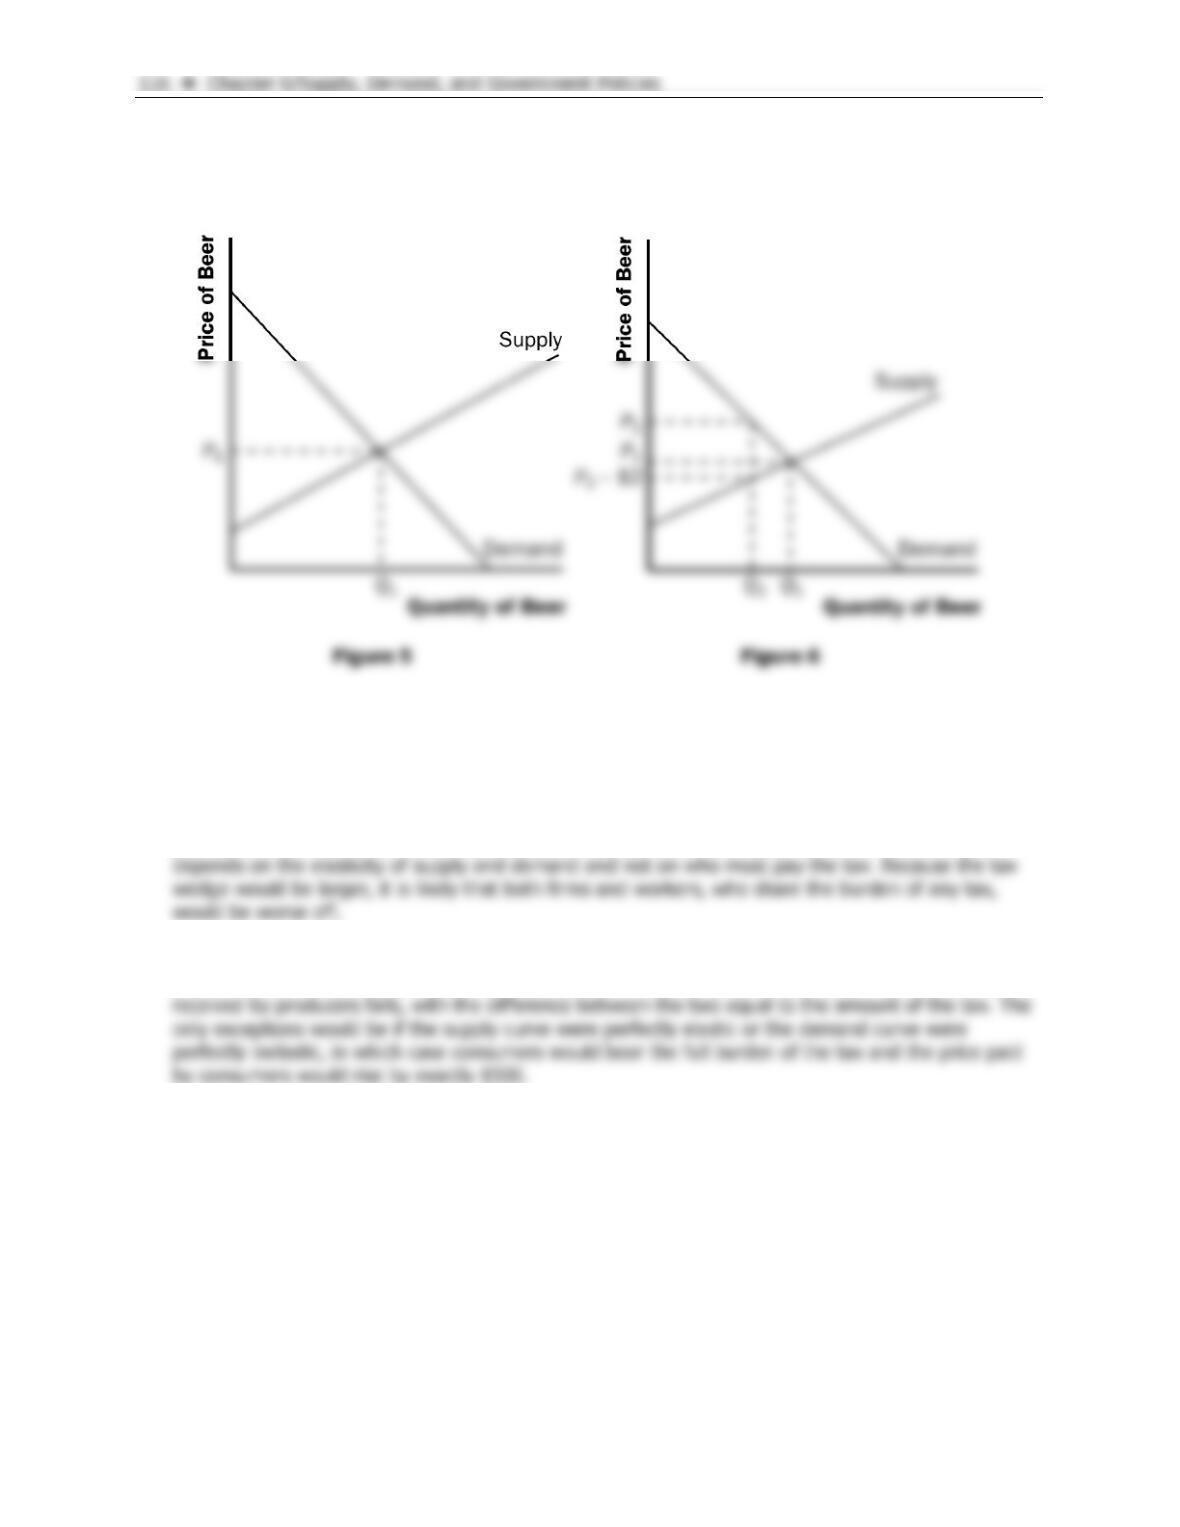
4. a. Figure 5 shows the market for beer without the tax. The equilibrium price is
P
1 and the
equilibrium quantity is
Q
1. The price paid by consumers is the same as the price received by
producers.
b. When the tax is imposed, it drives a wedge of $2 between supply and demand, as shown in
Figure 6. The price paid by consumers is
P
2, while the price received by producers is
P
2 – $2. The quantity of beer sold declines to
Q
2.
5. Reducing the payroll tax paid by firms and using part of the extra revenue to reduce the payroll tax
paid by workers would not make workers better off, because the division of the burden of a tax
6. Because a luxury car likely has an elastic demand, the price will rise by less than $500. The burden of
any tax is shared by both producers and consumers⎯the price paid by consumers rises and the price
Chapter 6/Supply, Demand, and Government Policies ❖ 117
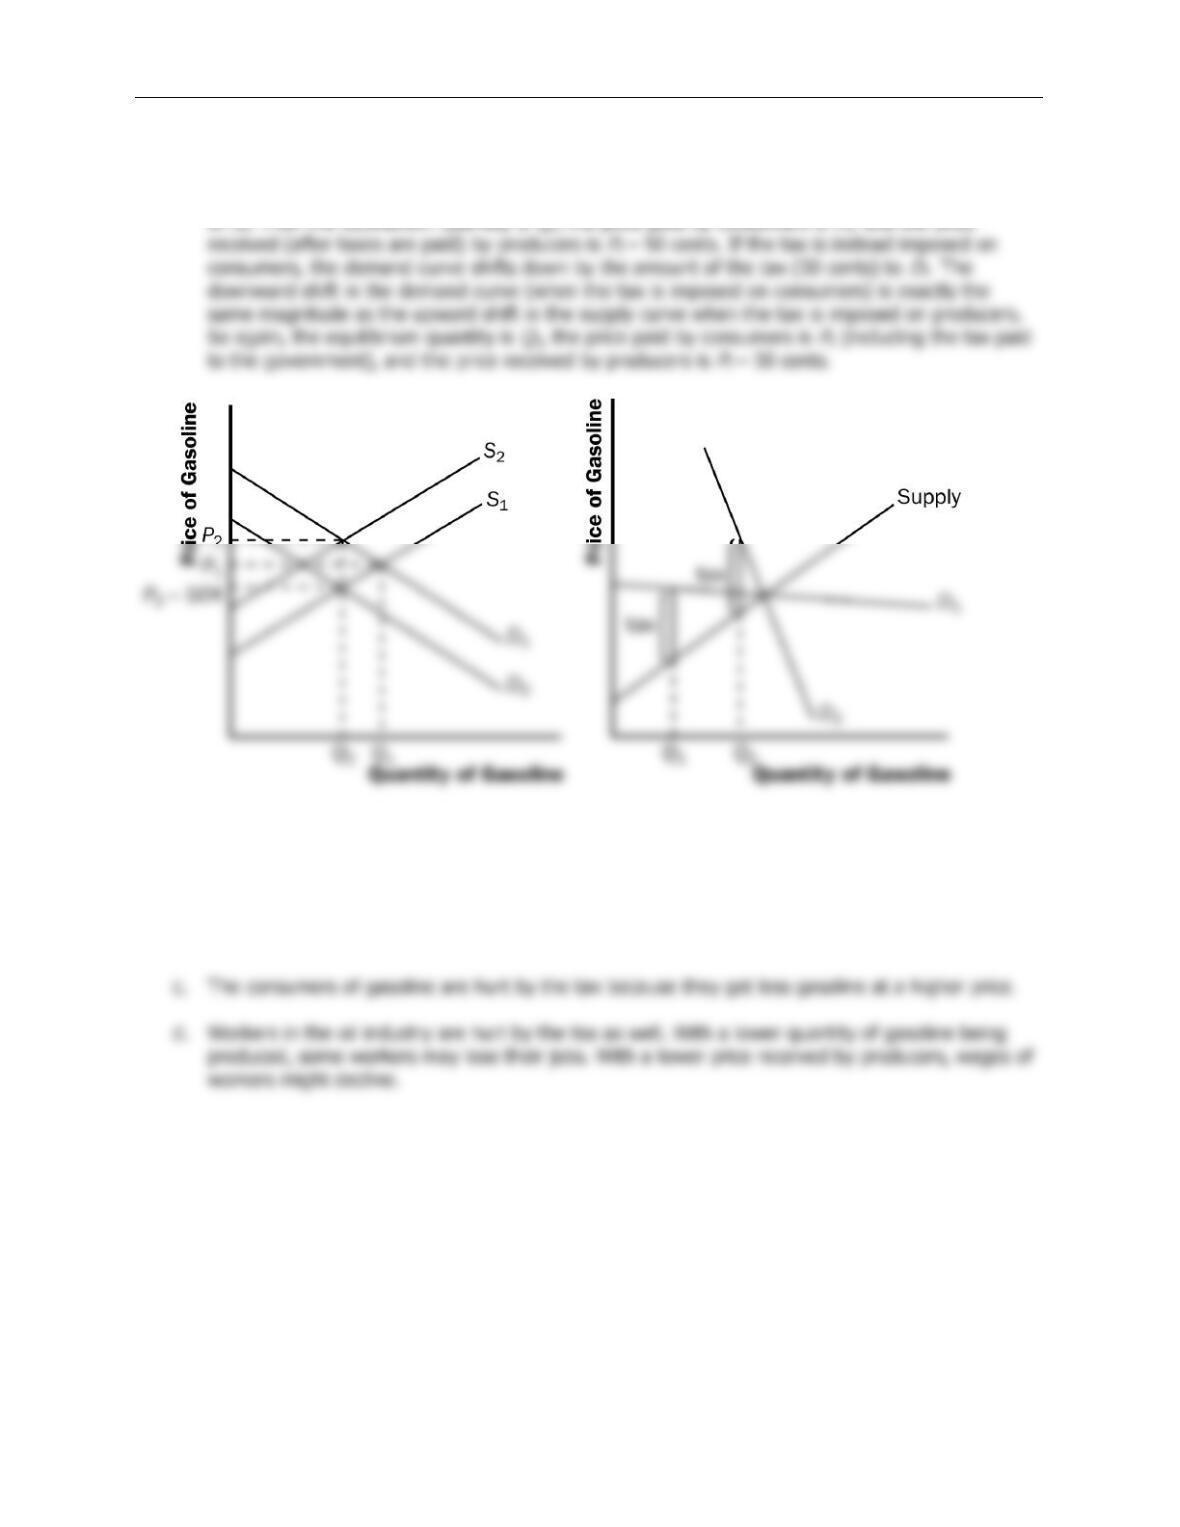
7. a. It does not matter whether the tax is imposed on producers or consumers⎯the effect will be the
same. With no tax, as shown in Figure 7, the demand curve is
D
1 and the supply curve is
S
1. If
the tax is imposed on producers, the supply curve shifts up by the amount of the tax (50 cents)
Figure 7 Figure 8
b. The more elastic the demand curve is, the more effective this tax will be in reducing the quantity
of gasoline consumed. Greater elasticity of demand means that quantity falls more in response to
the rise in the price of gasoline. Figure 8 illustrates this result. Demand curve
D
1 represents an
elastic demand curve, while demand curve
D
2 is more inelastic. The tax will cause a greater
decline in the quantity sold when demand is elastic.
118 ❖ Chapter 6/Supply, Demand, and Government Policies
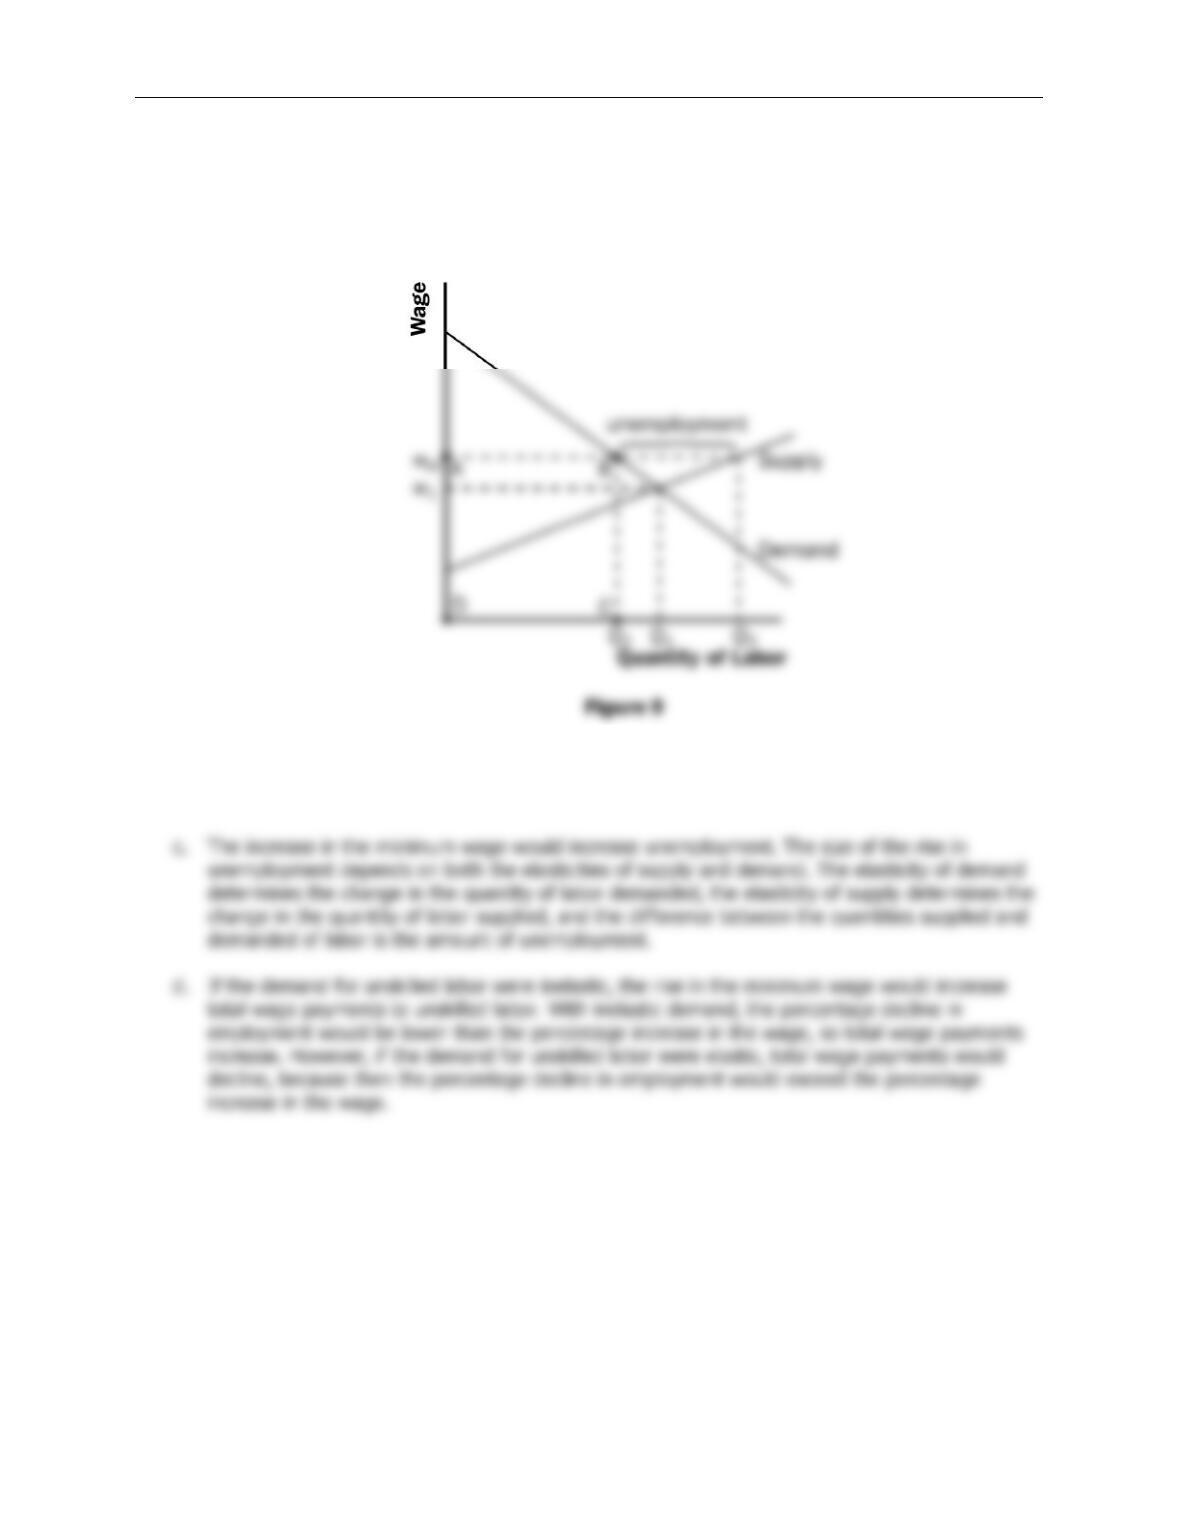
8. a. Figure 9 shows the effects of the minimum wage. In the absence of the minimum wage, the
market wage would be
w
1 and
Q
1 workers would be employed. With the minimum wage (
w
m)
imposed above
w
1, the market wage is
w
m, the number of employed workers is
Q
2, and the
number of workers who are unemployed is
Q
3 −
Q
2. Total wage payments to workers are shown
as the area of rectangle ABCD, which equals
w
m times
Q
2.
b. An increase in the minimum wage would decrease employment. The size of the effect on
employment depends only on the elasticity of demand. The elasticity of supply does not matter,
because there is a surplus of labor.
Chapter 6/Supply, Demand, and Government Policies ❖ 119
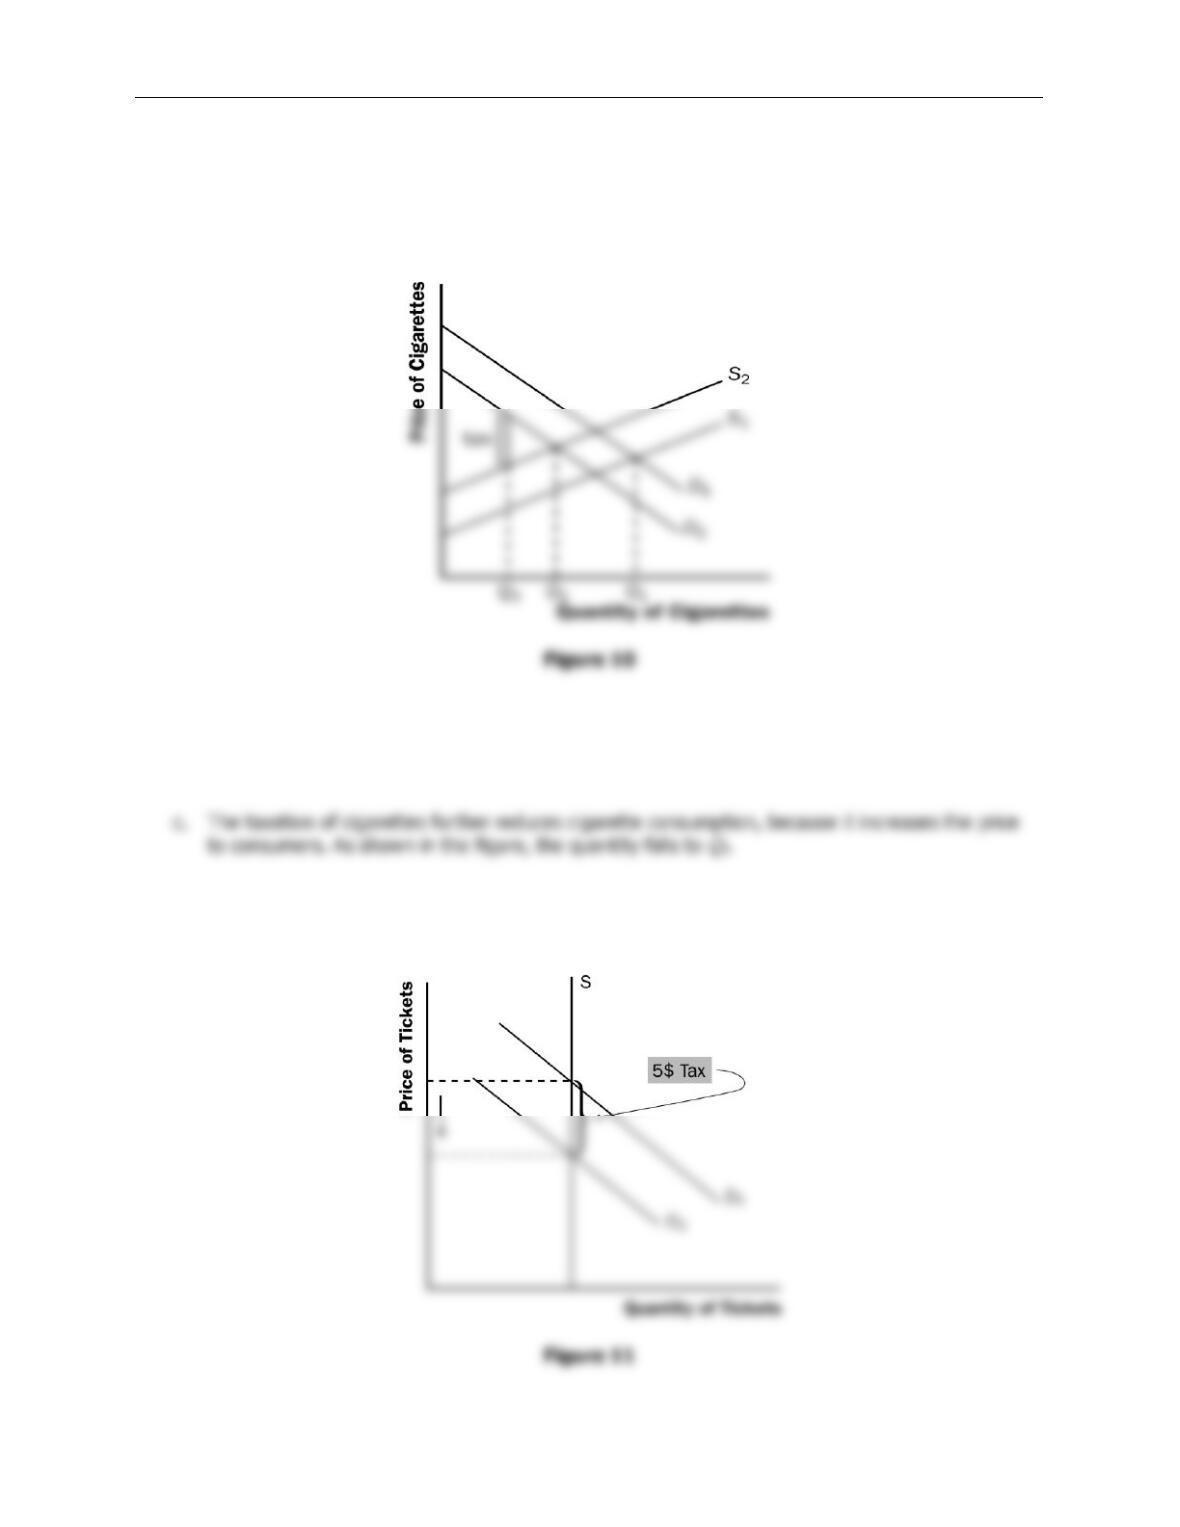
9. a. Programs aimed at making the public aware of the dangers of smoking reduce the demand for
cigarettes, shown in Figure 10 as a shift from demand curve
D
1 to
D
2. The price support program
increases the price of tobacco, which is the main ingredient in cigarettes. As a result, the supply
of cigarettes shifts to the left, from
S
1 to
S
2. The effect of both programs is to reduce the
quantity of cigarette consumption from
Q
1 to
Q
2.
b. The combined effect of the two programs on the price of cigarettes is ambiguous. The education
campaign reduces demand for cigarettes, which tends to reduce the price. The tobacco price
supports raising the cost of production of cigarettes, which tends to increase the price. The end
result on price depends on the relative sizes of these two effects.
10. Since the supply of seats is perfectly inelastic, the entire burden of the tax will fall on the team’s
owners. Figure 11 shows that the price the buyers pay for the tickets will fall by the exact amount of
the tax.
120 ❖ Chapter 6/Supply, Demand, and Government Policies
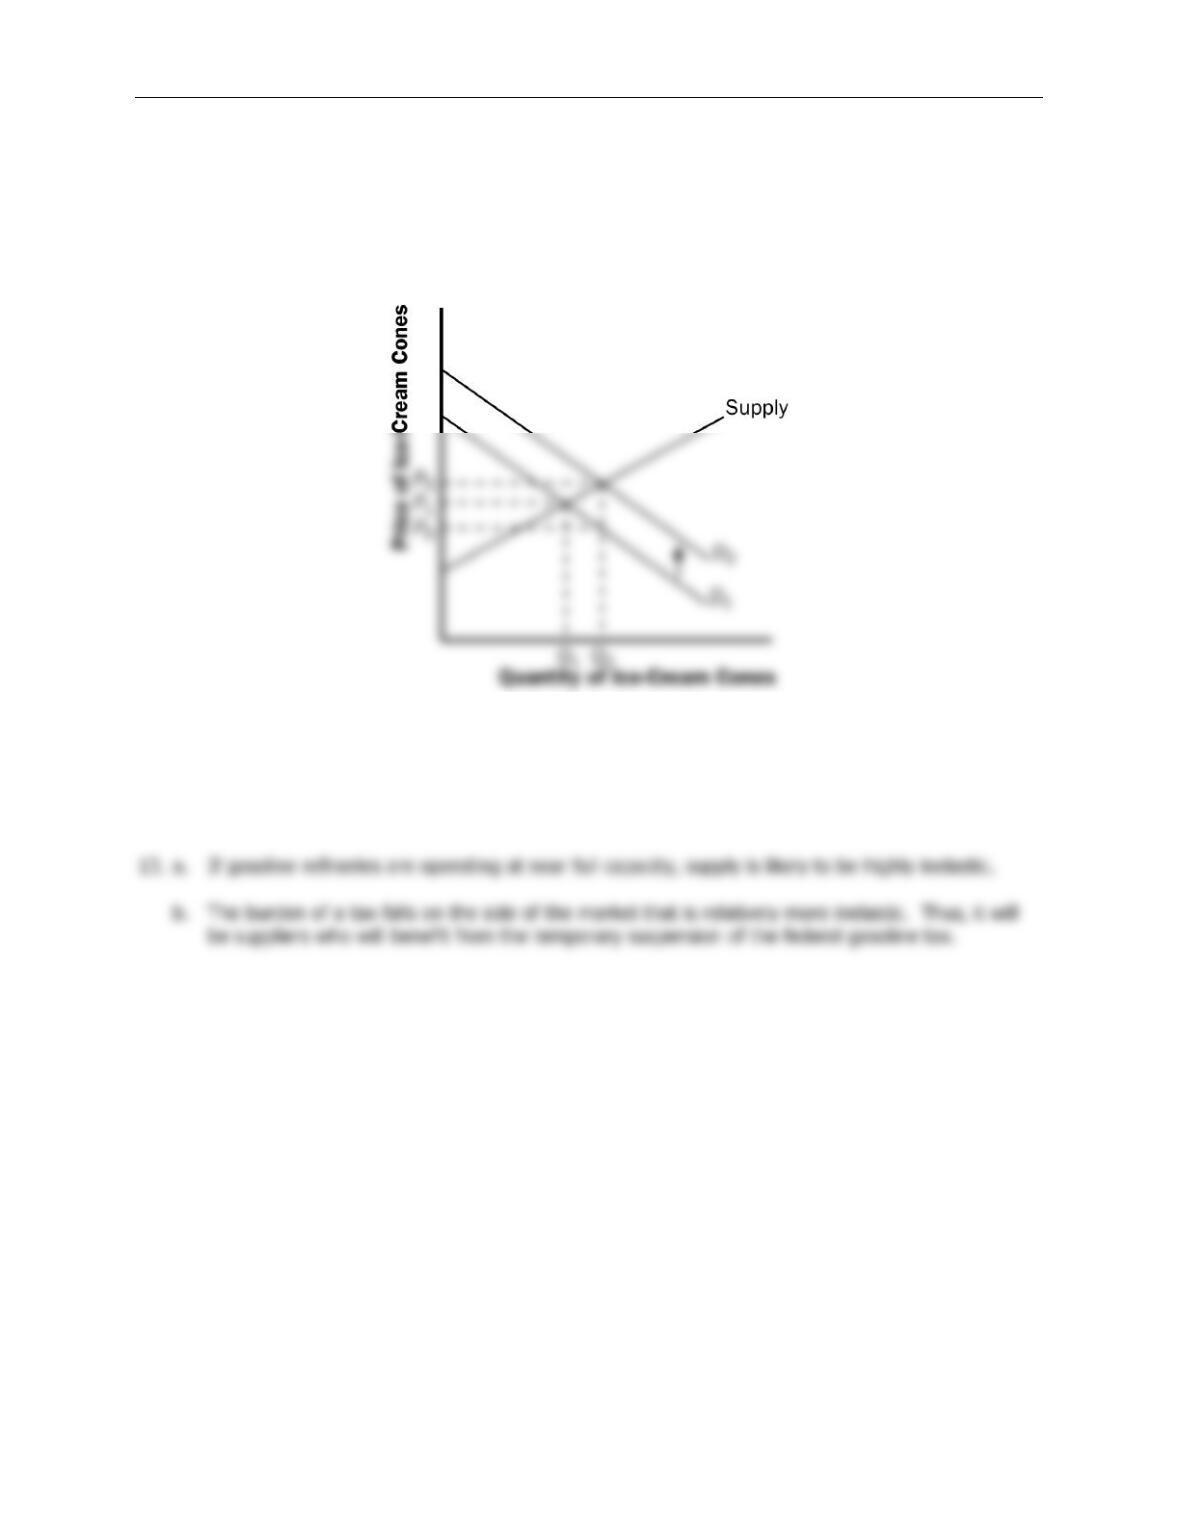
11. a. The effect of a $0.50 per cone subsidy is to shift the demand curve up by $0.50 at each quantity,
because at each quantity a consumer’s willingness to pay is $0.50 higher. The effects of such a
subsidy are shown in Figure 12. Before the subsidy, the price is
P
1. After the subsidy, the price
received by sellers is
P
S and the effective price paid by consumers is
P
D, which equals
P
S minus
$0.50. Before the subsidy, the quantity of cones sold is
Q
1; after the subsidy the quantity
increases to
Q
2.
Figure 12
b. Because of the subsidy, consumers are better off, because they consume more at a lower price.
Producers are also better off, because they sell more at a higher price. The government loses,
because it has to pay for the subsidy.