21
Problem 6.9
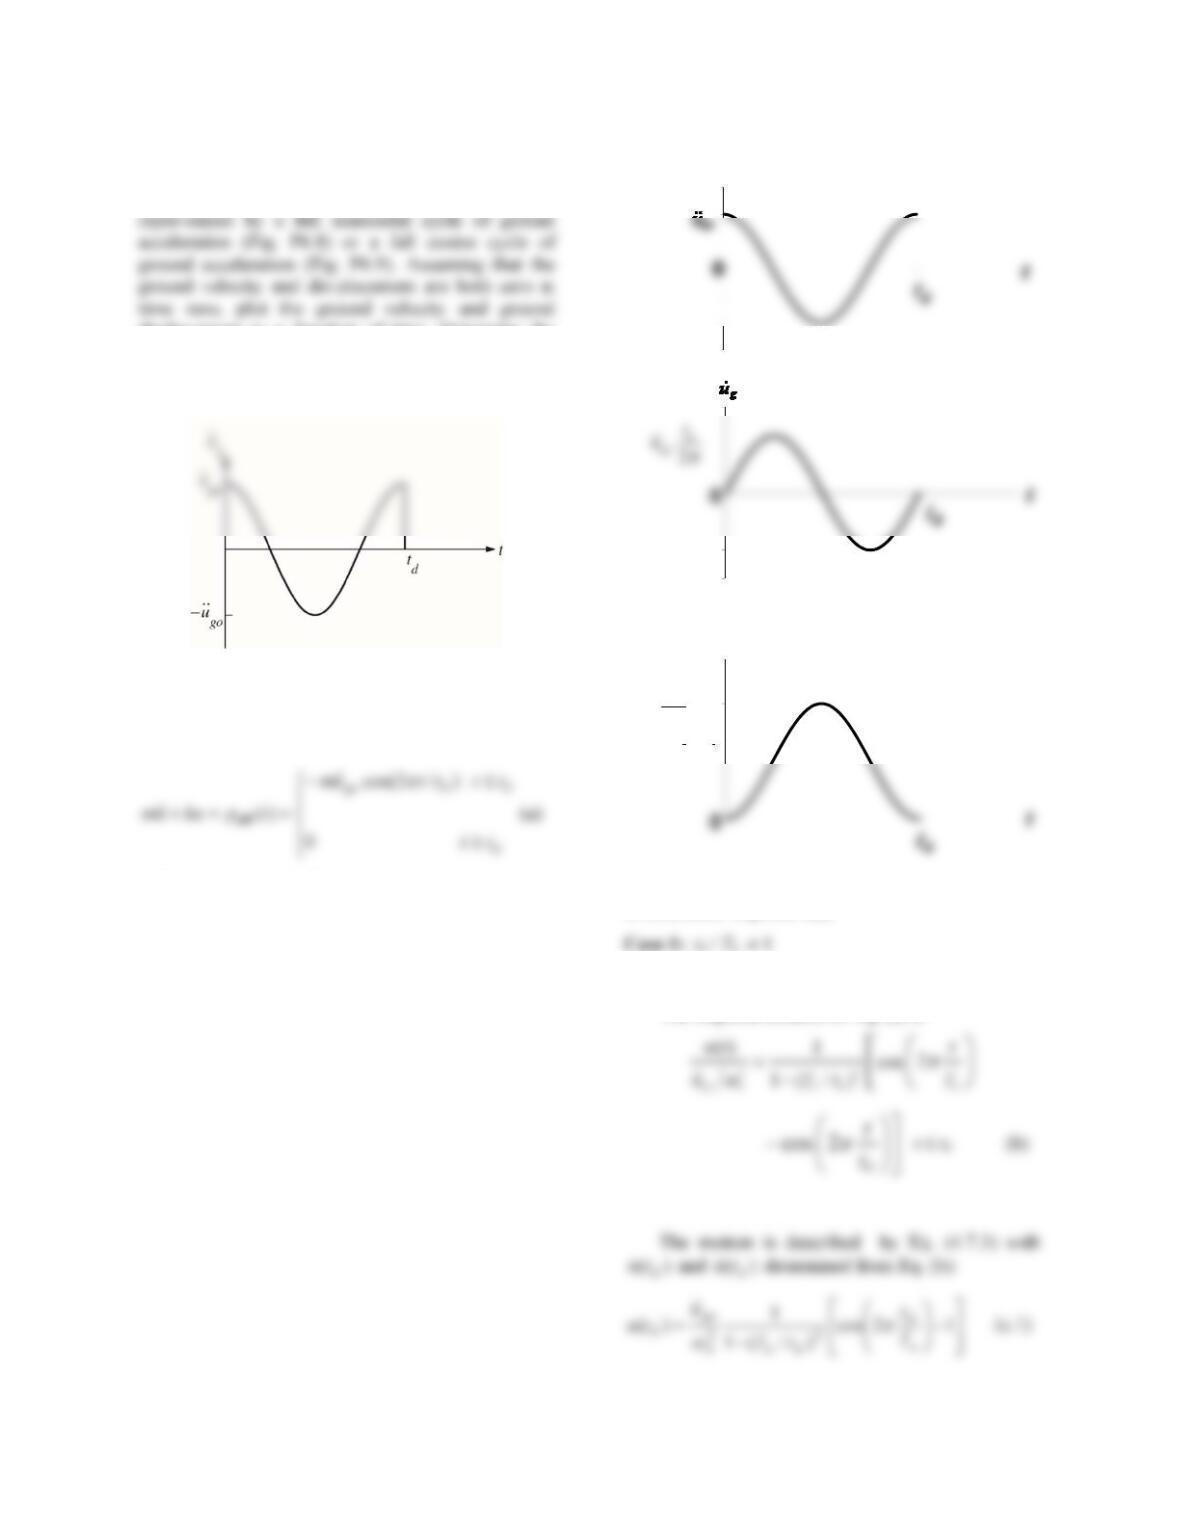
Certain types of near-fault ground motion can be
displacement as a function of time. Determine the
pseudo-acceleration response spectrum for undamped
systems. Plot this spectrum against td / Tn. How will
the true-acceleration response spectrum differ?
Figure P6.9
Solution
The equation of motion to be solved is
with at rest initial conditions.
1. Determine response u(t).
Forced Vibration Phase
The response solution of Eq. (a) is
Free Vibration Phase
t
2
22
d
g
t
u
g
u
g
u

22
n
d
dnn
go
dT
t
tT
u
tu
2sin
)/(1
1
)( 2
(c.2)
Substituting Eq. (c) in Eq. (4.7.3) gives
2
122
cos cos ( )
1( / )
dd
nn
nd
ttt
TT
Tt
)(
2
cos
2
cos
)/(1
1
2d
n
d
n
dn
tt
T
t
T
tT
Case 2: td/Tn = 1
Forced Vibration Phase
The forced response is
Free Vibration Phase
From Eq. (e) determine
The second equation implies that the displacement in
the forced vibration phase reaches its maximum at
the end of this phase. Substituting Eq. (f) in Eq.
2. Plot response history.
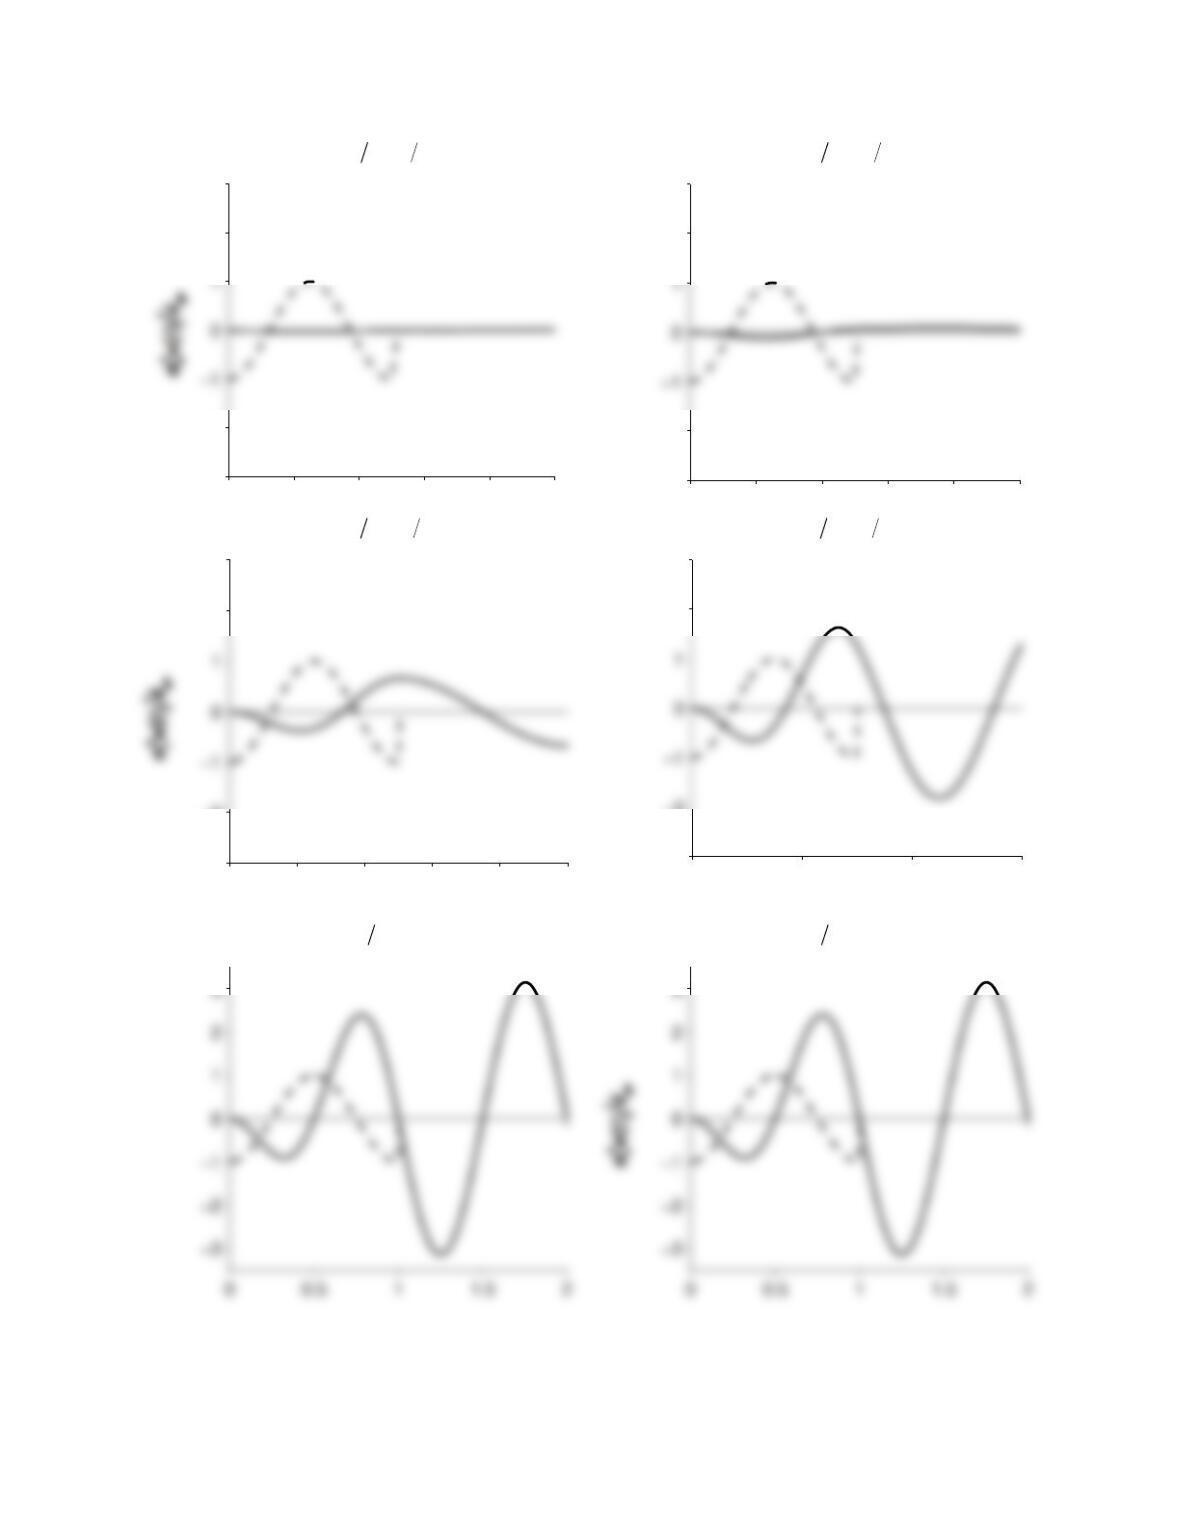
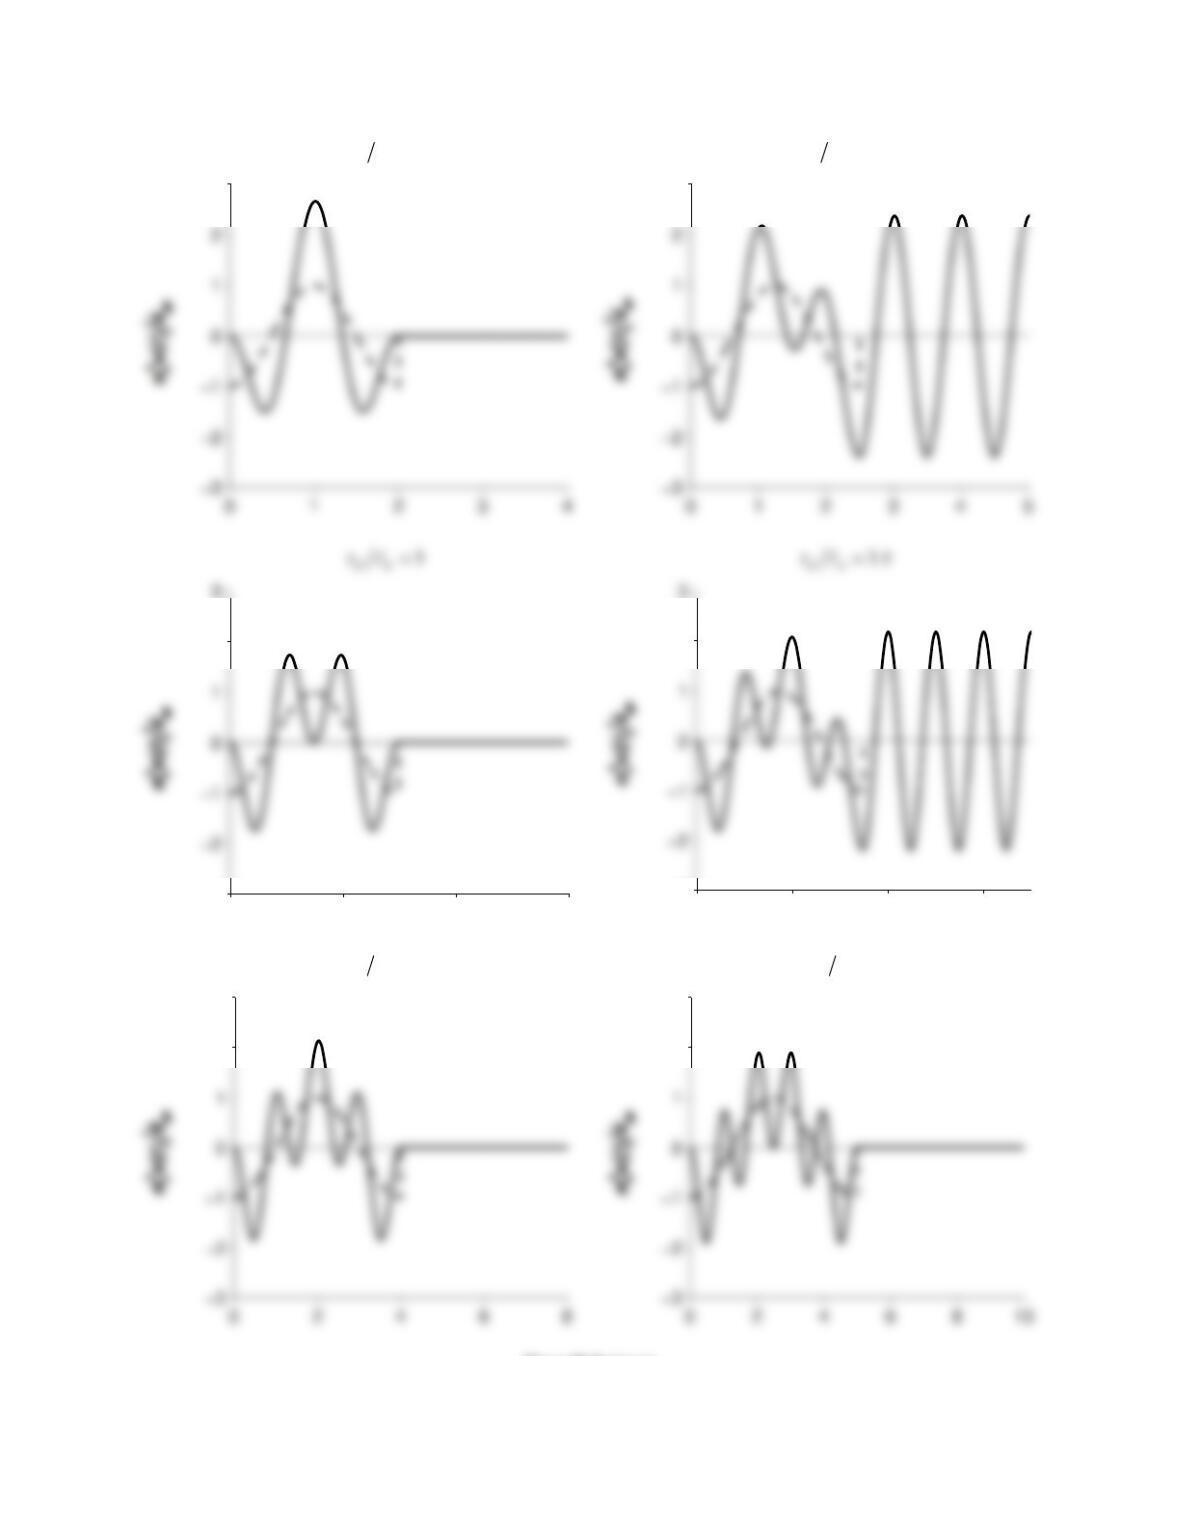
The time variation of the normalized
deformation, ut u
go n
()(
)
2, given by Eqs. (b) and
23
18
dn
tT 41
nd Tt
21
nd Tt 34
dn
tT
1
nd Tt 5.1
nd Tt
Figure P6.9a
0 0.05 0.1 0.15 0.2 0.2
5
−3
−2
2
3
0 0.1 0.2 0.3 0.4 0.
5
−3
−2
2
3
0 0.2 0.4 0.6 0.8
1
−3
−2
2
3
0 0.5 1 1.
5
−3
−2
2
3
2
2
24
2
dn
tT 2.5
dn
tT
4
nd Tt 5
nd Tt
Figure P6.9a (cont.)
3
3
024
6
−3
2
0 2 4 6
−3
2
2
3
2
3
4
5
25
3. Determine maximum response.
gives
2
2sin( / )
(/) 1
dn
go n d
A
tT
uTt
(i)
20
() 3/4 3/4
n
go go
ut A
uu
(j)
4. True acceleration response spectrum.
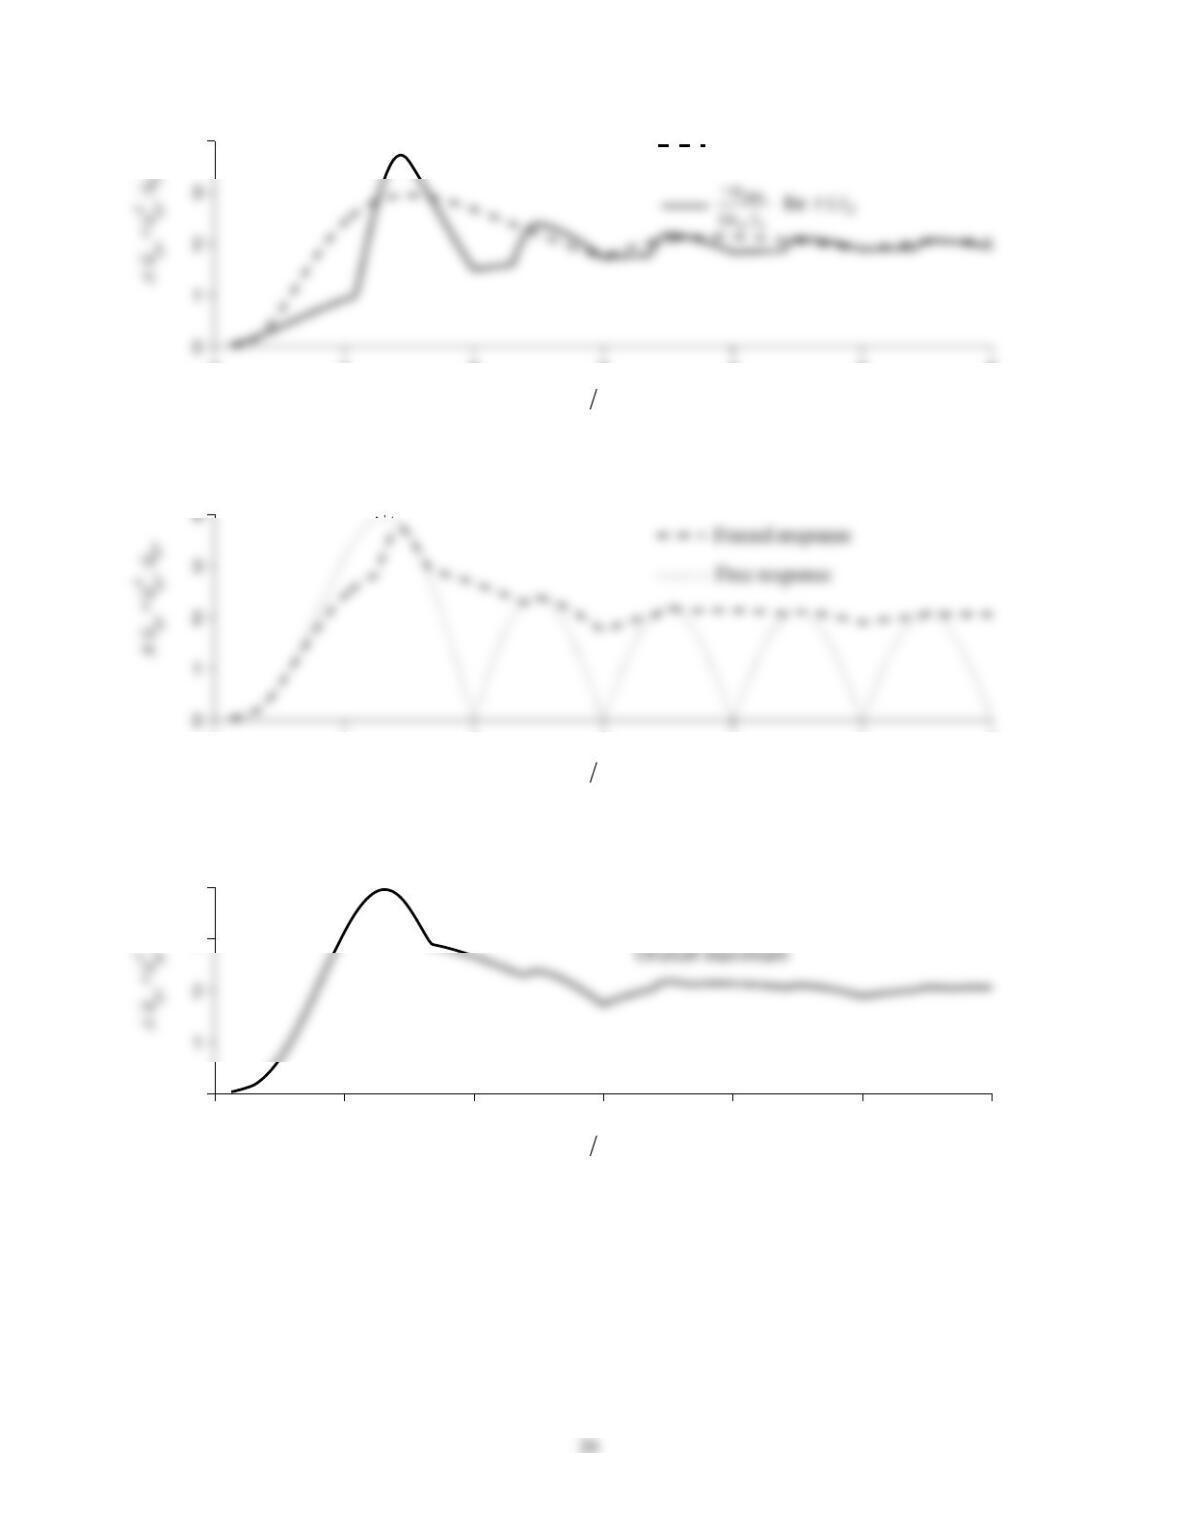
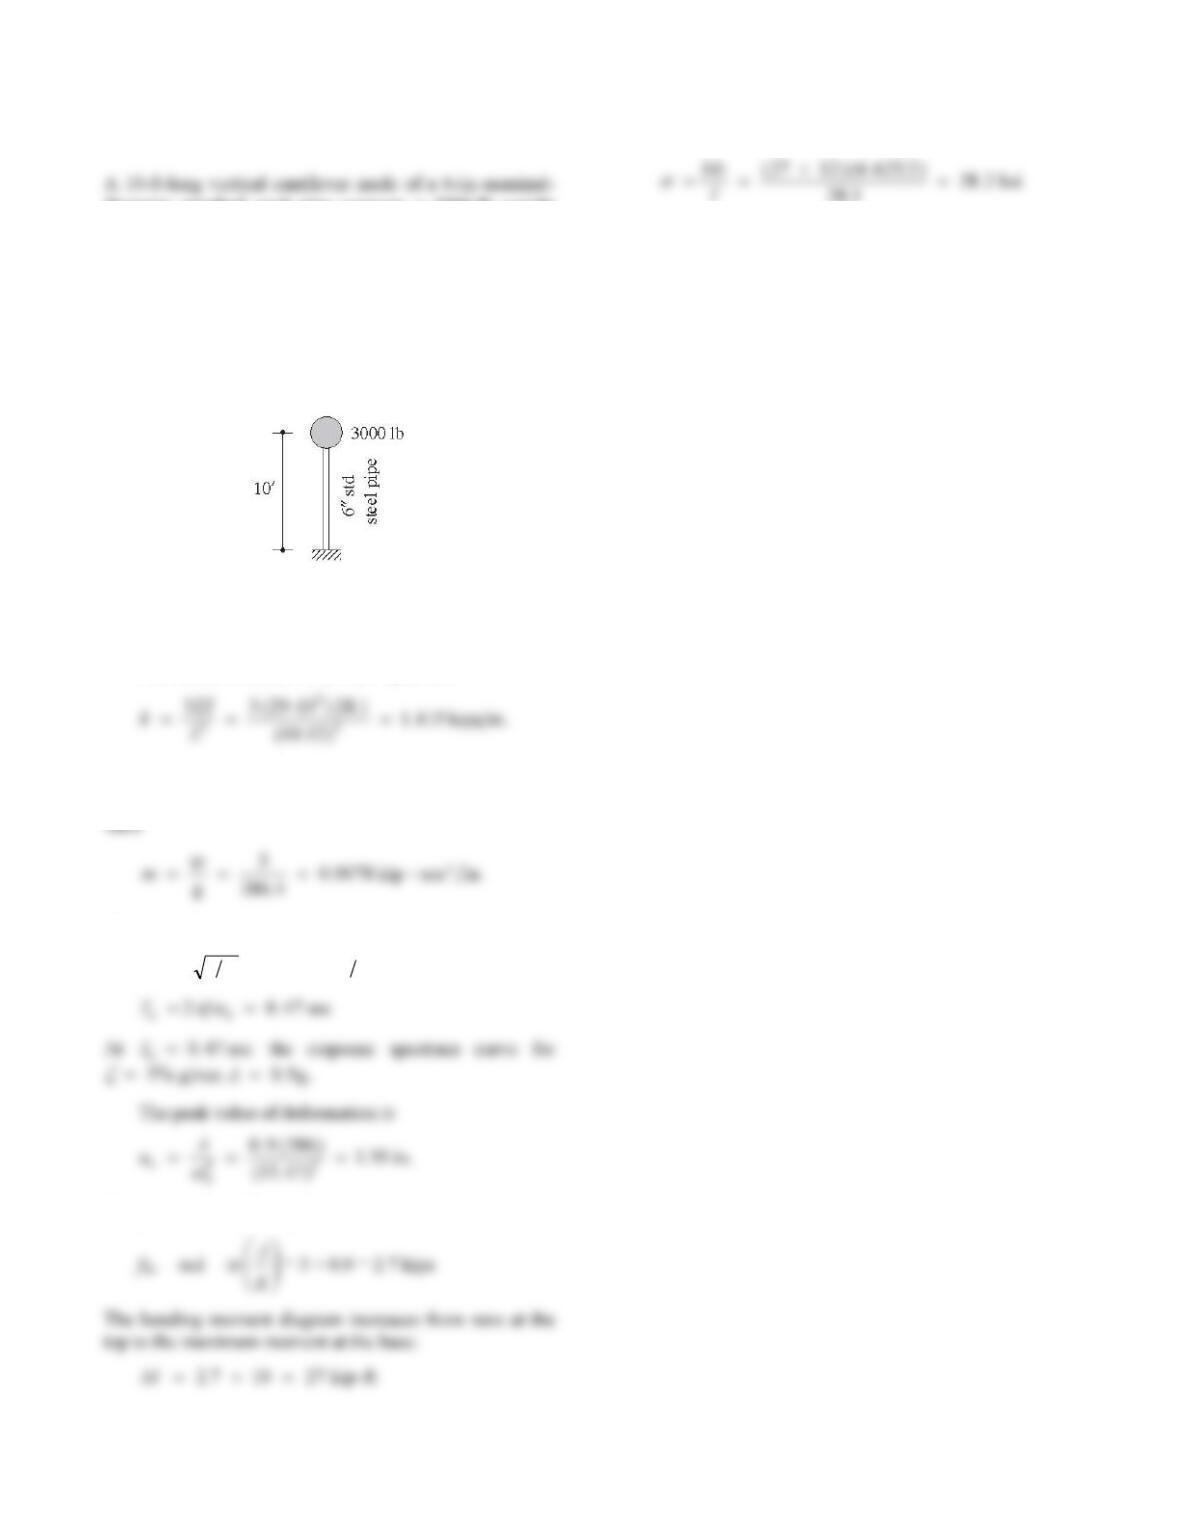
As shown in Section 6.3, for undamped systems:
nd Tt
Figure P6.9b
nd Tt
Figure P6.9c
go
u
/
nd Tt
Figure P6.9d
0 1 2 3 4 5 6
4
0 1 2 3 4 5 6
0 1 2 3 4 5 6
0
3
4
27
Problem 6.10
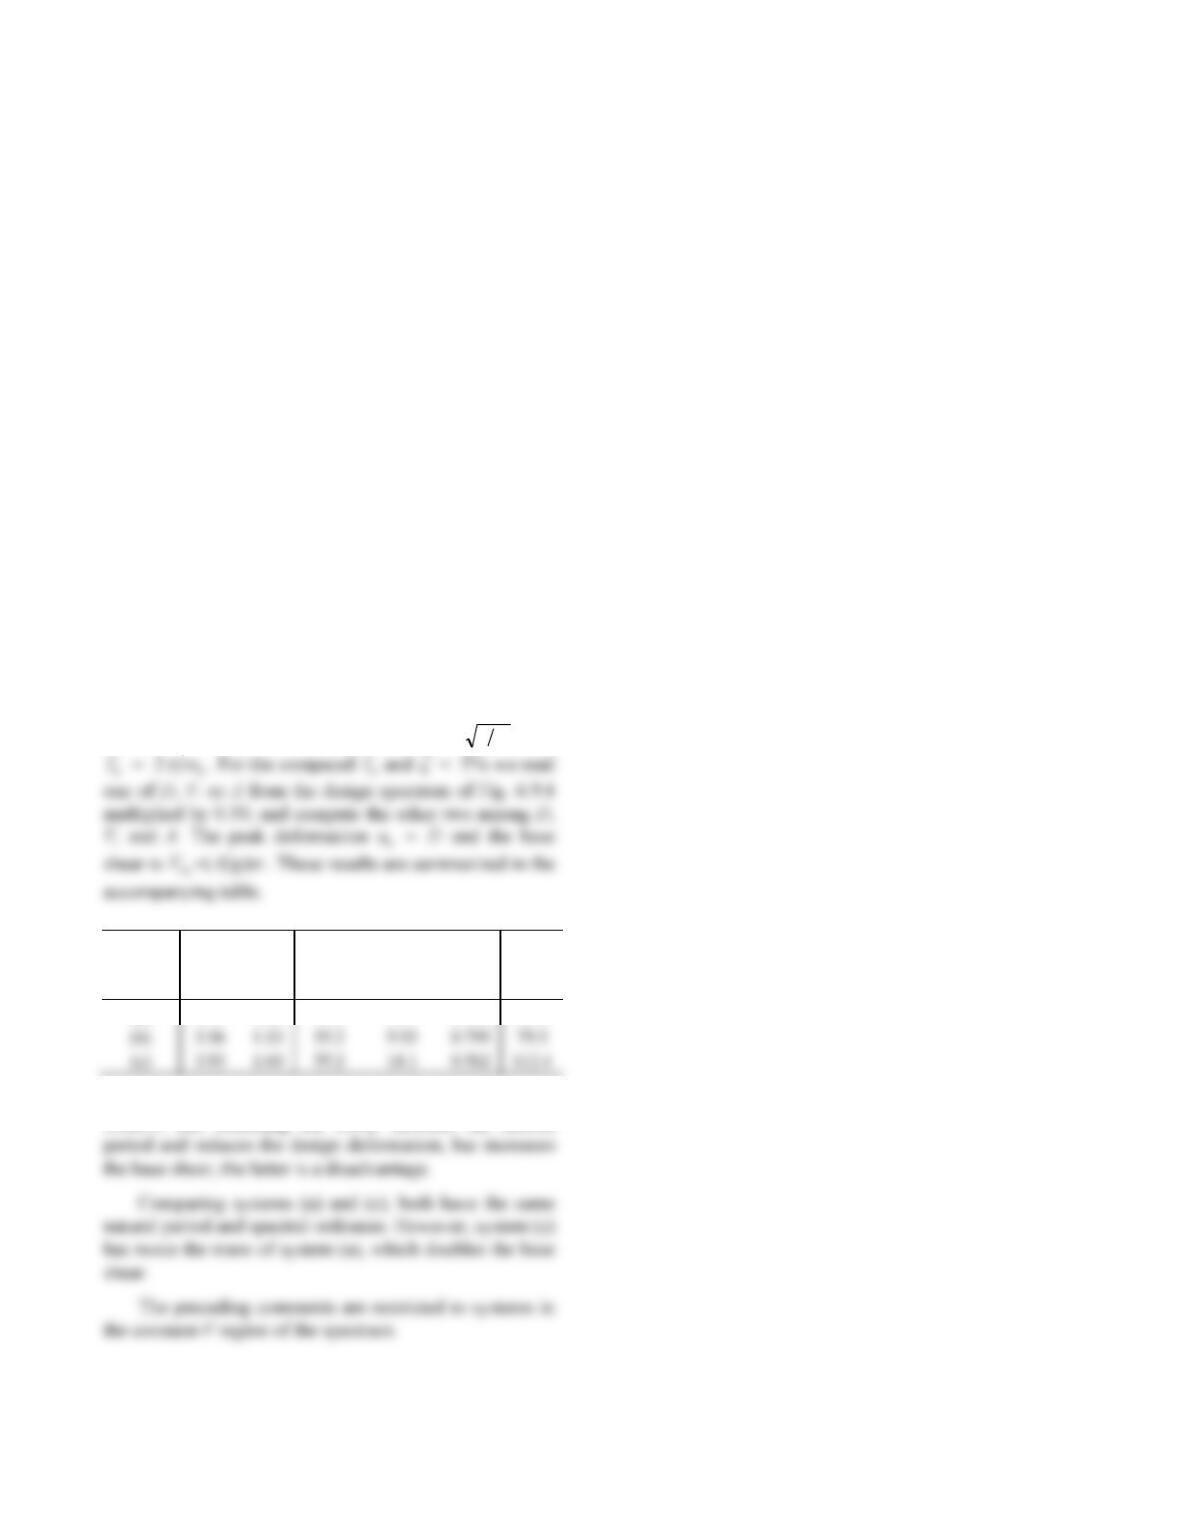
diameter standard steel pipe supports a 3000-lb weight
attached at the tip, as shown in Fig. P6.10. The properties
of the pipe are: outside diameter = 6.625 in., inside
diameter = 6.065 in., thickness = 0.280 in., second
moment of cross-sectional area I = 28.1 in4, Young’s
modulus E = 29,000 ksi, and weight = 18.97 lb/ft length.
Determine the peak deformation and the bending stress in
the cantilever due to the El Centro ground motion; assume
that ζ = 5%.
Figure P6.10
Solution
The lateral stiffness of the SDF system is
The total weight of the pipe is 18.97 10 189.7 lbs ,
which may be neglected relative to the lumped weight.
The natural frequency and period are
nkm13 47. rads sec
The peak value of the equivalent static force is
The maximum bending stress is
I
..
28 1 38 2 ksi
28
Problem 6.11
(a) A full water tank is supported on an 80-ft-high
cantilever tower. It is idealized as an SDF system with
weight w = 100 kips, lateral stiffness k = 4 kips/in., and
damping ratio ζ = 5%. The tower supporting the tank is to
be designed for ground motion characterized by the
design spectrum of Fig. 6.9.5 scaled to 0.5g peak ground
acceleration. Determine the design values of lateral
deformation and base shear.
(b) The deformation computed for the system in part (a)
seemed excessive to the structural designer, who decided
to stiffen the tower by increasing its size. Determine the
design values of deformation and base shear for the
modified system if its lateral stiffness is 8 kips/in.; assume
that the damping ratio is still 5%. Comment on how
stiffening the system has affected the design require-
ments. What is the disadvantage of stiffening the system?
(c) If the stiffened tower were to support a tank weighing
200 kips, determine the design requirements; assume for
purposes of this example that the damping ratio is still
5%. Comment on how the increased weight has affected
the design requirements.
Solution
For each system we compute
nkm and
System
n
sec–1
T
n
sec
V
in./sec D in. A/g Vbo
kips
(a) 3.93 1.60 55.2 14.1 0.562 56.2
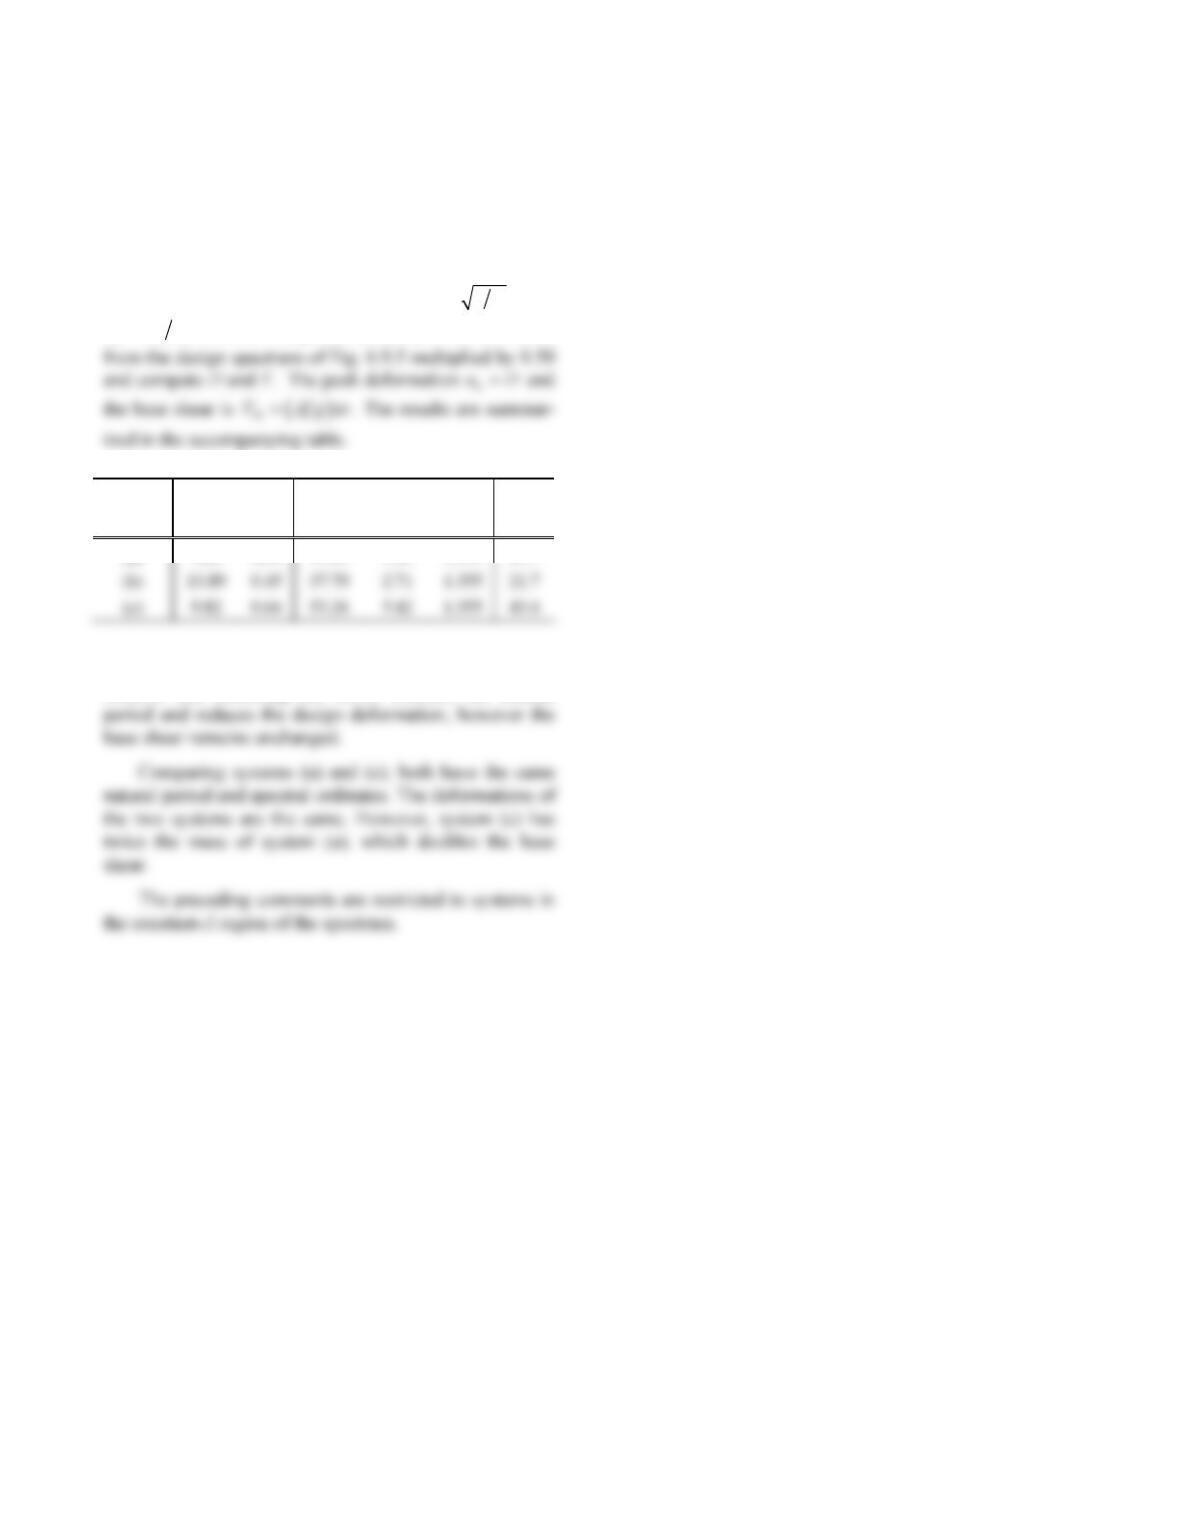
Comparing the response of systems (a) and (b), we
observe that stiffening the tower shortens the natural
29
Problem 6.12
Solve Problem 6.11 modified as follows: w = 16 kips in
part (a) and w = 32 kips in part (c).
Solution
For each system we compute nkm
and
2
nn
T
. For the computed
T
n and
5% we read A
System
n
sec–1
T
n
sec
V in./
sec D in. A/g Vbo
kips
(a) 9.82 0.64 53.24 5.42 1.355 21.7
Comparing the response of systems (a) and (b), we
observe that stiffening the tower shortens the natural
30
Problem 6.13
Solve Problem 6.11 modified as follows: w = 1600 kips in
part (a) and w = 3200 kips in part (c).
Solution
For each system we compute nkm
and
System
n
sec–1
T
n
sec
V
in./sec D in. A/g Vbo
kips
(a) 0.98 6.40 35.5 36.2 0.09 144.7
Comparing the response of systems (a) and (b), we
observe that stiffening the tower shortens the natural
T
Problem 6.14
designed for the design spectrum of Fig. 6.9.5 scaled to a
peak ground acceleration of 0.5g, determine the design
values of lateral deformation and bending moments in the
columns for two conditions:
Solution
(a) Frame with rigid beam ()E
I
b.
Design quantities
Bending moments in the columns are shown in the
accompanying diagram.
(b) Frame with flexible beam ()E
I
0.
3
3
25.02kipsin.
c
EI
kh
Design quantities
uo
27.in.
M, kip-ft
A rigid beam increases the lateral stiffness by a factor

32
Problem 6.15
design earthquake, determine the design values of lateral
deformation and bending moments on the columns.
Comment on the influence of base fixity on the design
deformation and bending moments.
Solution
h =
12‘
24‘
EI
c
For
T
n0 452. sec and
5%, Fig. 6.9.5 scaled
by 0.5 gives
A
A
Design quantities
uo27.in.
The bending moment diagram for each column is as
shown; at the top
the constant-A region of the spectrum, this change in
T
n