Hydrostatic Water in Soils and Rocks Chapter 6
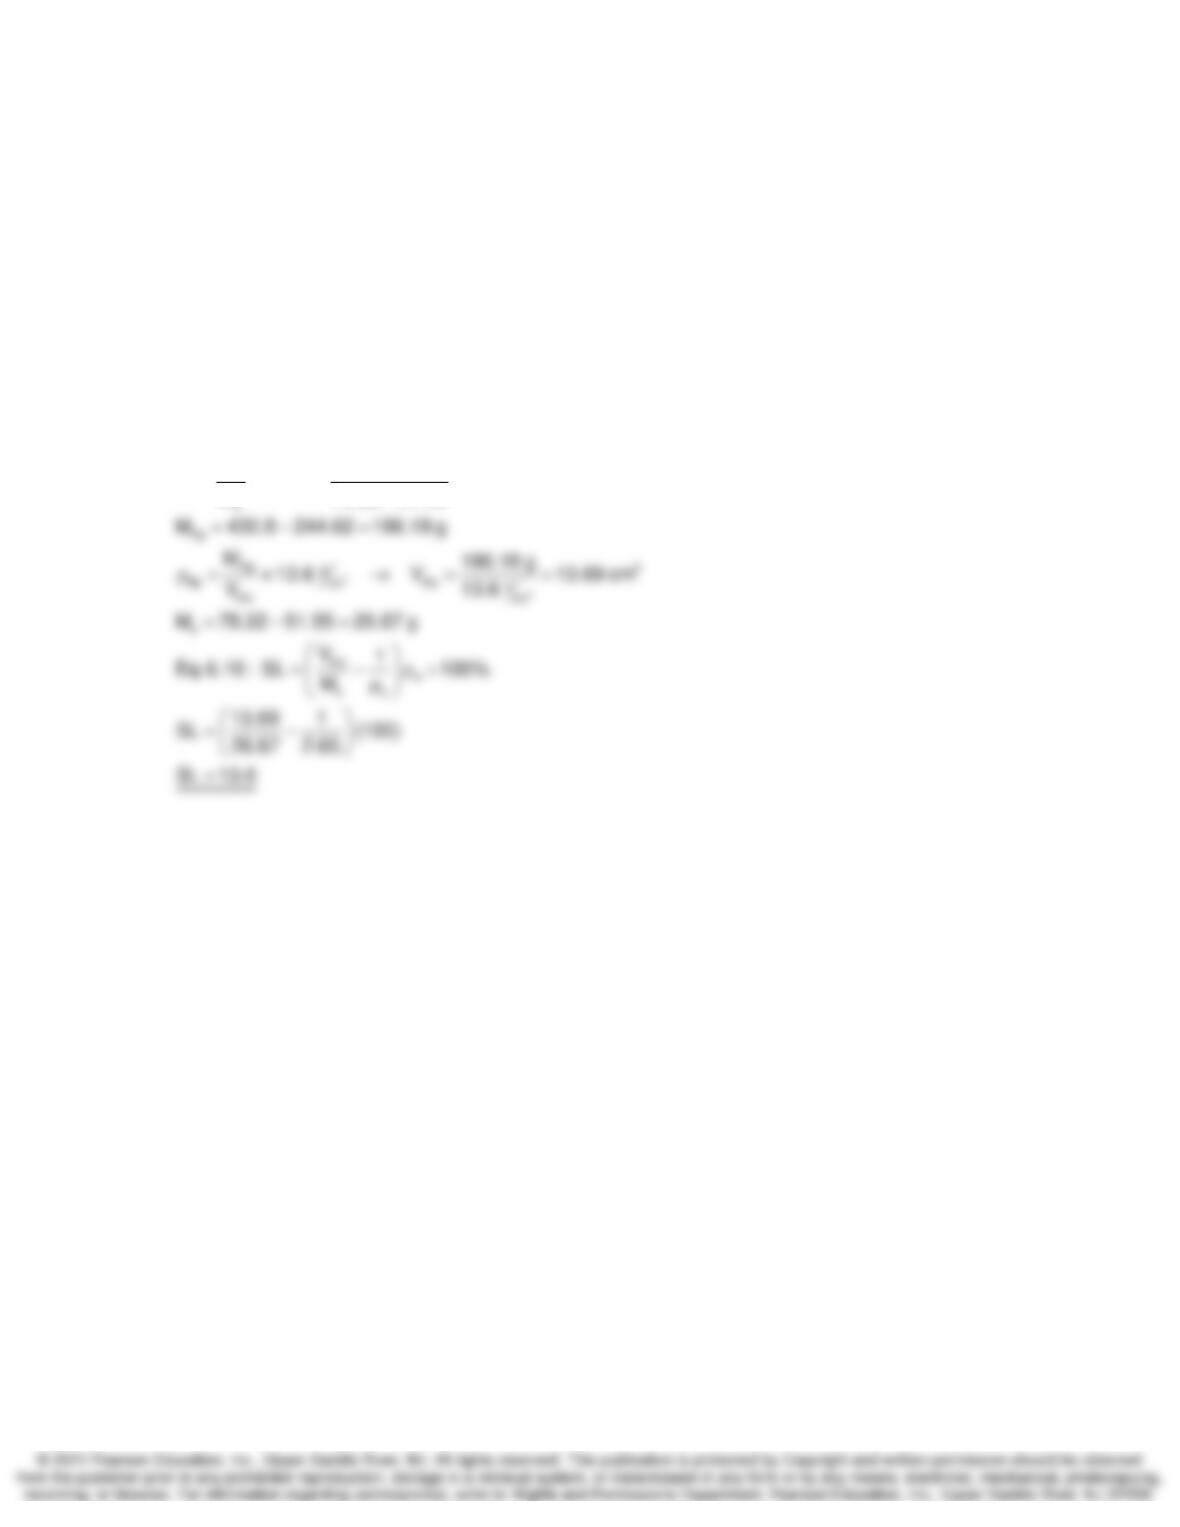
6-20. During the determination of the shrinkage limit of a sandy clay, the following laboratory
data was obtained:
Wet wt. of soil + dish = 91.04 g
Dry wt. of soil + dish = 78.22 g
Wt. of dish = 51.55 g
Volumetric determination of soil pat:
Wt. of dish + mercury = 430.80 g
Wt. of dish = 244.62 g
Calculate the shrinkage limit of the soil, assuming
ρ
s = 2.65 Mg/m3.
SOLUTION:
w
i
M91.04 78.22
w 100% 100 48.07%
M 78.22 51.55
−
=× = ×=
−
Hydrostatic Water in Soils and Rocks Chapter 6
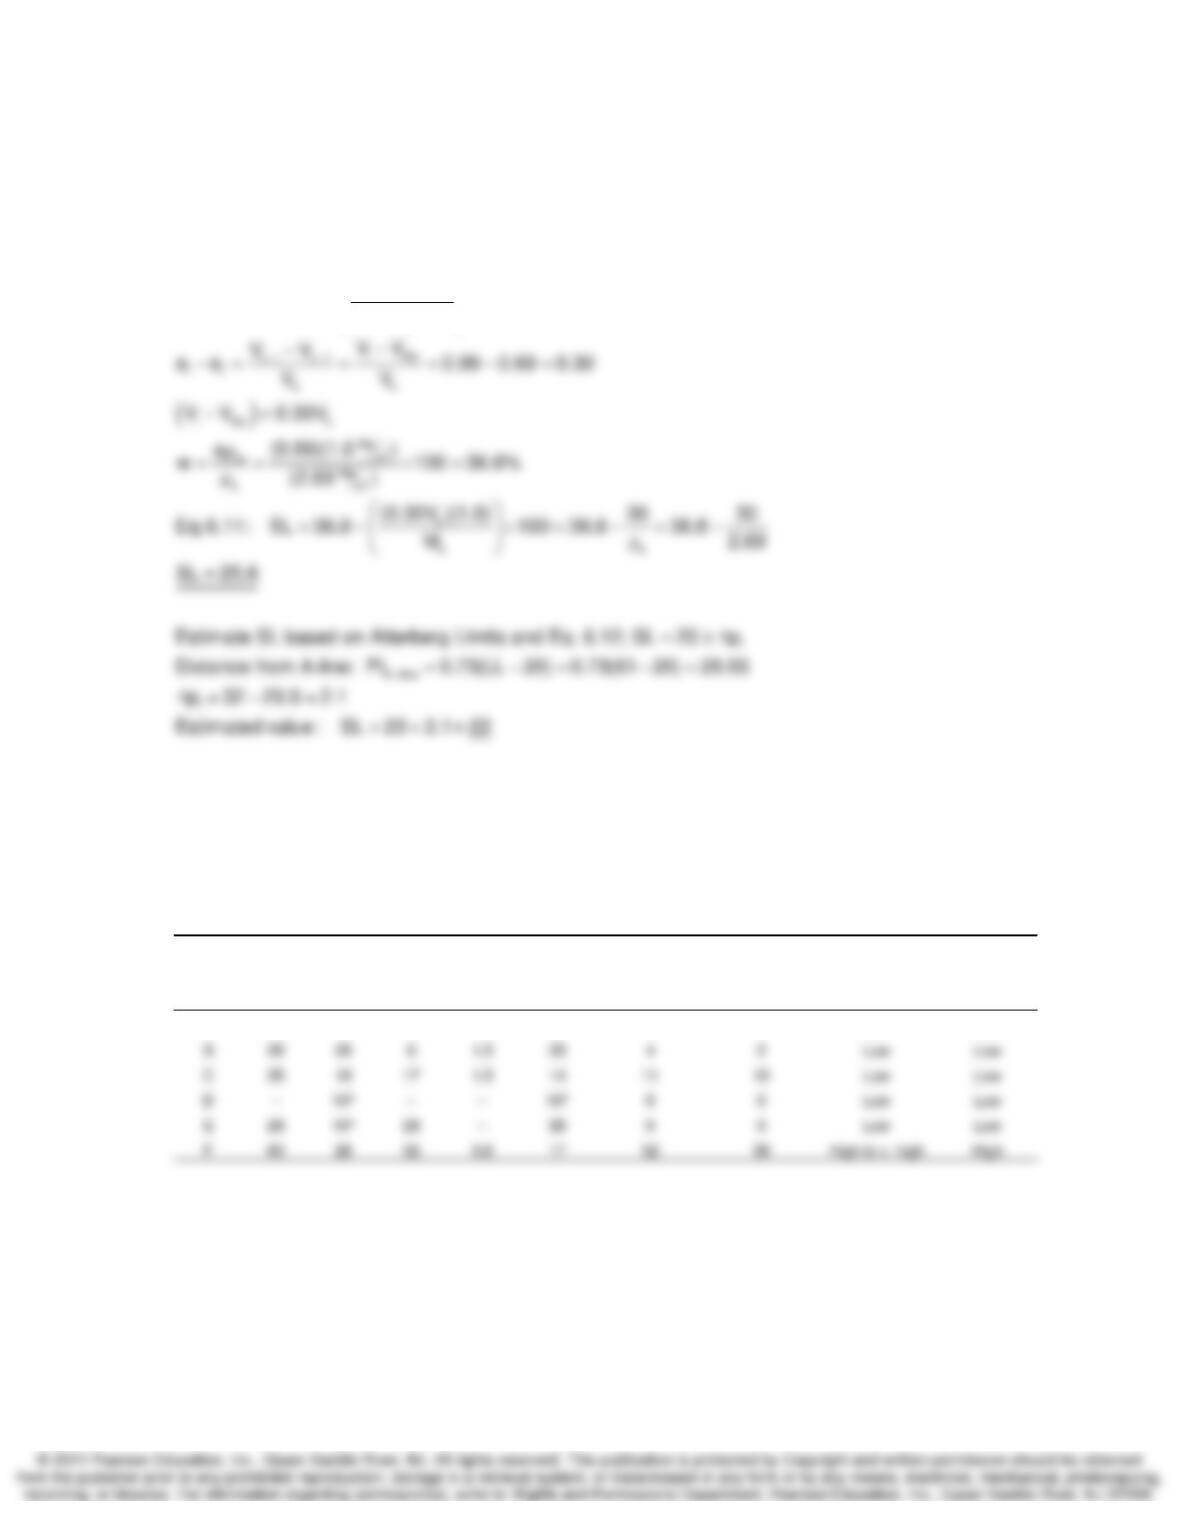
6-21. The LL of a medium sensitive Swedish postglacial clay is 61 and the PI is 32. At its natural
water content, the void ratio is 0.99, while after shrinkage the minimum void ratio is 0.69.
Assuming the density of the soil solids is 2.69, calculate the shrinkage limit of the clay.
SOLUTION:
idryw
i
s
(V V )
Eq. 6.11: SL w 100%
M
−ρ
⎛⎞
=− ×
⎜⎟
⎝⎠
6-23. Estimate the swelling potential of soils A–F, Problems 2.56 and 2.58. Use both Table 6.2
and Fig. 6.21.
SOLUTION:
Expansion Expansion
Potential Potential
SOIL LL PL PI Activity SL p. 0.002 mm p. 0.001 mm (Table 6.2) (Fig. 6.21)
A138 5 –– 10 0 0 Low Low
Hydrostatic Water in Soils and Rocks Chapter 6
6-24. Estimate the frost susceptibility of soils A–F, Problems 2.56 and 2.58, according to Beskow
(Fig. 6.29) and U. S. Army Corps of Engineers frost design classification system (Table 6.5).
SOLUTION:
Frost- Frost-
Susceptibility Susceptibility
SOIL LL PL PI p. 0.002 mm p. 0.001 mm (Fig. 6.29) (Table 6.5)
A 13 8 5 0 0 non FH very low to med.
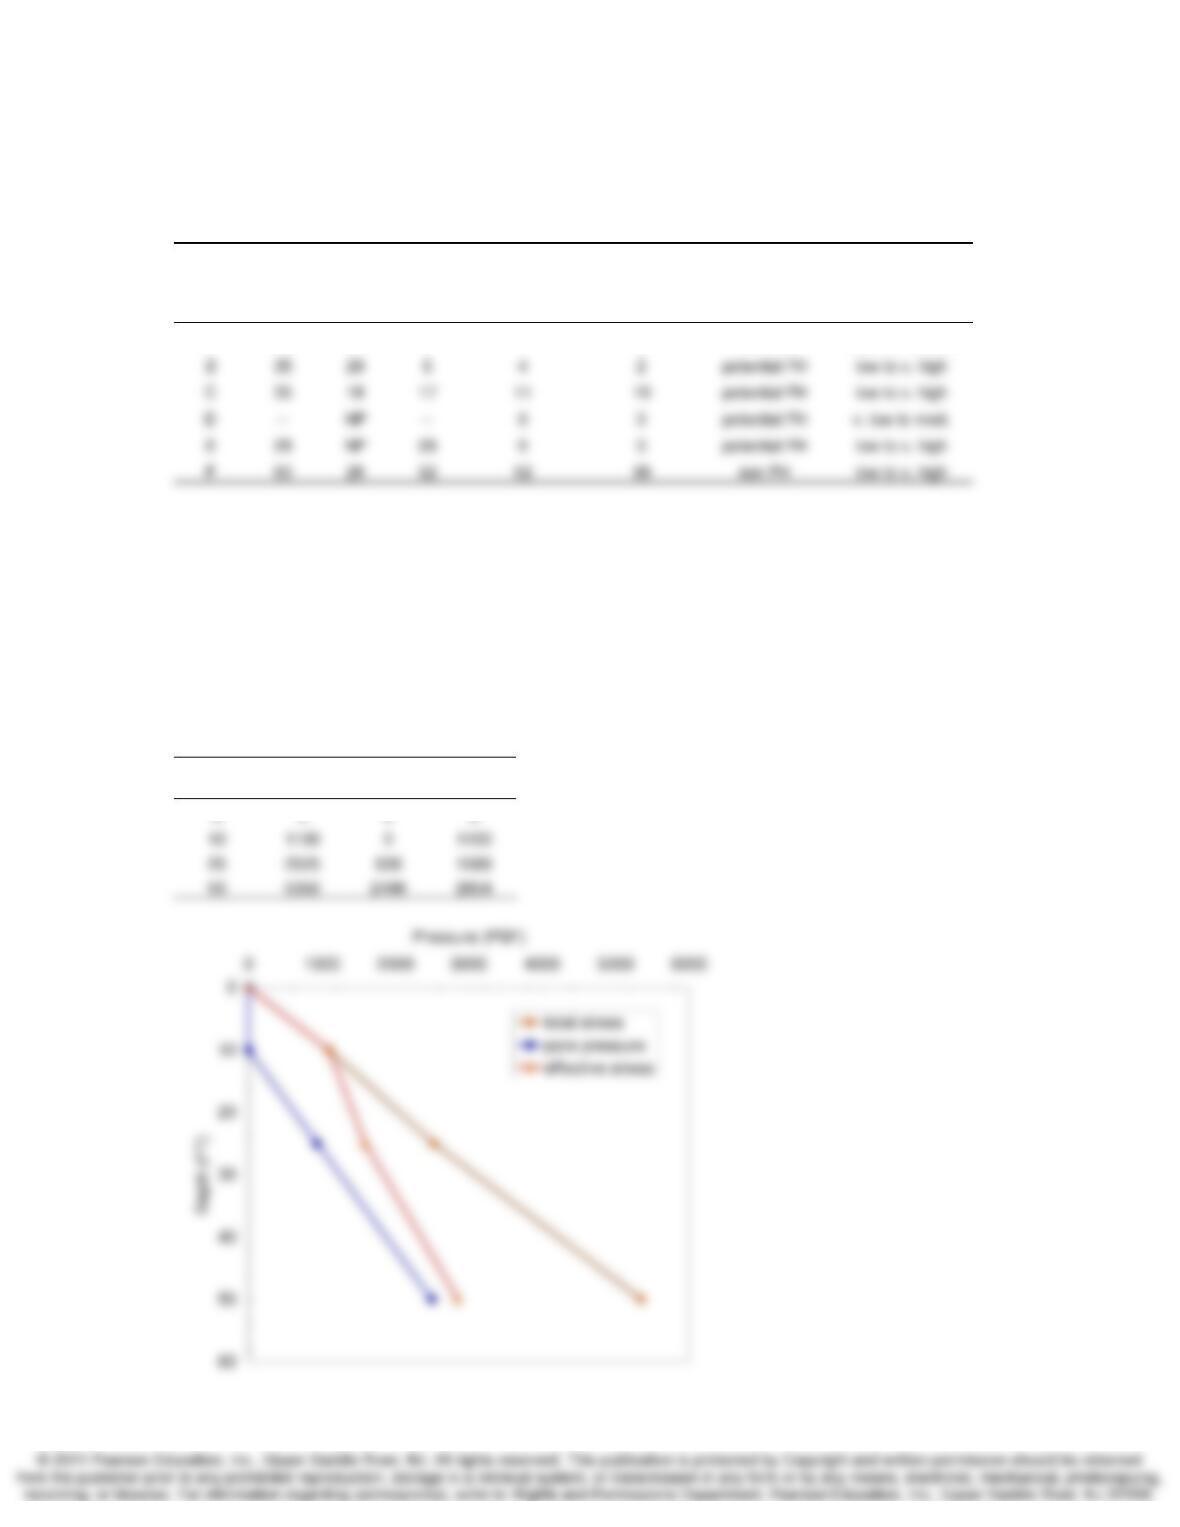
6-27. A soil has the following profile with depth: The water table is at a depth of 10 ft. Plot the
total stress, effective stresses, and pore pressure versus depth. Show all of your calculations.
Assume that there is no capillarity.
0 — 10 ft γt = 110 pcf
10 — 25 ft γt = 95 pcf
25 — 50 ft γt = 113 pcf
SOLUTION:
Depth σuσ‘
(ft) (psf) (psf) (psf)
0000
Hydrostatic Water in Soils and Rocks Chapter 6
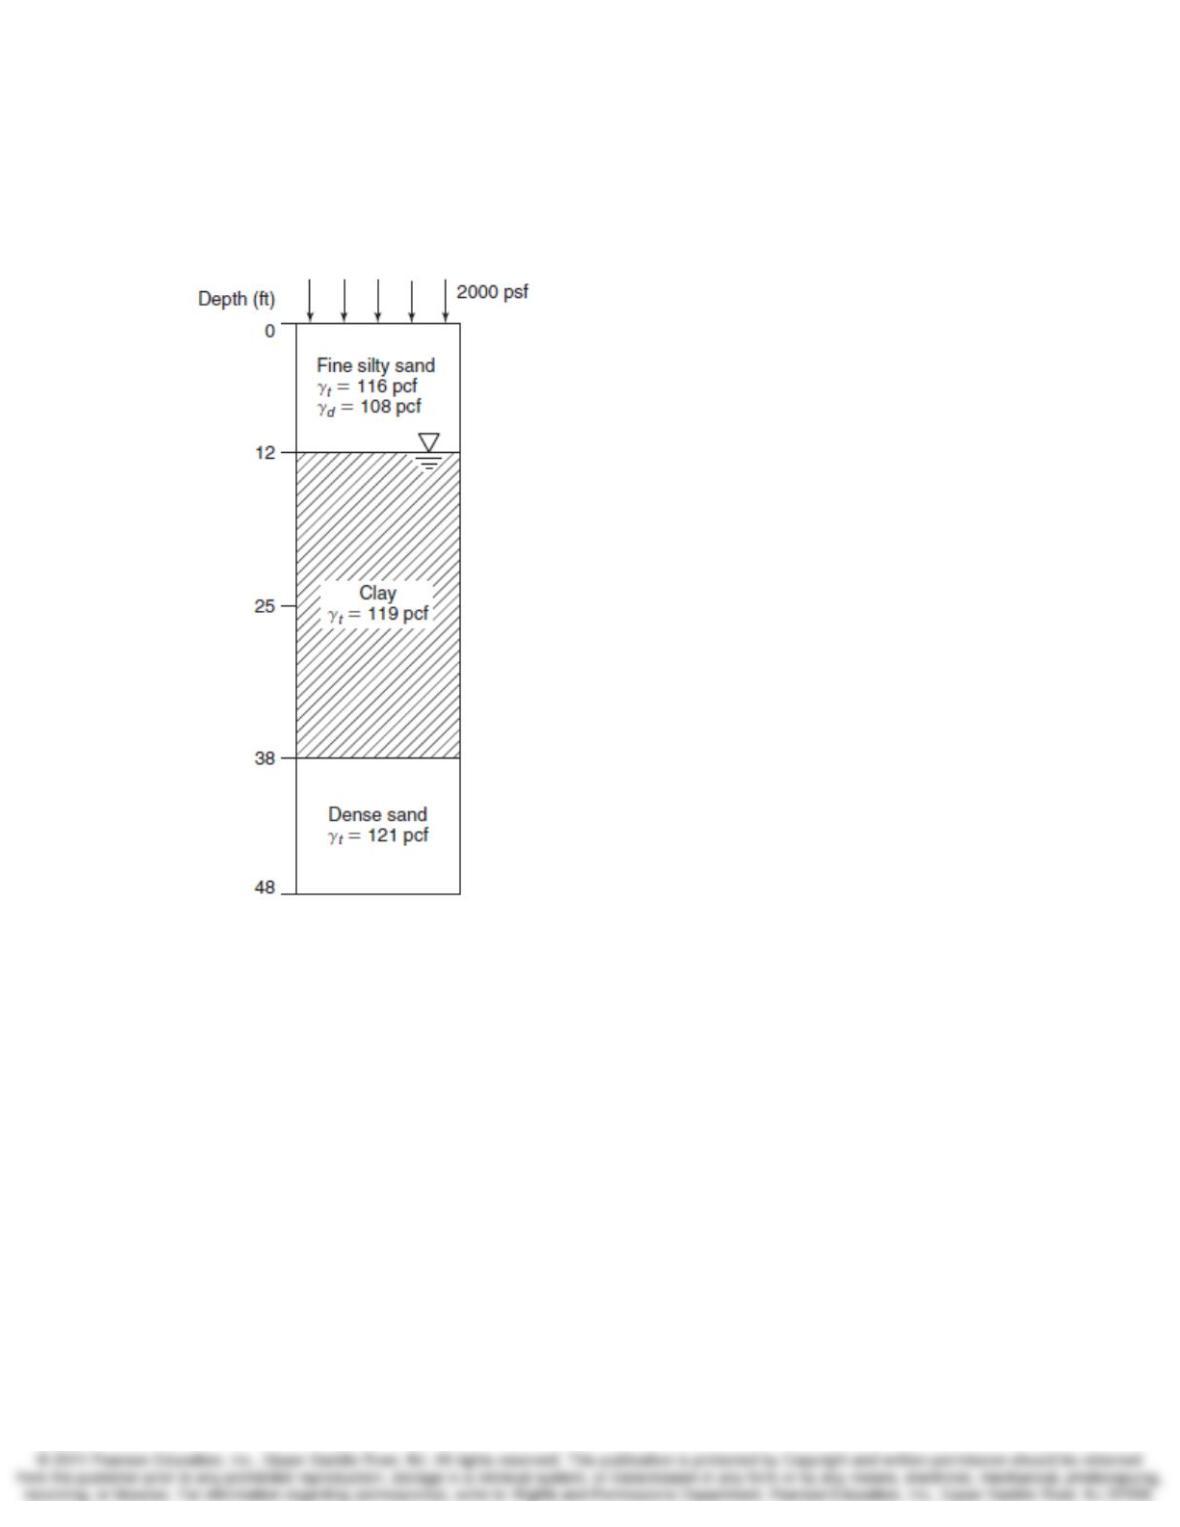
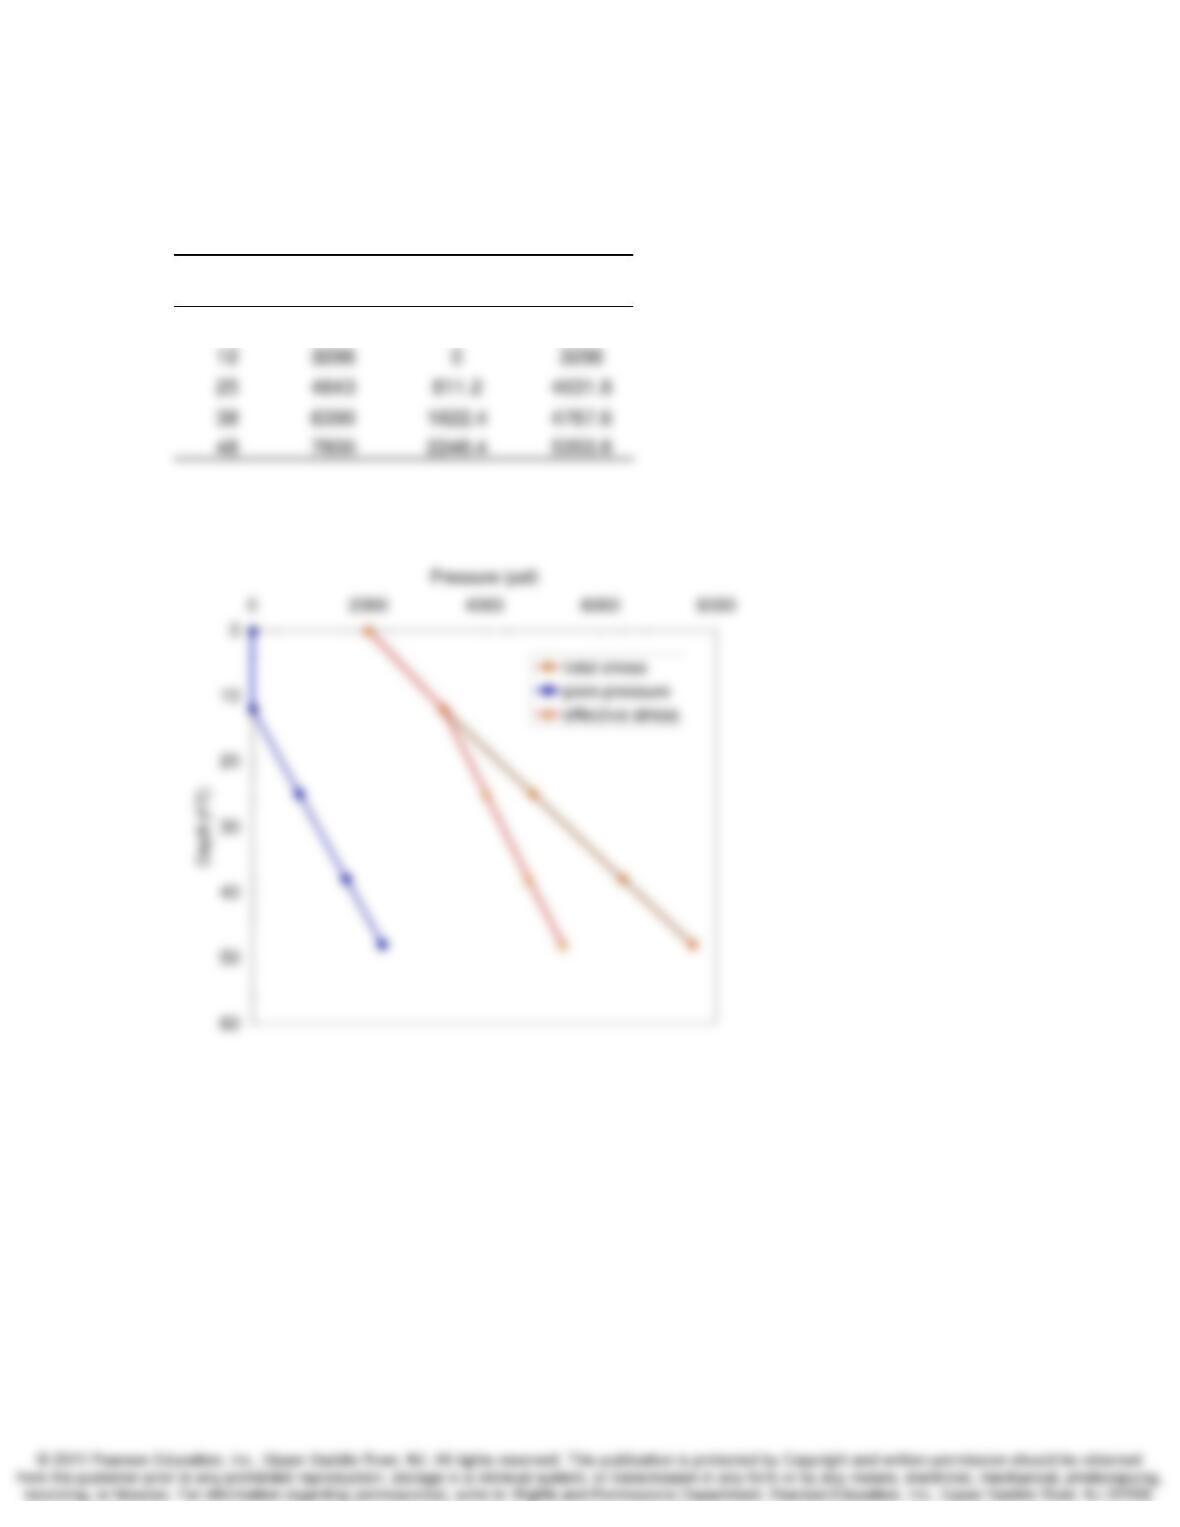
6-28. Figure P6.28 shows the soil profile at the site of an existing warehouse (i.e., covers a large
area) that causes a surface loading of 2000 psf. Draw the
σ
v,
σ
v’ and u profiles with depth. Show
values at 0, 12, 25, 38 and 48 ft.
continued next page
Hydrostatic Water in Soils and Rocks Chapter 6
6-28 SOLUTION:
Assume the top 12 ft of silty sand is dry (i.e., γdry applies).
Depth σuσ‘
(ft) (psf) (psf) (psf)
0 2000 0 2000
Hydrostatic Water in Soils and Rocks Chapter 6
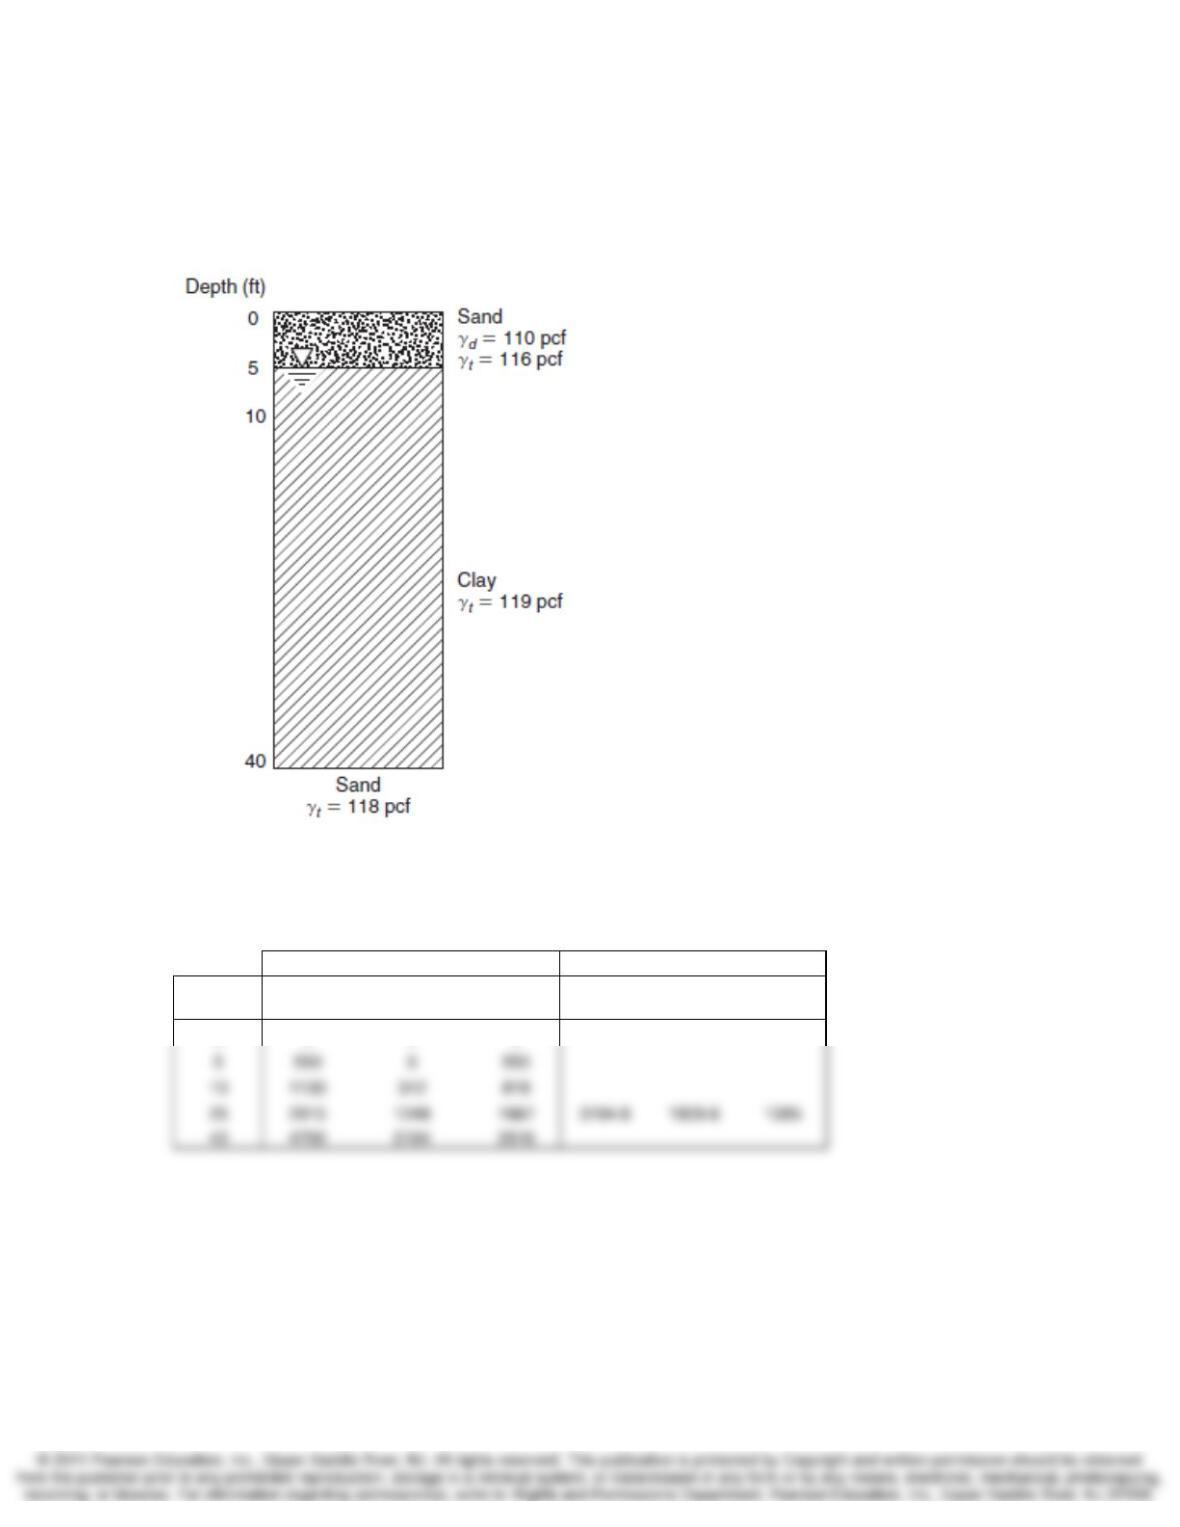
6-29. Refer to the soil profile shown in Fig. P6.29. (a) For the conditions shown, compute the
σ
v,
σ
v’ and u values at the ground surface, water table, and at all soil layer interfaces. (b) During the
spring, the water rises to 4 ft above the ground surface. Determine the
σ
v,
σ
v’ and u at 25 ft.
SOLUTION:
For original conditions, assume top 5 ft of sand is dry (i.e., γdry applies).
Depth (ft) σuσ‘σuσ‘
(ft) (psf) (psf) (psf) (psf) (psf) (psf)
00 0 0
original conditions shown spring conditions
Hydrostatic Water in Soils and Rocks Chapter 6
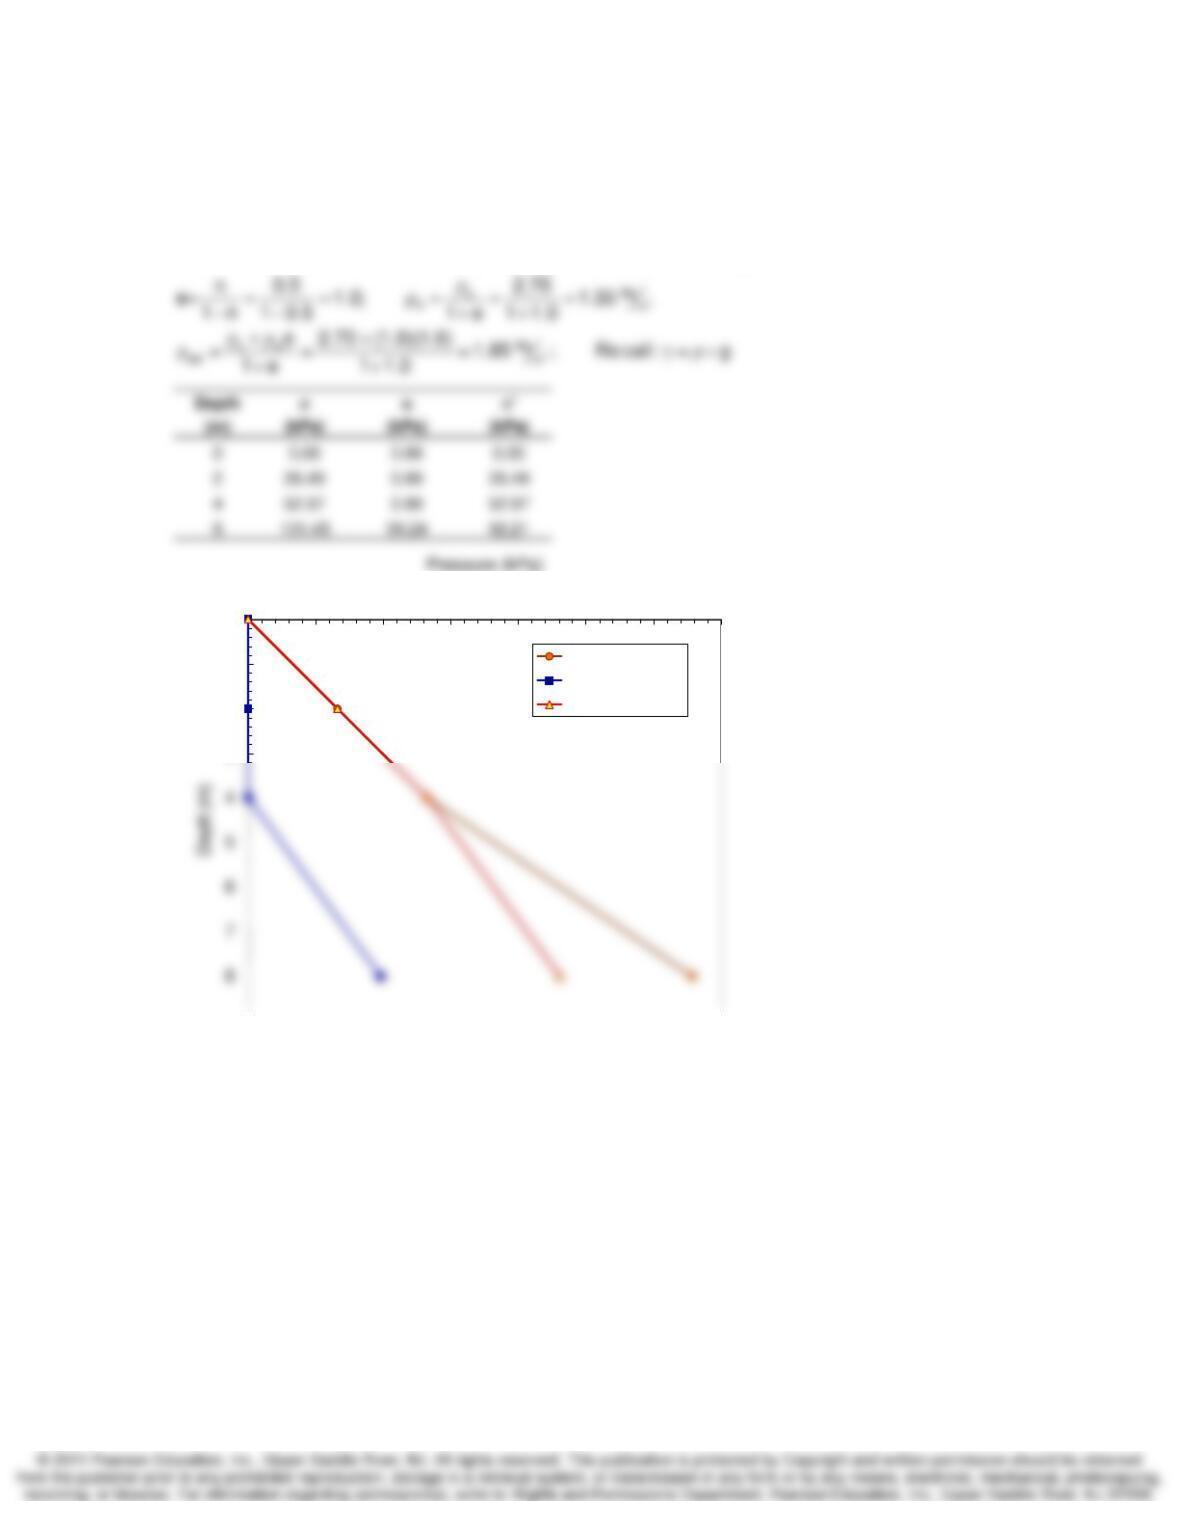
6.30. For the soil profile of Example 6.8 plot the total, neutral, and effective stresses with depth if
the groundwater table is lowered 4 m below the ground surface.
SOLUTION: Assume groundwater is at a depth of 4 m below ground surface.
dsat
Use phase relations to determine and for the upper sand layer.
ρρ
0
1
2
3
0.00 20.00 40.00 60.00 80.00 100.00 120.00 140.00
total stress
pore pressure
effective stress
6-31. Soil borings made at a site near Chicago indicate that the top 6 m is a loose sand and
miscellaneous fill, with the groundwater table at 3 m below the ground surface. Below this is a
fairly soft blue-gray silty clay with an average water content of 30%. The boring was terminated at
16 m below the ground surface when fairly stiff silty clay was encountered. Make reasonable
assumptions as to soil properties and calculate the total, neutral, and effective stresses at 3, 7,
12, and 16 m below the ground surface.
SOLUTION:
Hydrostatic Water in Soils and Rocks Chapter 6
()
3
33
3
kN
dry m
kN kN
dry sat
mm
Mg
sat s m
s
sat
s
w
A reasonable range for the upper sand fill; 13 to 15
For the sand, assume 14.0 and 15.0
Use phase relations to estimate for the clay. Assume 2.70
1w (
w
1
γ=
γ= γ=
γρ=
+ρ
ρ= =
ρ
+ρ
3 3
Mg kN
sat
mm
1 0.30)(2.70) 1.94 ; (1.94)(9.81) 19.0
(0.30)(2.70)
1(1.0)
+=γ==
+
Depth σuσ‘
(m) (kPa) (kPa) (kPa)
00.000.000.00
3 42.00 0.00 42.00
6 87.00 29.43 57.57
7 106.00 39.24 66.76
12 201.00 88.29 112.71
16 277.00 127.53 149.47
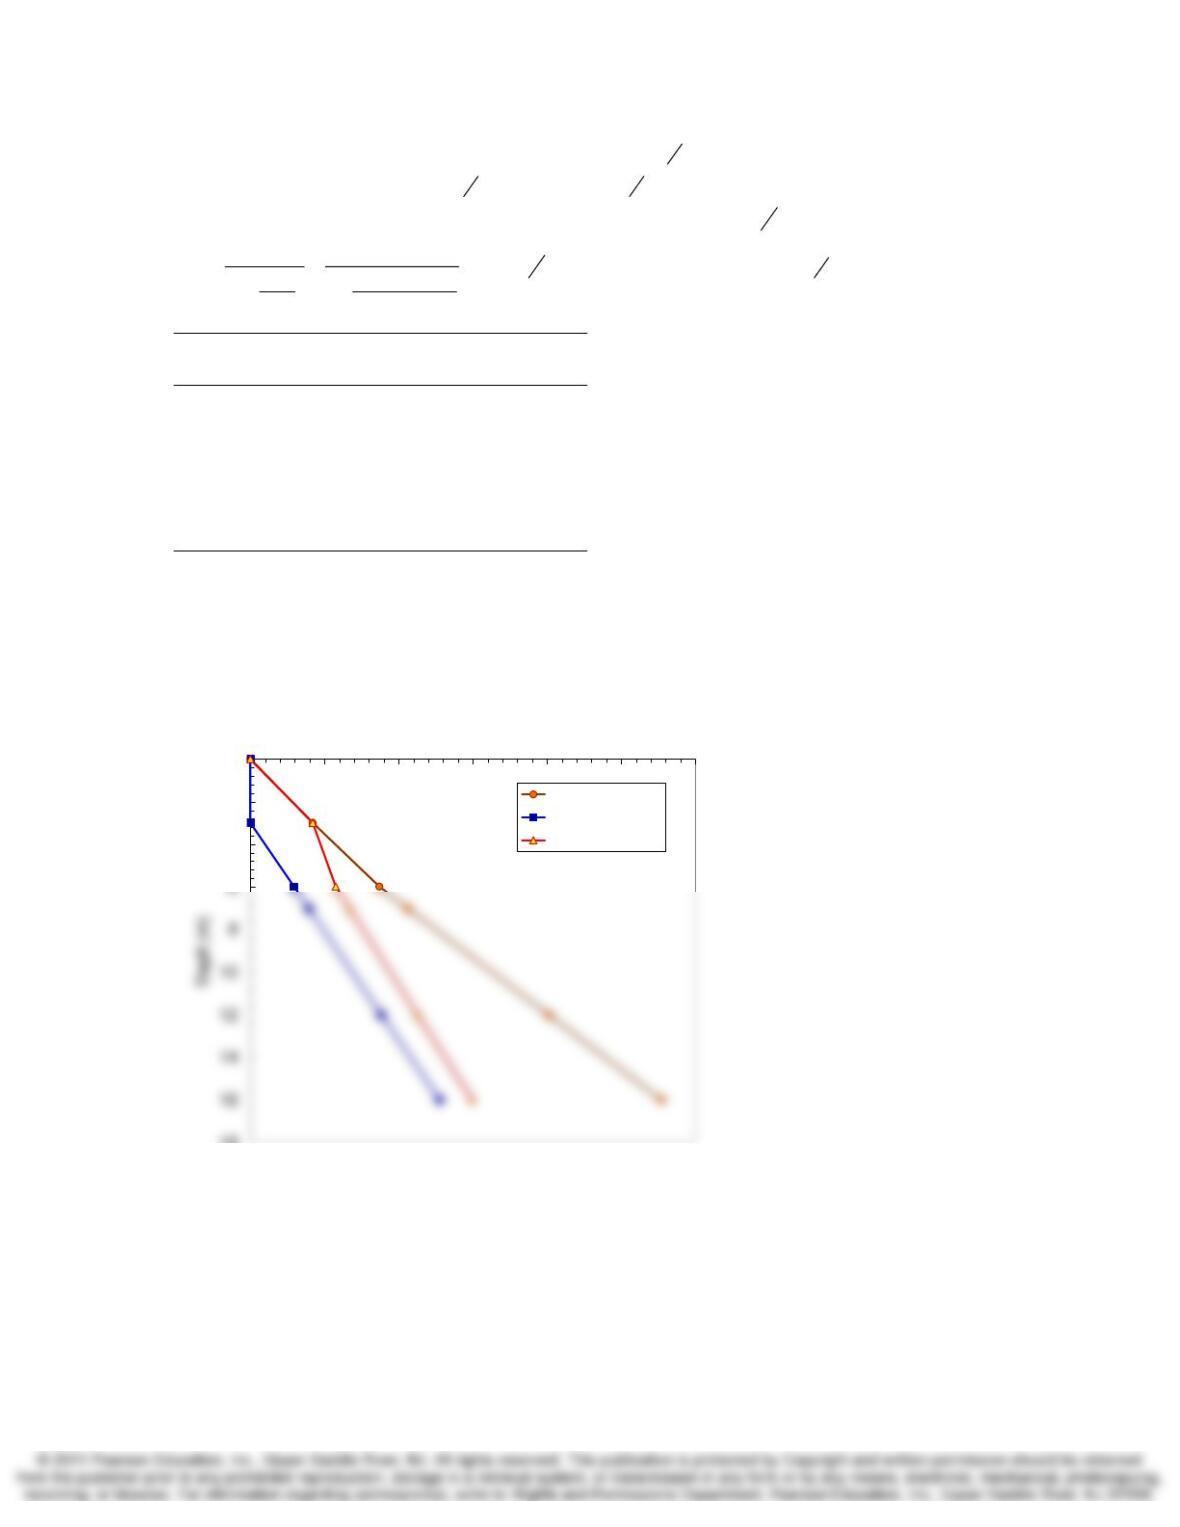
6-32. Plot the soil profile of Problem 6.31 and the total, neutral, and effective stresses with depth.
SOLUTION:
0
2
4
18
0.00 50.00 100.00 150.00 200.00 250.00 300.00
Pressure (kPa)
total stress
pore pressure
effective stress
6-33. A soil profile consists of 5 m of compacted sandy clay followed by 5 m of medium dense
sand. Below the sand is a layer of compressible silty clay 20 m thick. The initial groundwater table
is located at the bottom of the first layer (at 5 m below the ground surface). The densities are 2.05
Mg/m3 (
ρ
), 1.94 Mg/m3 (
ρ
sat), and 1.22 Mg/m3 (
ρ
’) for the three layers, respectively. Compute the
effective stress at a point at mid-depth in the compressible clay layer. Then, assuming that the
medium dense sand remains saturated, compute the effective stress in the clay layer at midpoint
Hydrostatic Water in Soils and Rocks Chapter 6
again, when the groundwater table drops 5 m to the top of the silty clay layer. Comment on the
difference in effective stress.
SOLUTION:
Depth σuσ‘
(m) (kPa) (kPa) (kPa)
0 0.000.000.00
Groundwater at 5 m
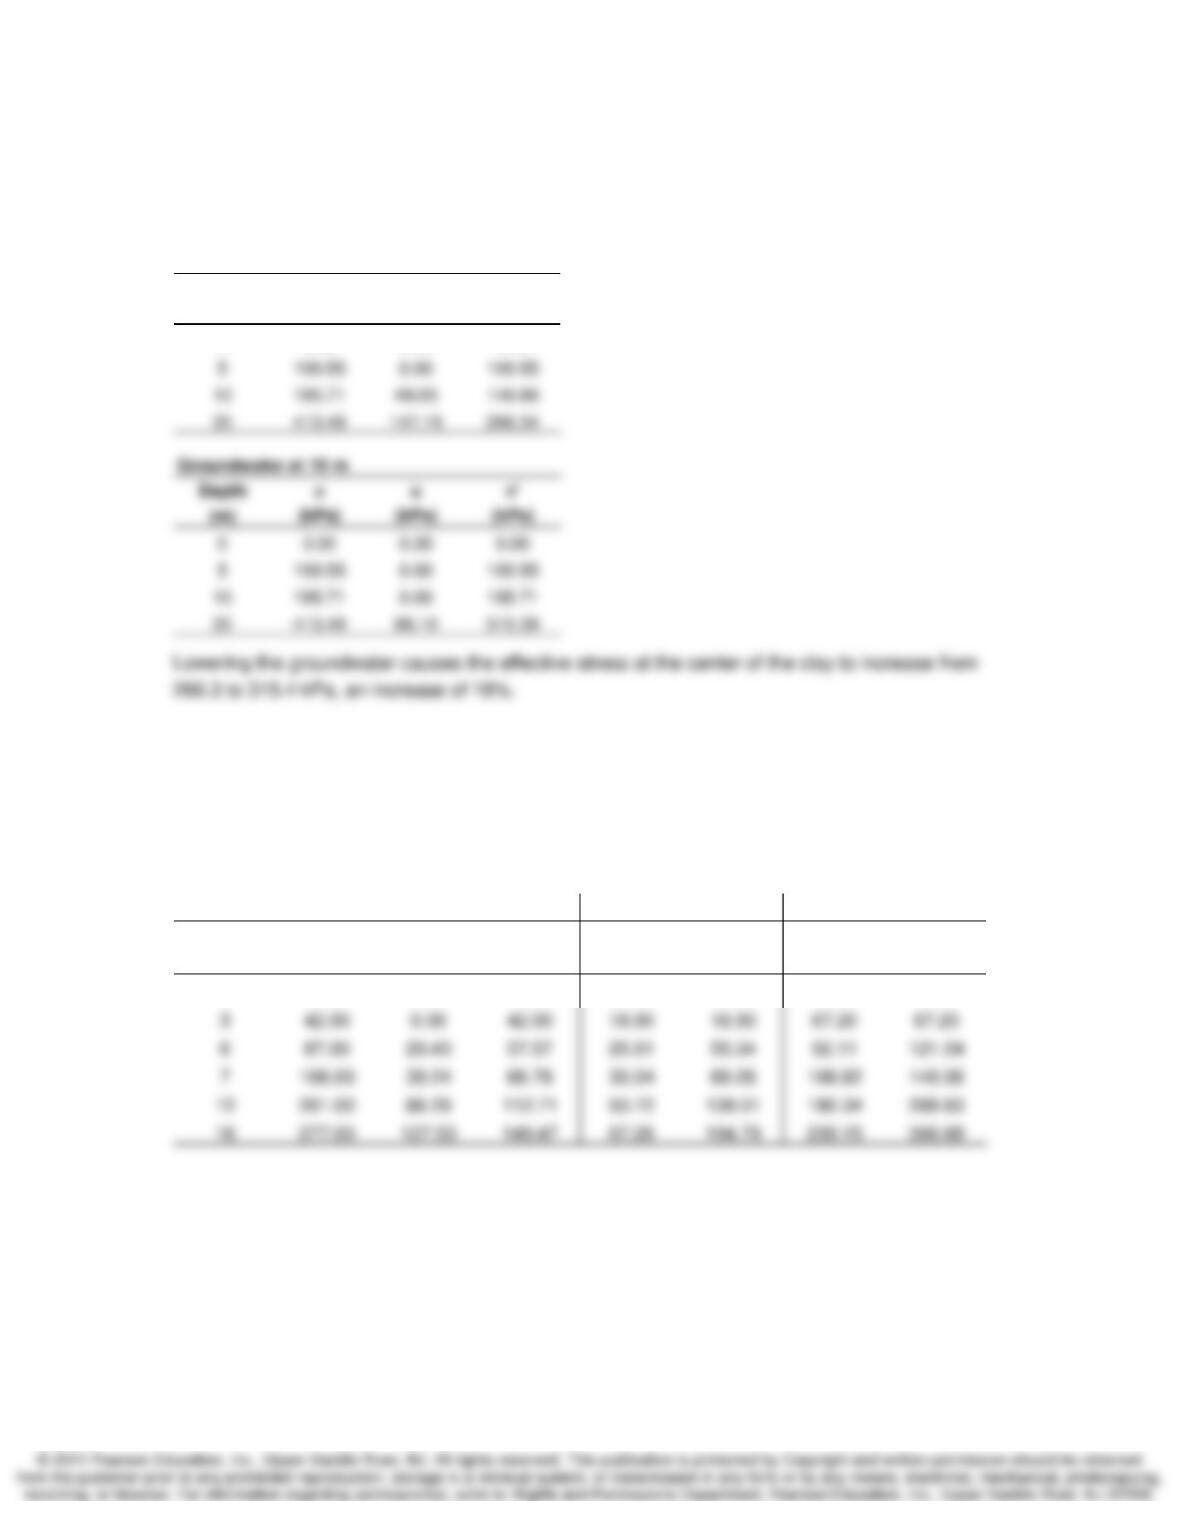
6-35. For the soil profile of Problem 6.31, calculate the horizontal, total, and effective stresses at
depths of 3, 7, 12, and 16 m, assuming (a) Ko is 0.45 and (b) Ko is 1.6.
SOLUTION:
Depth σ
v
uσ
v
‘σ
h
‘σ
h
σ
h
‘σ
h
(m) (kPa) (kPa) (kPa) (kPa) (kPa) (kPa) (kPa)
0 0.00 0.00 0.00 0.00 0.00 0.00 0.00
(a) K
o
= 0.45 (b) K
o
= 1.6

Hydrostatic Water in Soils and Rocks Chapter 6
6-36. The value of Ko for the compressible silty clay layer of Problem 6.33 is 0.68. What are the
total and effective horizontal stresses at mid-depth of the layer?
SOLUTION:
(a) For groundwater at 5 m: