Chapter 6
Cost-Volume-Profit Analysis
Concept Questions
1. (LO 1—Traditional vs. contribution margin income statements)
2. (LO 1—Basic contribution margin)
Contribution margin will not change because a change in fixed cost does not
3. (LO 1—Basic contribution margin)
Contribution margin is the sales price per unit minus all variable production and
4. (LO 2—Basic contribution margin)
5. (LO 3—Basic break-even analysis)
The break-even point in units is equal to total fixed costs divided by the
6. (LO 3—Basic break-even analysis)
A company can decrease its break-even point by decreasing fixed costs and/or
7. (LO 4—Income tax effects in CVP analysis)
If a company wants to compute an after-tax profit, then the company has to
Solutions Manual
6-2
8. (LO 5—Break-even point and operating leverage)
As a company nears the break-even point and its income is close to zero, the
Exercises
1. (LO 1—Contribution margin)
a. contribution margin
2. (LO 2—CVP: The impact on income)
Increasing the sales price by 40 percent (to $49) without changing variable costs
3. (LO 2—CVP: What-if analysis)
A contribution margin ratio of 30 percent will increase net income by $15,000
4. (LO 2—What-if decisions with changing fixed costs)
This problem can be solved using contribution margin ratio or operating leverage.
Walker’s contribution margin ratio is 40 percent ($240,000/$600,000). If sales
Chapter 6: Cost-Volume-Profit Analysis
6-3
5. (LO 2 and 5—Operating leverage)
A.
6. (LO 3—Break-even analysis)
7. (LO 3—Break-even analysis)
At the break-even point: Sales – Variable costs – Fixed costs = $0
If x = sales price per meal,
x = $35
8. (LO 3—Break-even analysis)
The company must sell an additional 1,000 logs if fixed costs increase by
$12,000. With a contribution margin of $12 per log, each additional unit sold will
Solutions Manual
6-4
9. (LO 3—Break-even analysis: Multi-product environment)
Calculating the break-even point with multiple products requires first calculating
the weighted average contribution margin:
Glide Magic
Slide Magic
Selling price
Variable costs
Contribution margin
Weighted-average CM per unit
10. (LO 3—Break-even analysis: Multi-product environment)
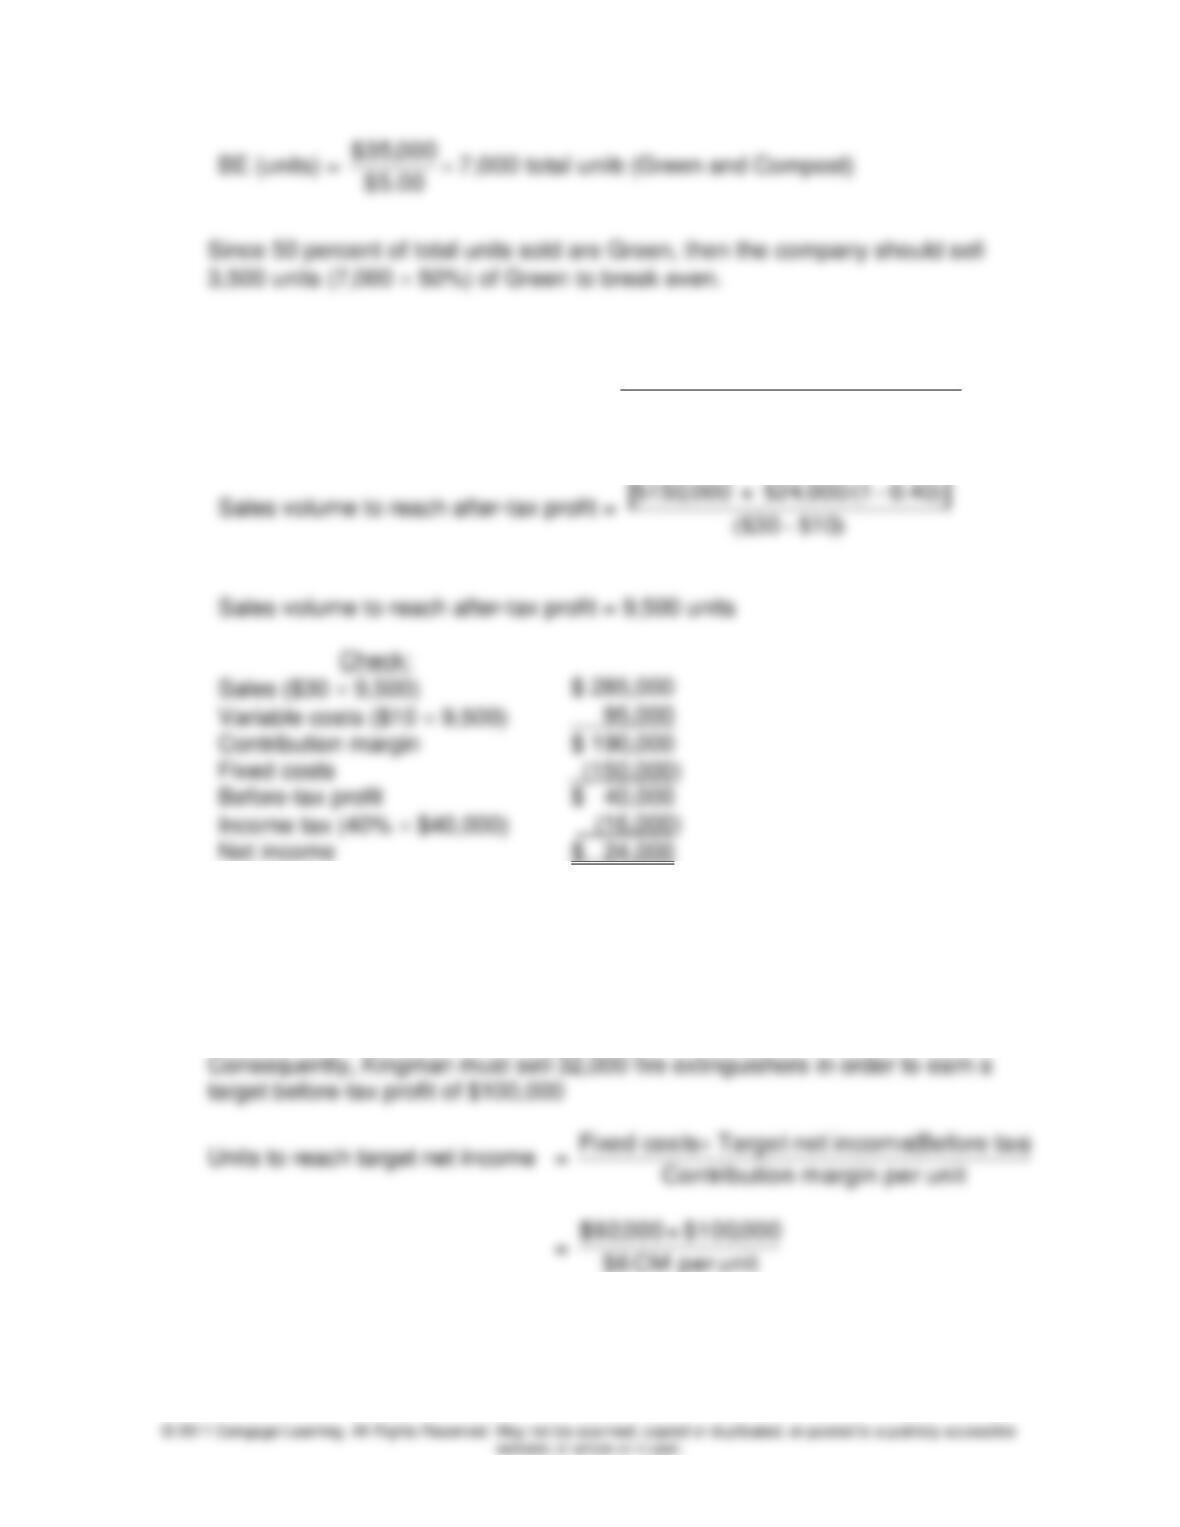
Calculating the break-even point with multiple products requires first calculating
the weighted average contribution margin:
Green
Compost
Selling price
Variable costs
Contribution margin
Weighted-average CM per unit
Chapter 6: Cost-Volume-Profit Analysis
6-5
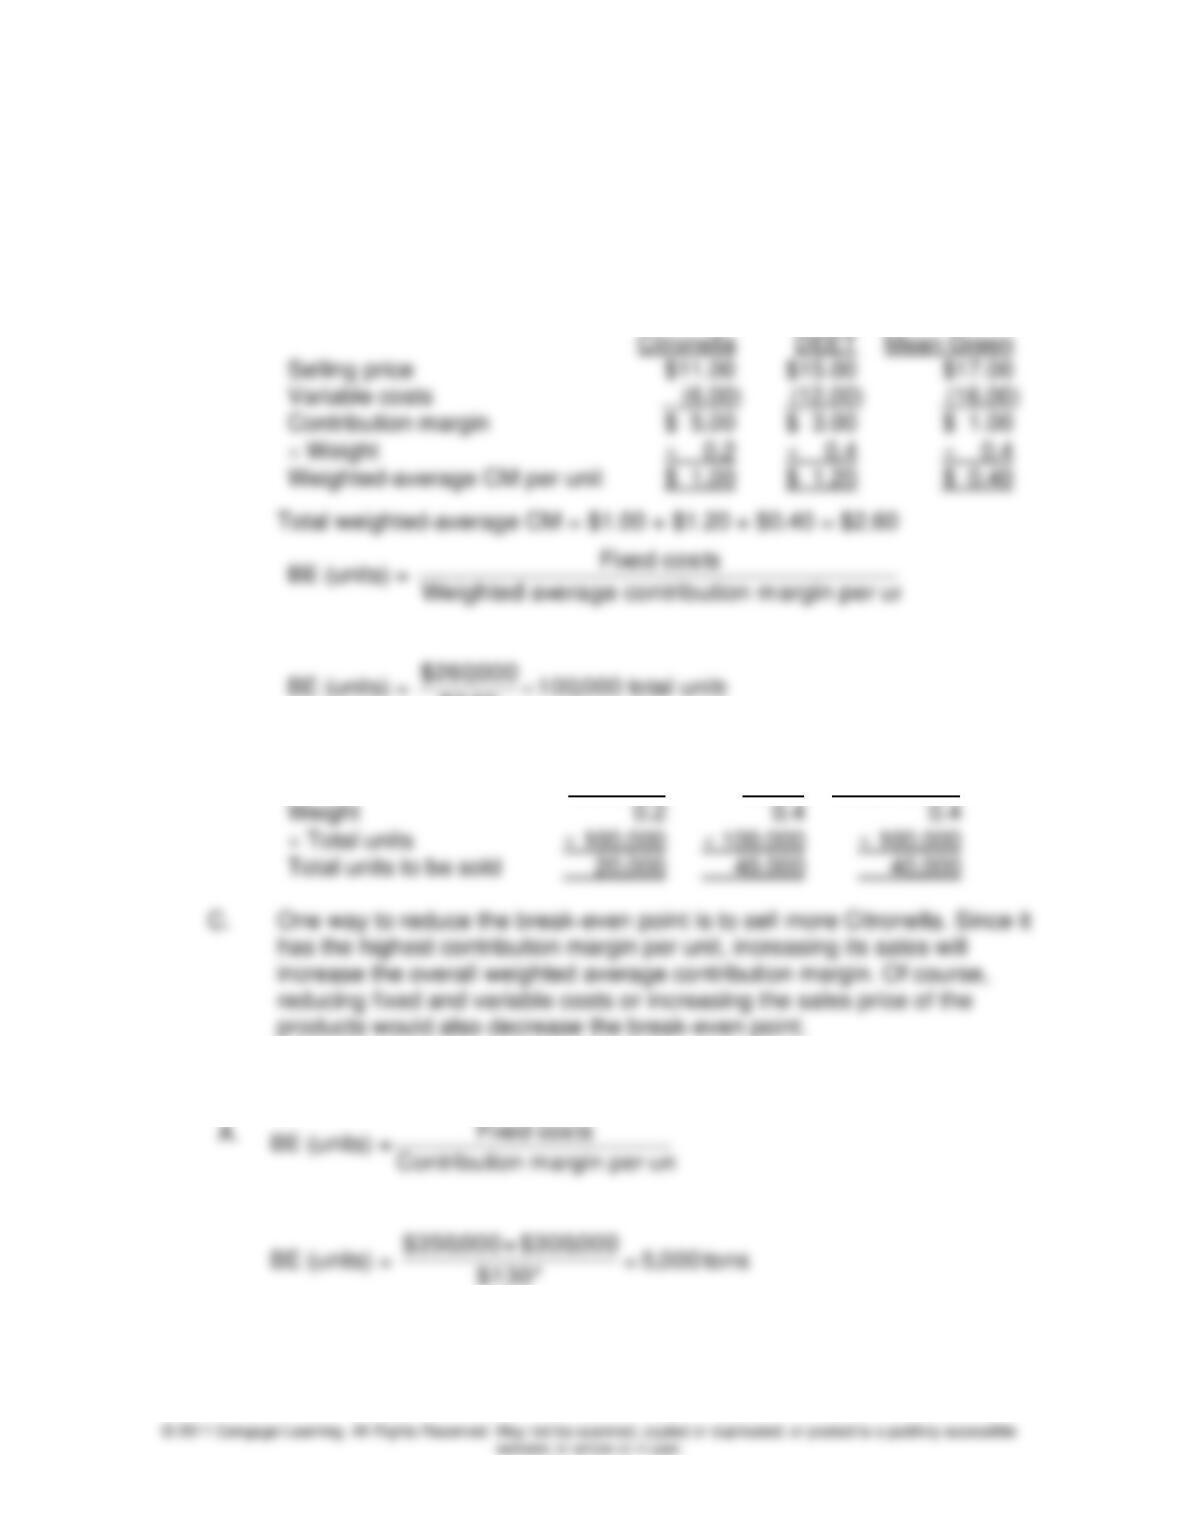
11. (LO 4—Sales to reach after-tax profit)
Sales volume to reach after-tax profit =
[ ]
unit per CM
rateTax 1profittax –After+FC ) – /(
Sales volume to reach after-tax profit = 9,500 units
Contribution margin
Fixed costs
Net income
12. (LO 4—Target profit analysis)
In order to earn an after-tax profit of $60,000, Kingman must earn a before-tax
profit of $100,000 [$60,000/(1 – Tax rate)], or 60,000/0.6.
Solutions Manual
6-6
Problems
13. (LO 1 and 3—Multi-product break-even analysis)
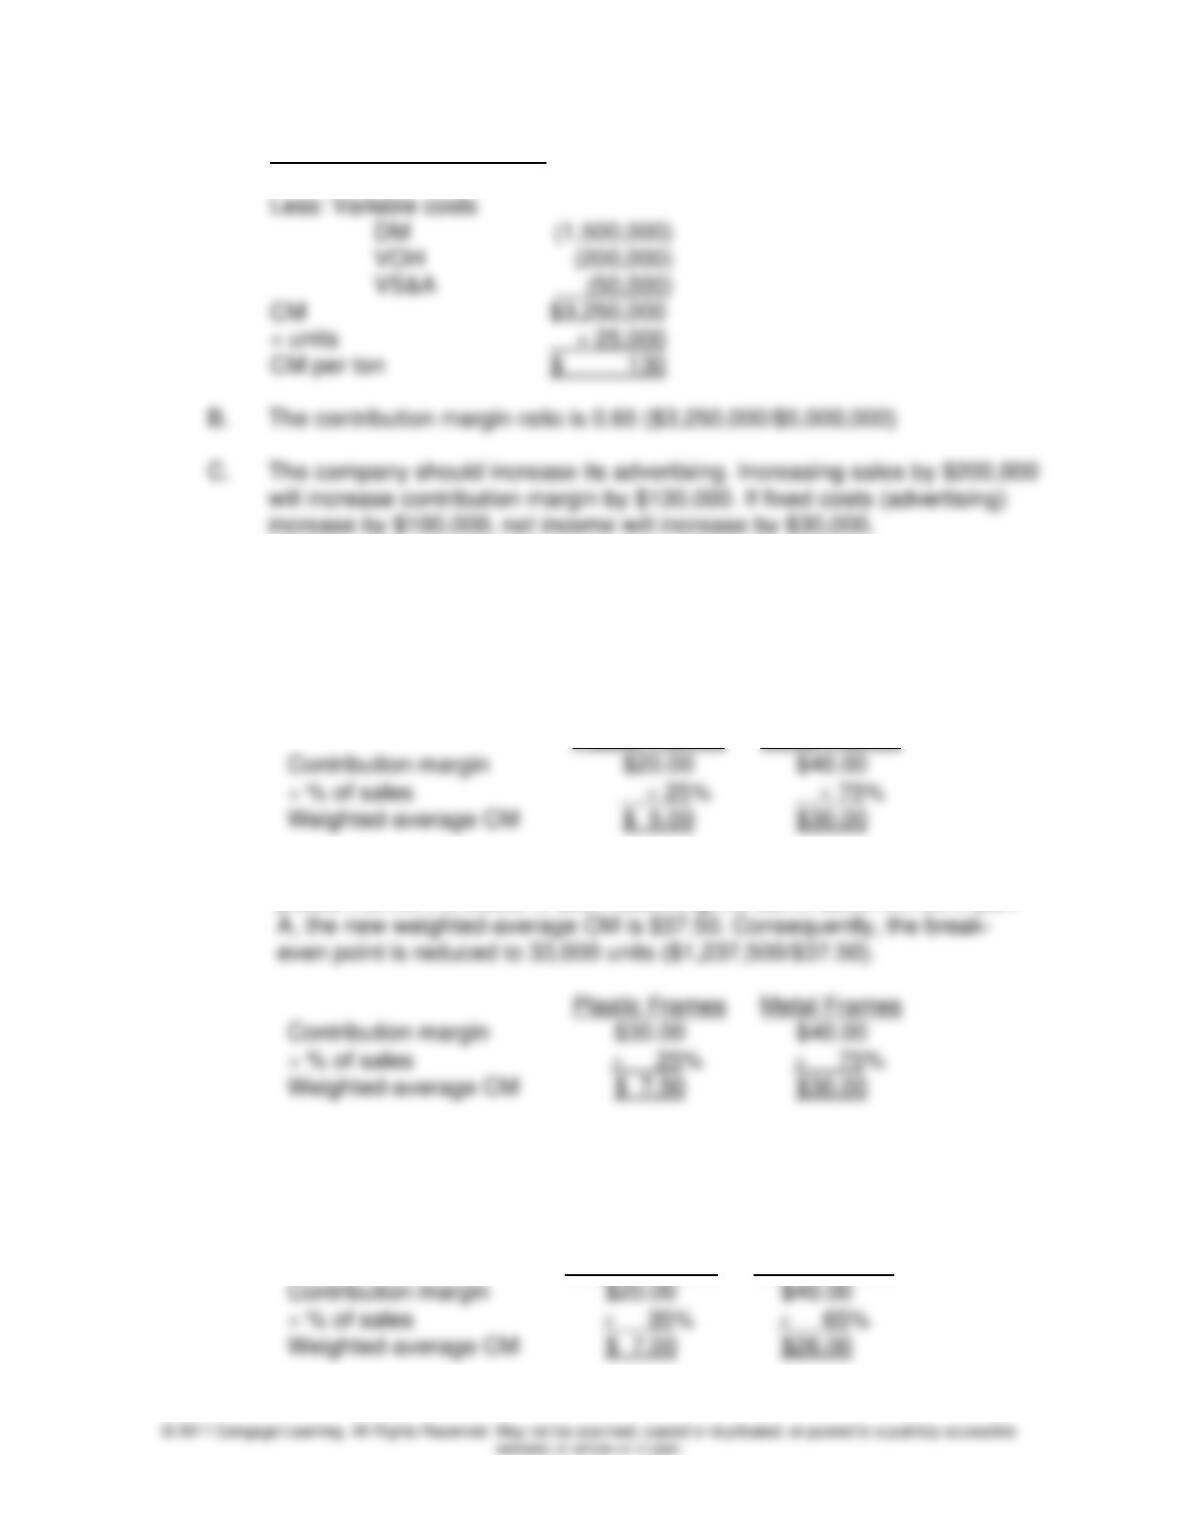
A. The weighted-average contribution margin per unit is $2.60 per unit (see
below). If fixed costs are $260,000, the break-even point will be 100,000
total units.
Mean Green
Selling price
Variable costs
Contribution margin
Weight
Total units to be sold
$2.60 =100,000 total units
B.
Citronella
DEET
Mean Green
14. (LO 1, 2, and 3—CVP: What-if analysis)
Chapter 6: Cost-Volume-Profit Analysis
6-7
* Calculation of CM per ton:
Sales
$5,000,000
Less: Variable costs
VOH
$3,250,000
÷ units
CM per ton
15. (LO 1, 2, and 3—CVP and break-even analysis)
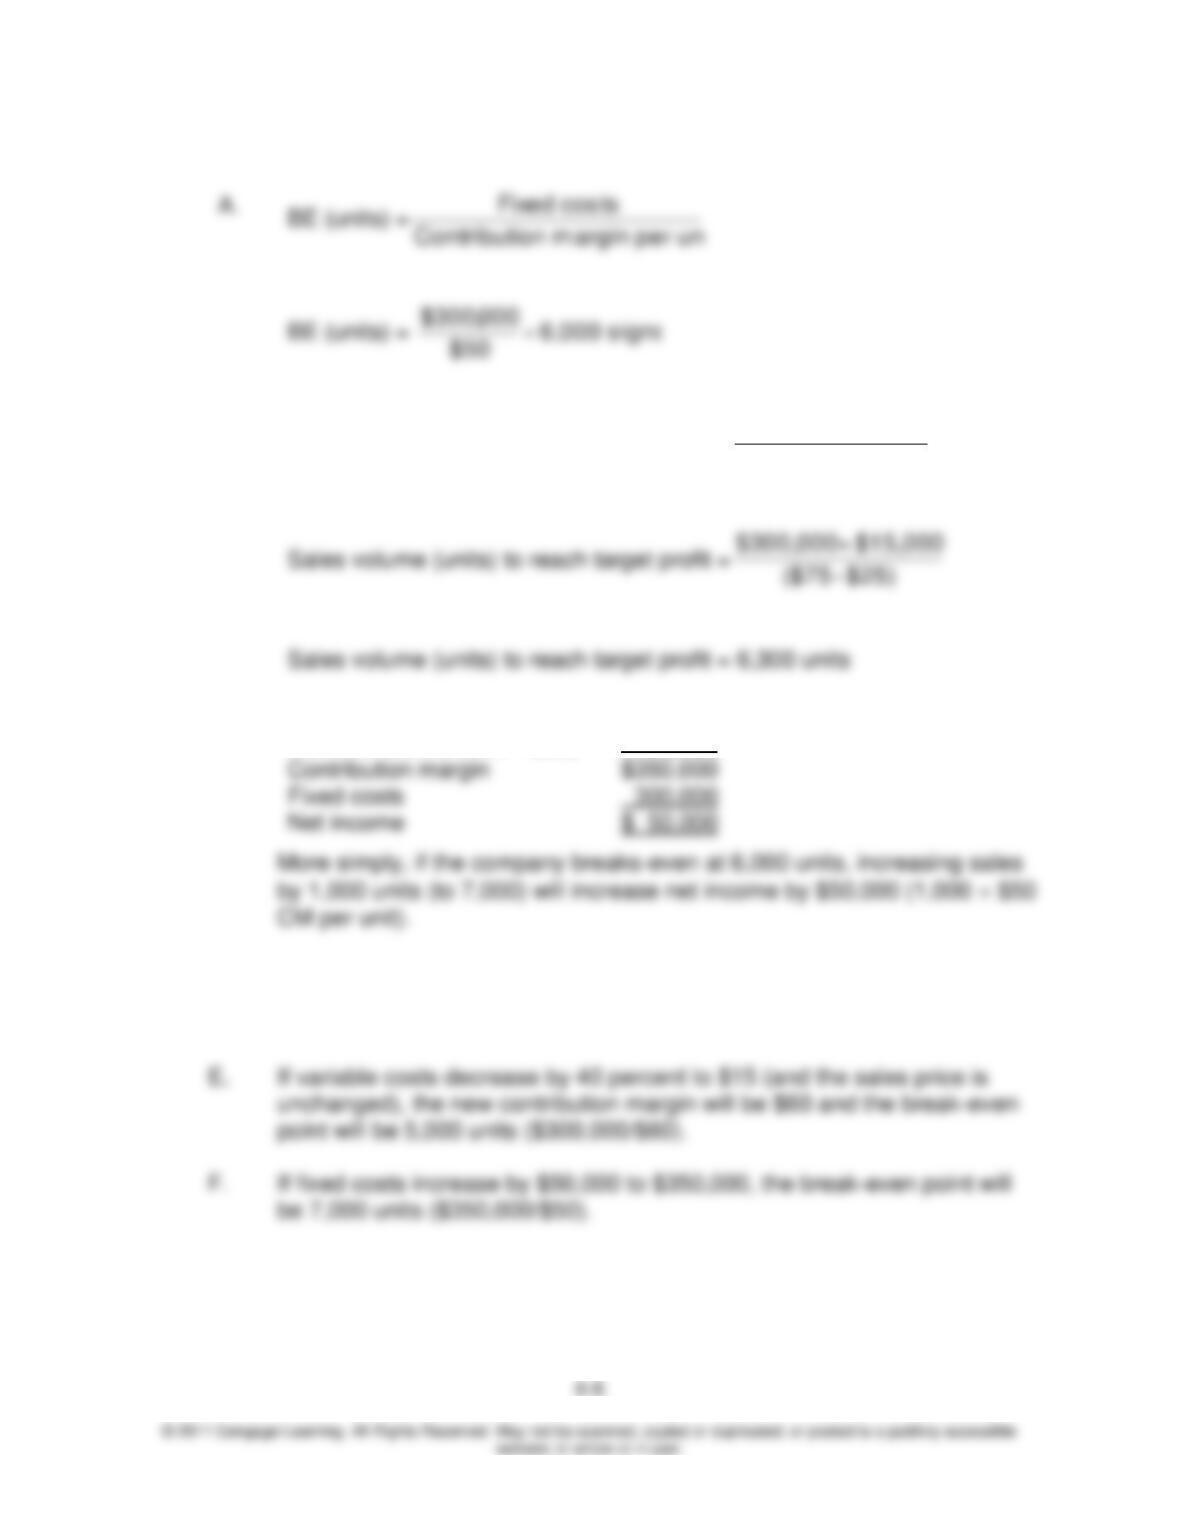
A. With the sales mix at 25 percent plastic frames (10,000/40,000) and 75
percent metal frames (30,000/40,000), the break-even point is 35,000
units ($1,225,000/$35 weighted-average CM).
Plastic Frames
Metal Frames
Contribution margin
Weighted-average CM
Plastic Frames
Metal Frames
Contribution margin
B. If the direct material costs for plastic frames is reduced by $10, the CM for
plastic frames increases to $30. Assuming the same sales mix as in part
C. Changing the sales mix to 35 percent plastic frames and 65 percent metal
frames changes the weighted-average CM per unit to $33.00. The new
break-even point would be 34,000 frames ($1,122,000 fixed costs/$33.00
weighted-average CM per unit).
Plastic Frames
Metal Frames
Contribution margin
Weighted-average CM
A.
Solutions Manual
16. (LO 1, 2, and 3—Break-even and target profit)
B.
Sales volume (units) to reach target profit =
Sales volume (units) to reach target profit = 6,300 units
FC + Target profit
CM per unit
C.
Sales (7,000 $75)
$525,000
Variable costs (7,000 $25)
175,000
Contribution margin
Net income
D. If the sales price decreases by 20 percent to $60, the new contribution
margin will be $35 and the break-even point will be 8,572 units (rounded)
($300,000/$35).