Compaction and Stabilization of Soils Chapter 5
CHAPTER 5
COMPACTION AND STABILIZATION OF SOILS
5-1. For the data in Fig. 5.1:
(a) Estimate the maximum dry density and optimum water content for both the standard curve
and the modified Proctor curve.
(b) What is the placement water content range for 90% relative compaction for the modified
Proctor curve and 95% relative compaction for the standard Proctor curve?
(c) For both curves, estimate the maximum placement water content for the minimum compactive
effort to achieve the percent relative compaction in part (b).
SOLUTION:
3
Mg
dmax opt
m
(a) Standard Proctor: 1.723 107.5 pcf; w 16 %
ρ= = =
Compaction and Stabilization of Soils Chapter 5
5-2. The natural water content of a borrow material is known to be 8%. Assuming 5500 g of wet
soil is used for laboratory compaction test points, compute how much water is to be added to
other 5500 g samples to bring their water contents up to 11%, 15%, 18%, 22%, and 26%.
SOLUTION:
w
nt
s
ss
M
w 0.08 ; M 5500 g
M
M remains constant. Determine M for the natural moisture condition.
== =
5-3. For the soil shown in Fig. 5.1, a field density test provided the following information:
Water content = 13%
Wet density = 1.84 Mg/m3 (115 lbf/ft3)
Compute percent relative compaction based on modified Proctor and standard Proctor curves.
SOLUTION:
t
d field
115
Field: 101.77 pcf
1w 10.13
γ
γ= = =
++
Compaction and Stabilization of Soils Chapter 5
5-4. For the data given below (
ρ
s = 2.68 Mg/m3):
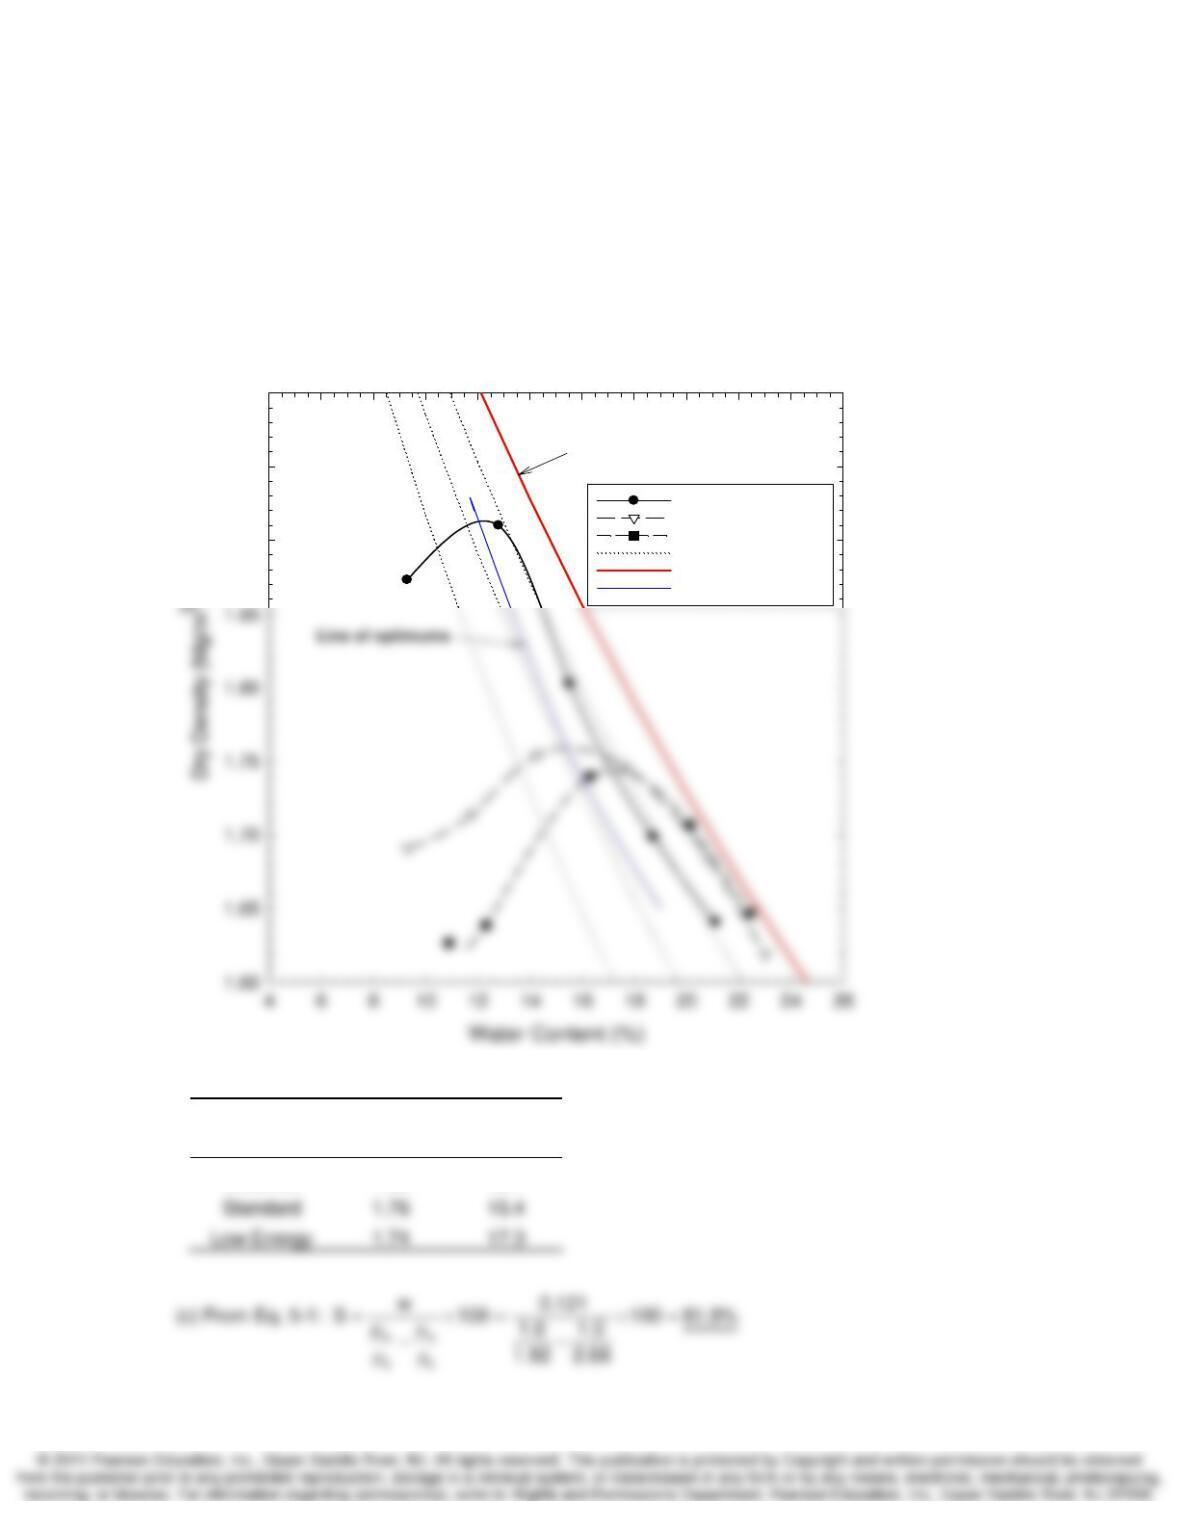
(a) Plot the compaction curves.
(b) Establish the maximum dry density and optimum water content for each test.
(c) Compute the degree of saturation at the optimum point for data in column A.
(d) Plot the 100% saturation (zero air voids) curve. Also plot the 70%, 80%, and 90% saturation
curves. Plot the line of optimums.
SOLUTION:
4 6 8 101214161820222426
1.90
1.95
2.00
A – Modified Proctor
B – Standard Proctor
C – Low energy test
Saturation curves
ZAV line (S=100%)
Line of Optimums
90%
80%
S = 70%
ZAV line (S = 100%)
(b)
Test ρdmax
(Mg/m3)
wopt
(%)
Modified 1.92 12.1
Compaction and Stabilization of Soils Chapter 5
5-5. The following moisture-density data are results from laboratory compaction tests on a given
soil using the same compactive effort:
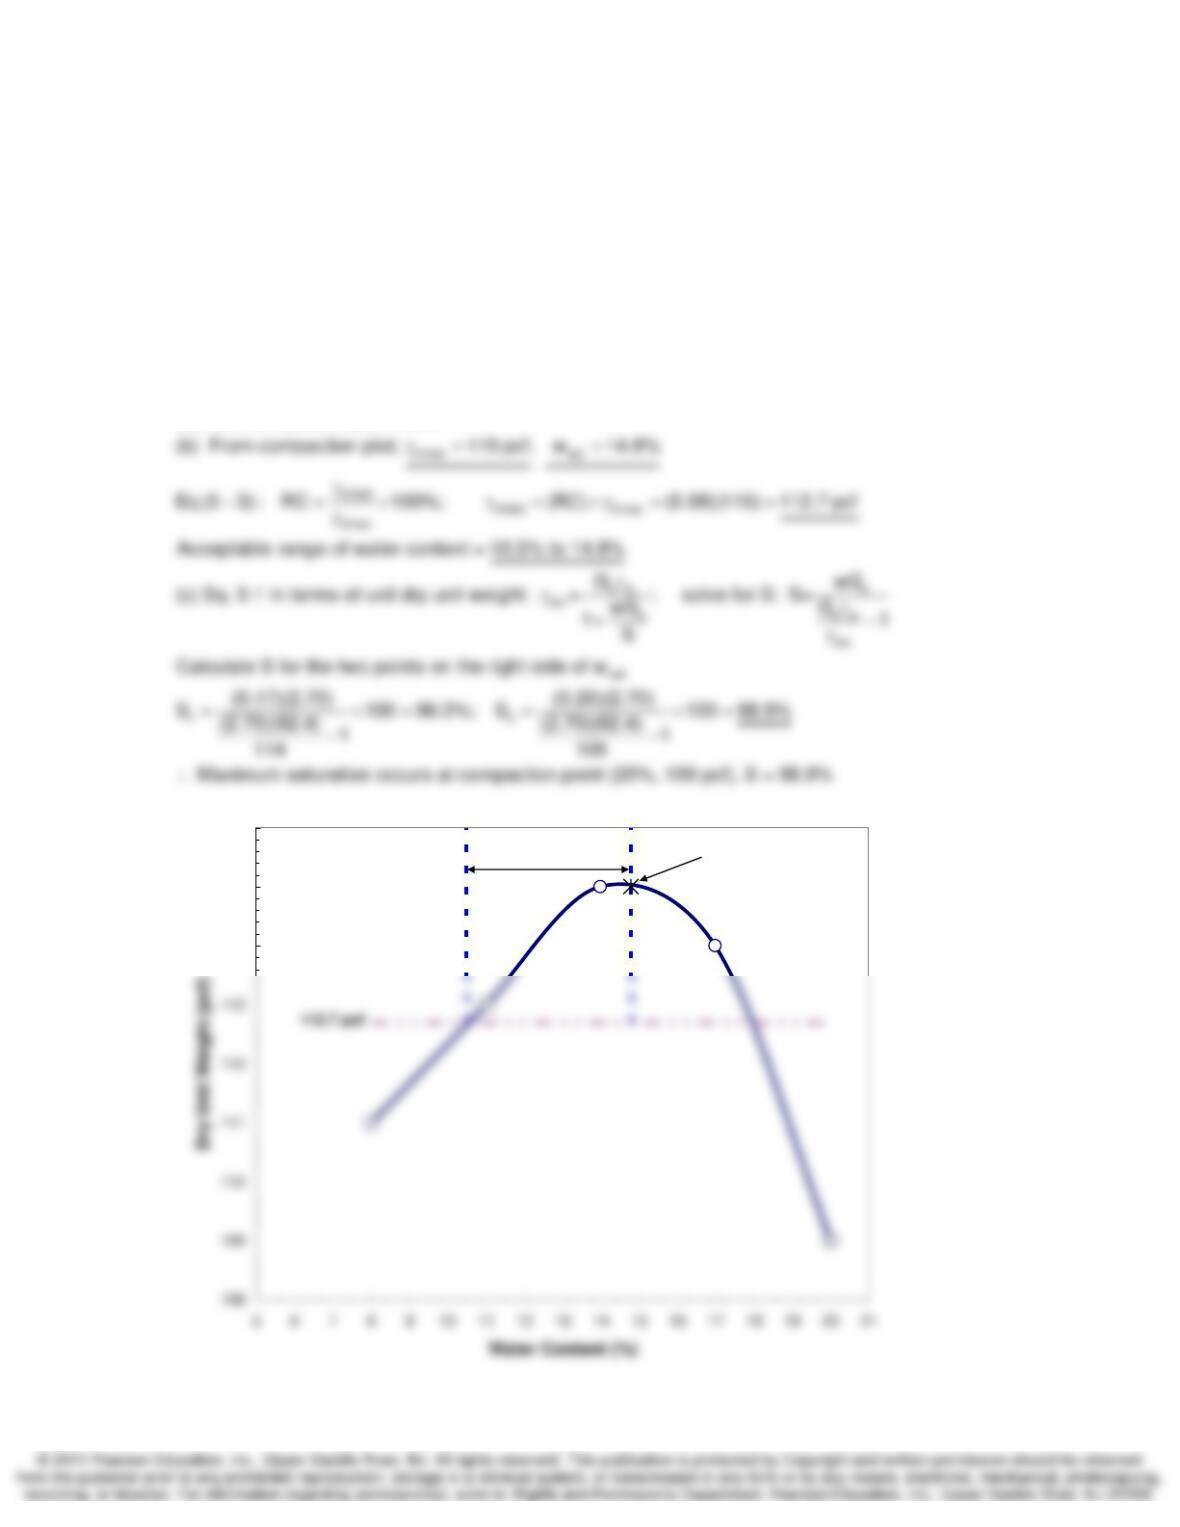
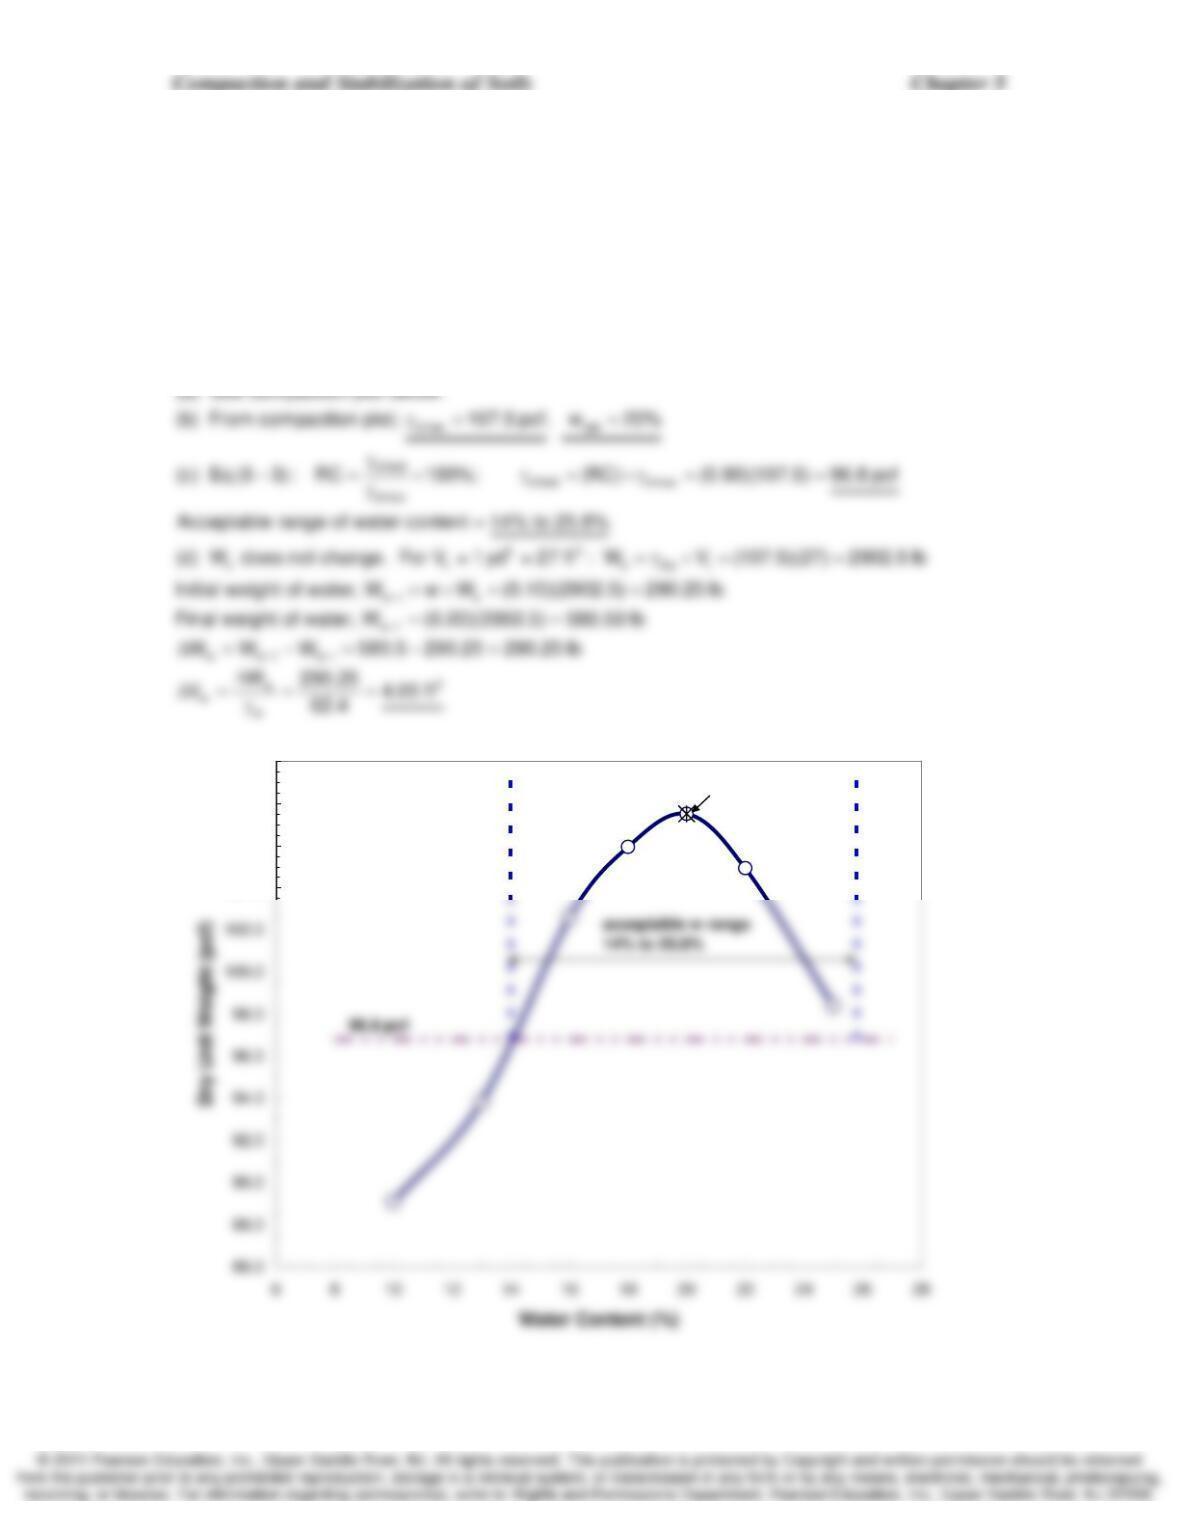
(a) On a suitable graph or using a spreadsheet, plot the curve of dry unit weight versus water
content and indicate the maximum dry unit weight and the optimum water content.
(b) What range of water contents would be acceptable if the specifications call for 98% relative
compaction and water content should be dry of optimum? Show how you calculated the relative
compaction and show on the plot the range of water contents.
(c) What is the maximum saturation level achieved during compaction tests that were performed?
SOLUTION:
(a) See compaction plot below.
114
115
116
optimum point
(14.8%, 115 pcf)
acceptable w range
10.5% to 14.8%
5-6. A Proctor test was performed on a soil which has a specific gravity of solids of 2.71. For the
water content and total unit weight data below:
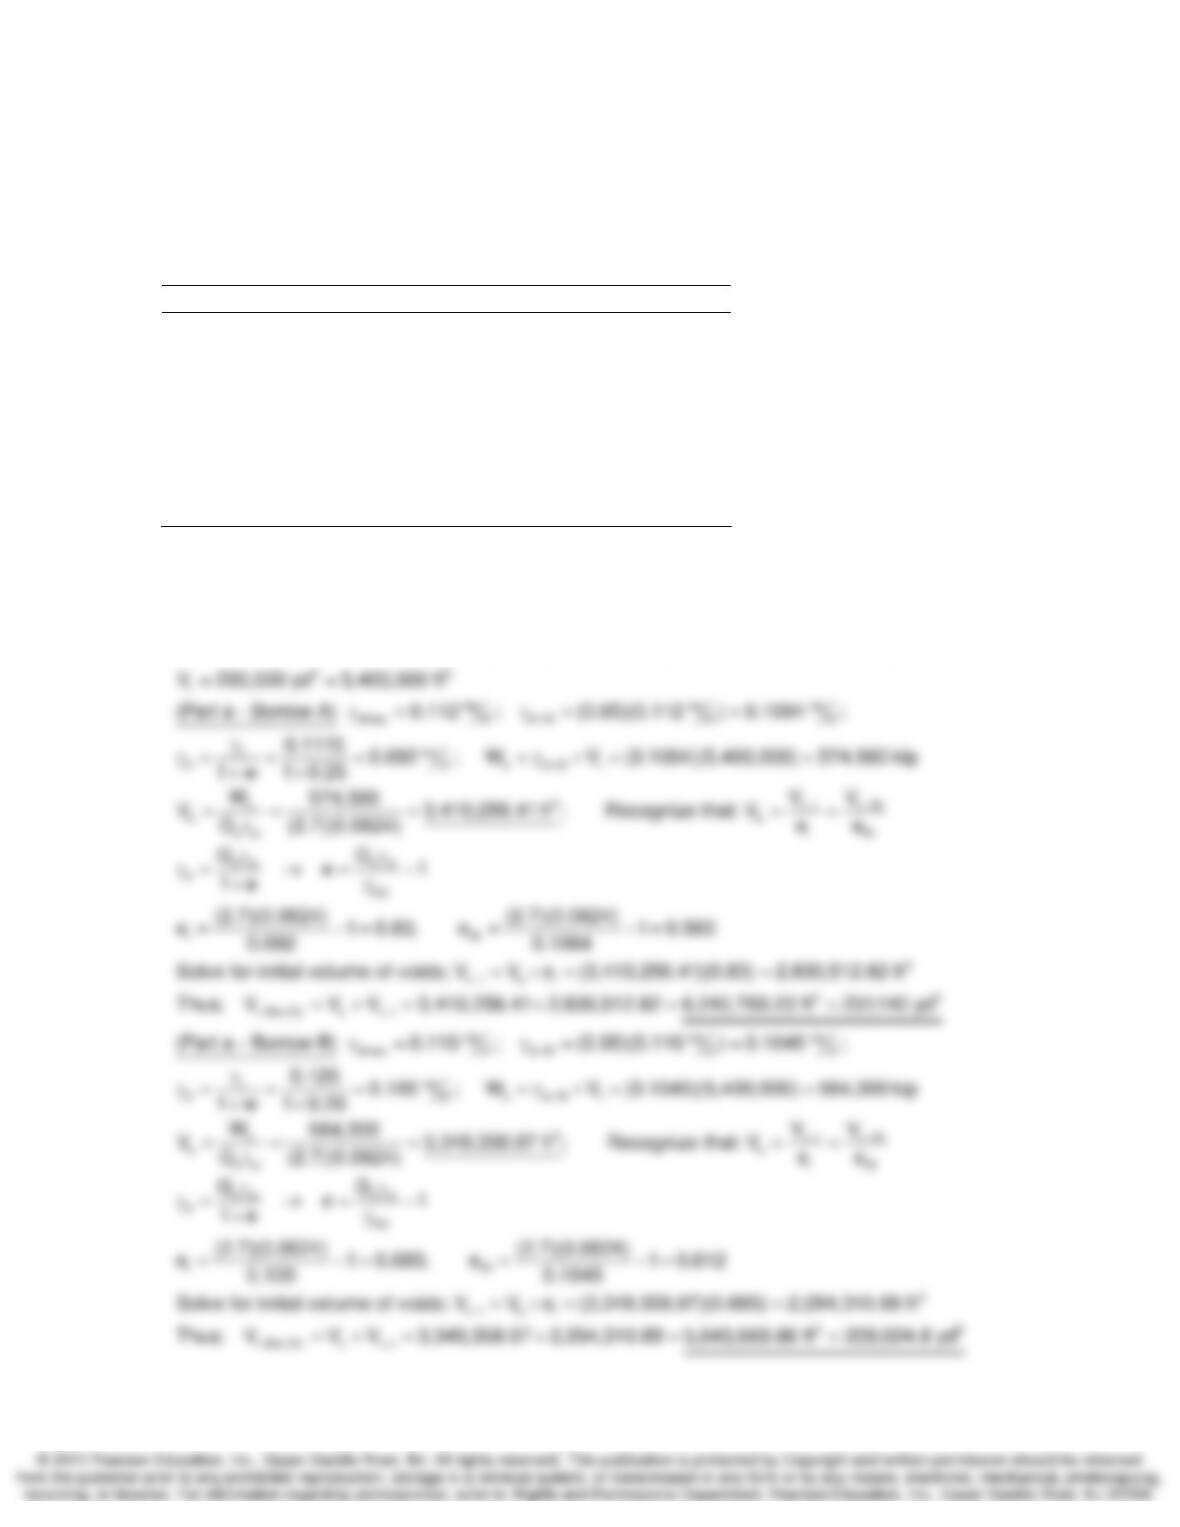
(a) Plot the moisture-dry density curve.
(b) Find the maximum dry density and optimum moisture content.
(c) Determine the moisture range permitted if a contractor must achieve 90% relative compaction.
(d) What volume of water, in ft3, must be added to obtain 1 yd3 of soil at the maximum dry density
if the soil is originally at 10% water content?
SOLUTION:
104.0
106.0
108.0
110.0
optimum point
(20.0%, 107.5 pcf)
Compaction and Stabilization of Soils Chapter 5
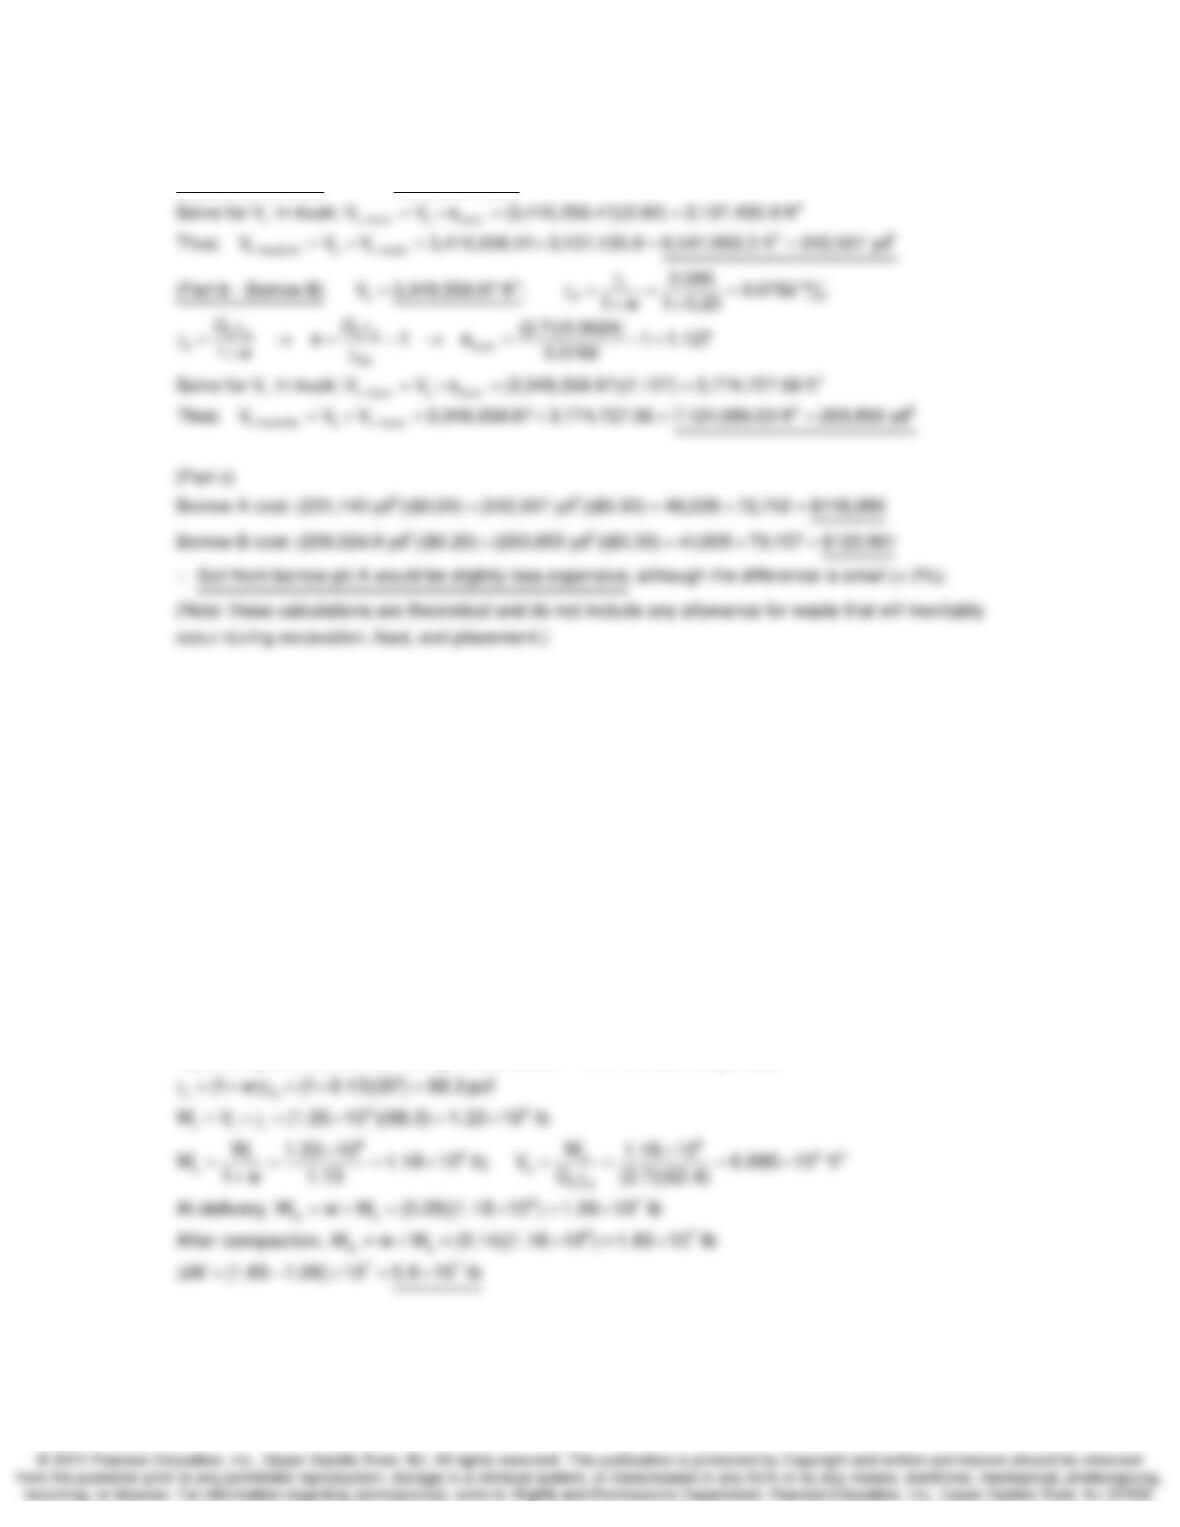
5-7. Two choices for borrow soil are available: It will be necessary to fill a 200,000 yd3
depression, and the fill material must be compacted to 95% of the standard Proctor (maximum)
density. A final 10% moisture content is desired in either case. (a) What is the minimum volume
of borrow from each site needed to fill the depression? (b) What is minimum quantity (volume) of
material from each site to haul? (c) What soil would be cheaper to use?
Borrow A Borrow B
115 pcf Density in place 120 pcf
? Density in transport 95 pcf
0.92 Void ratio in transport ?
25% Water content in place 20%
$0.20/yd3 Cost to excavate $0.10/yd3
$0.30/yd3 Cost to haul $0.40/yd3
2.7 Gs 2.7
112 pcf Maximum Proctor dry density 110 pcf
SOLUTION:
s
s
Recognize that V does not change from borrow pit to truck to fill.
Calculate V based on the required quantity of fill and properties from each borrow pit.
Compaction and Stabilization of Soils Chapter 5
3
s
Problem 5-7 continued.
(Part b – Borrow A) V 3,410,256.41ft
=
5-8. Assume that 50,000 yd3 of the soil from the borrow pit is to be delivered to an embankment
at a construction site. By the time it reaches the site, the water content is 9%. It will be compacted
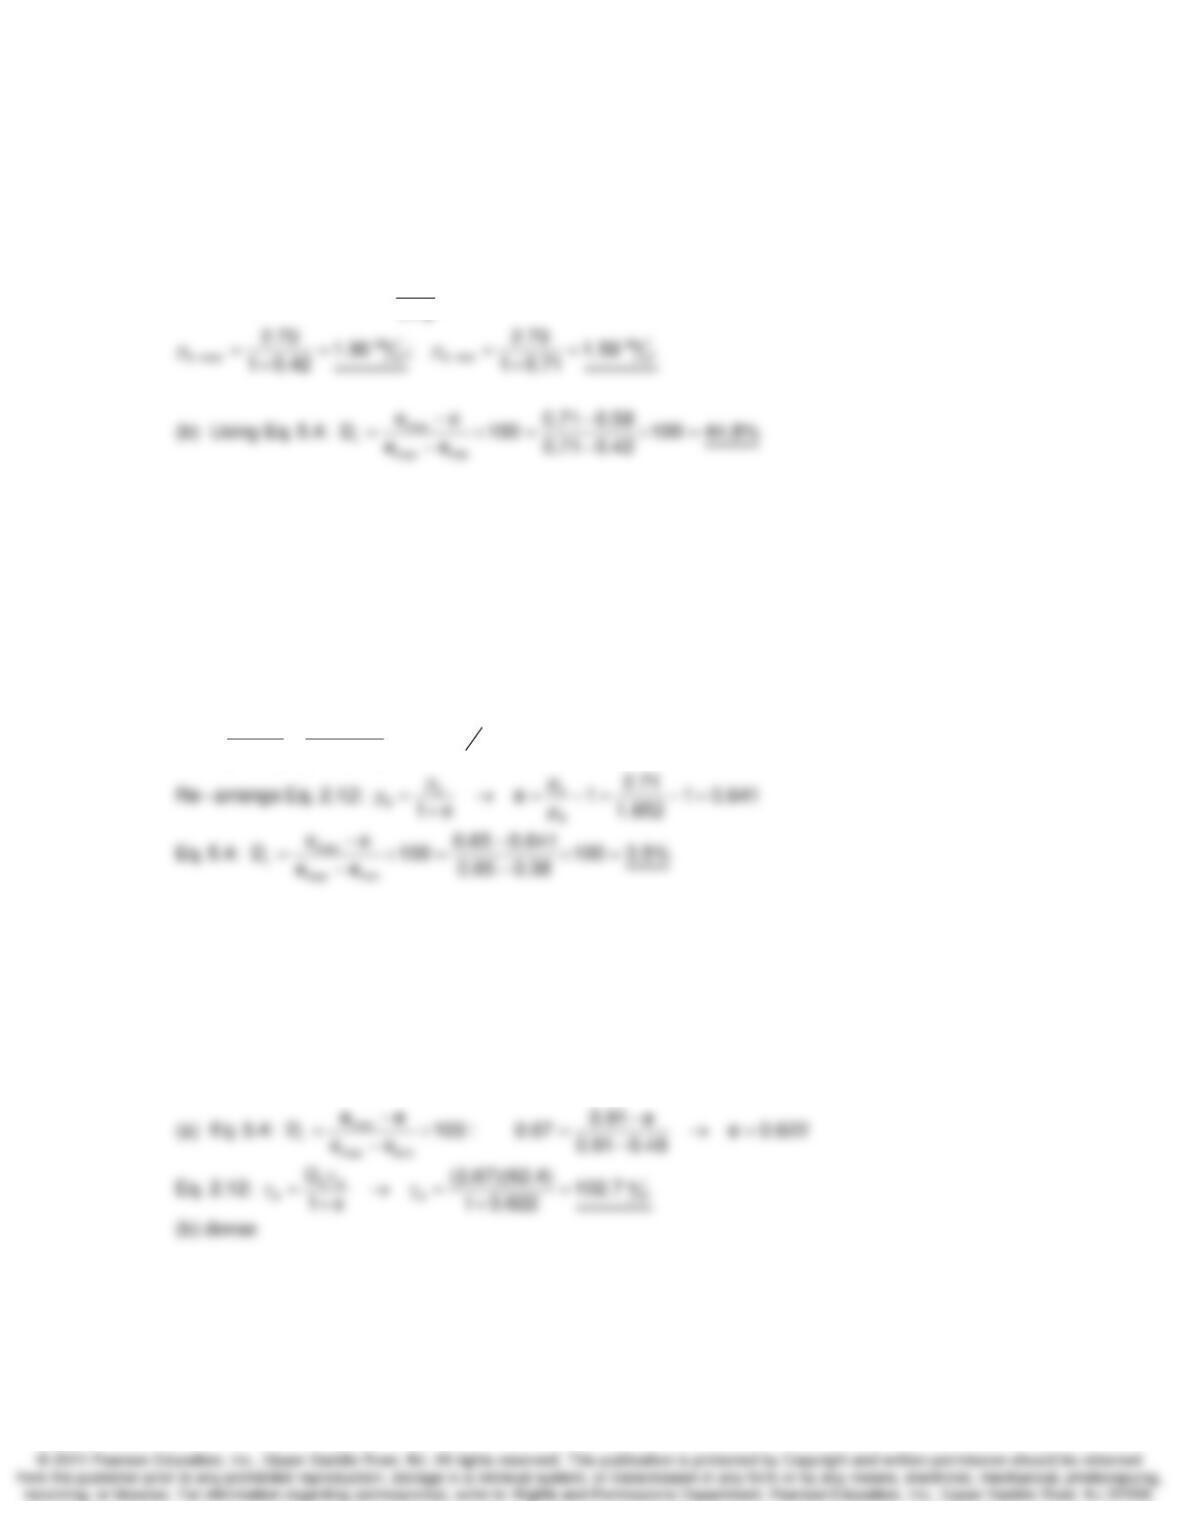
to a minimum of 90% of modified Proctor maximum dry density. Determine the total volume of
water (in ft3) that must be added to the soil to increase the moisture content to the optimum level.
Dry unit weight of soil in borrow pit 87.0 pcf
Moisture content in borrow pi 13.0%
Specific gravity of the soil particles 2.70
Modified Proctor optimum moisture content 14.0%
Modified Proctor maximum dry density 116.0 pcf
SOLUTION:
ss
W and V are conserved during this process. From the borrow pit data:
Compaction and Stabilization of Soils Chapter 5
5-9. The values of emin and emax for a pure silica sand
ρ
s = 2.70 Mg/m3 were found to be 0.42 and
0.71, respectively. (a) What is the corresponding range in dry density? (b) If the in situ void ratio
is 0.58, what is the relative density?
SOLUTION:
s
d
(a) Using Eq. 2.12: 1e
ρ
ρ= +
5-10. The wet density of a sand in an embankment was found to be 1.85 Mg/m3 and the field
water content was 12%. In the laboratory, the density of the solids was found to be 2.71 Mg/m3,
and the maximum and minimum void ratios were 0.65 and 0.38, respectively. Calculate the
relative density of the sand in the field.
SOLUTION:
3
tMg
dry m
(1.85) 1.652
(1 w) (1 0.12)
ρ
ρ= = =
++
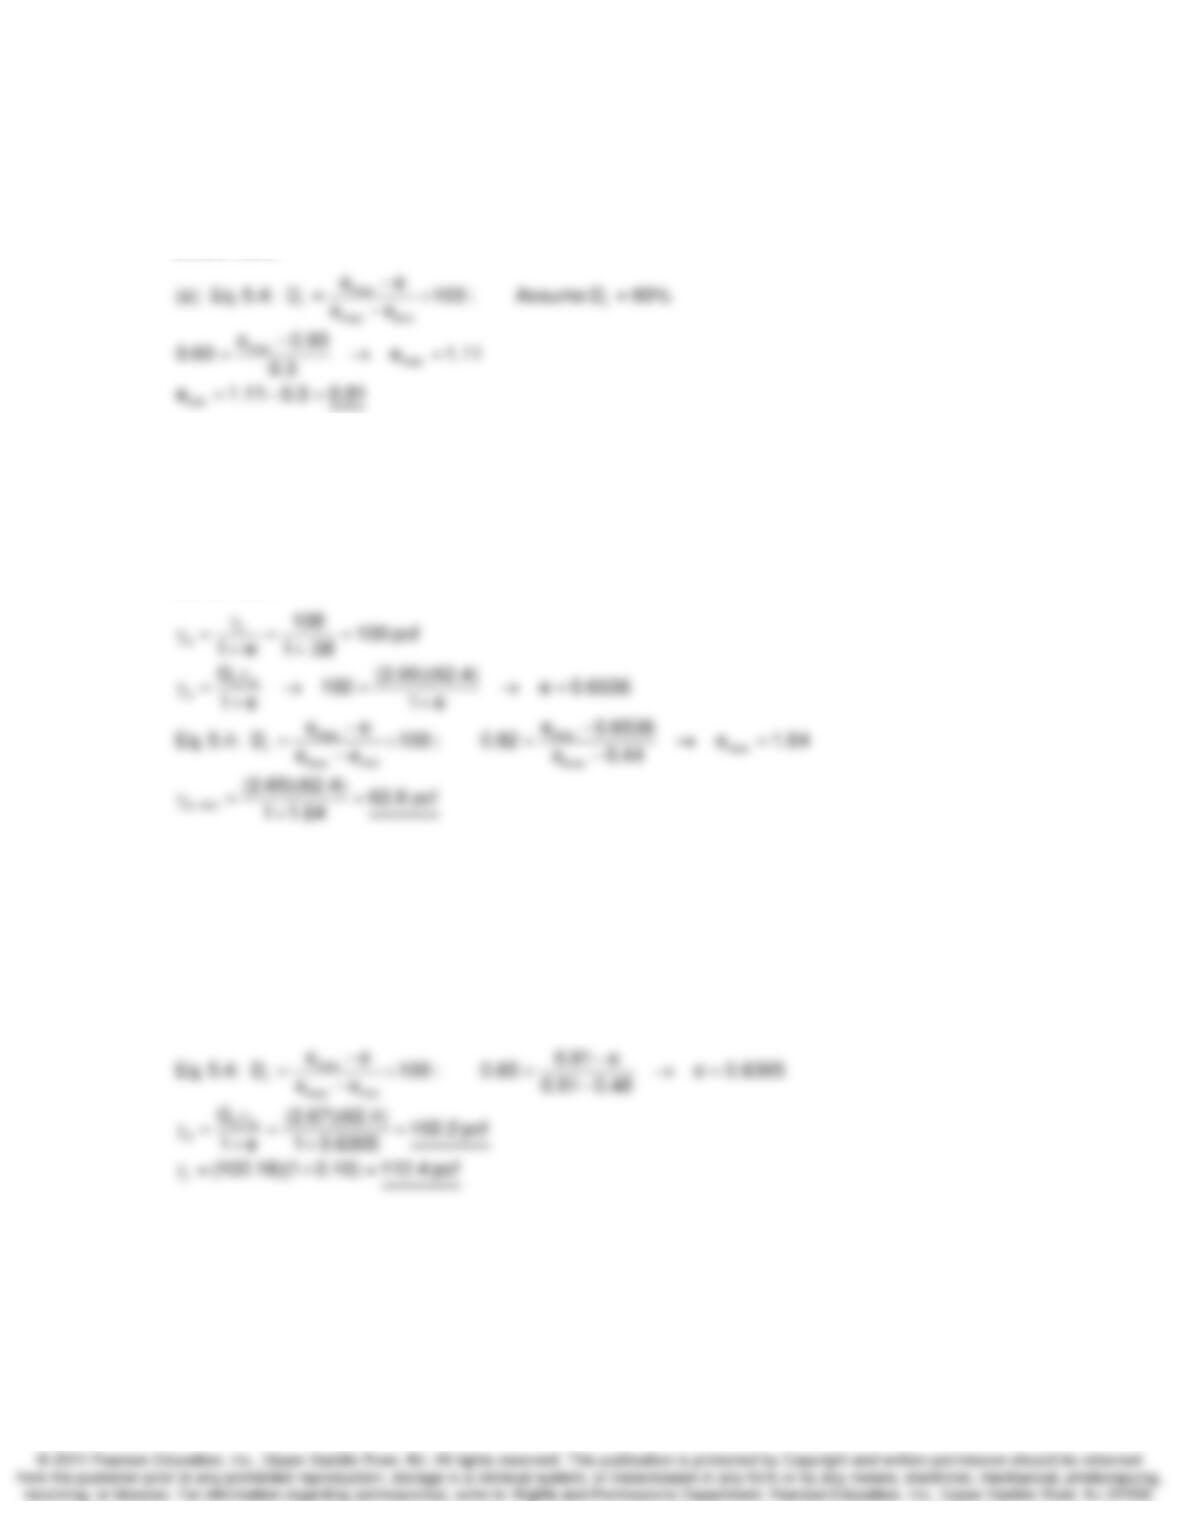
5-11. The laboratory test results on a sand are emax = 0.91, emin = 0.48, and Gs = 2.67.
(a) What is the dry unit weight (in lb/ft3) of this sand when its relative density is 67% and its water
content is 10%? (b) How would you classify the density of this soil?
SOLUTION:
Compaction and Stabilization of Soils Chapter 5
5-12. Based on field data, you have determined that a sand’s relative density is on the borderline
between “medium” and “dense,” and its void ratio is 0.93. For this soil, if the difference between
emin and emax is 0.3, what is emin?
SOLUTION:
5.13. For a granular soil, given
γ
t = 108 pcf, Dr = 82%, w = 8%, and Gs = 2.67. For this soil, if emin
= 0.44, what would be the dry unit weight in the “loosest” state?
SOLUTION:
5-14. The laboratory test results on a sand are as follows: emax = 0.91, emin = 0.48, and Gs = 2.67.
What would be the dry and moist unit weights of this sand, in lb/ft3, when densified at a moisture
content of 10% to a relative density of 65%?
SOLUTION:
Compaction and Stabilization of Soils Chapter 5
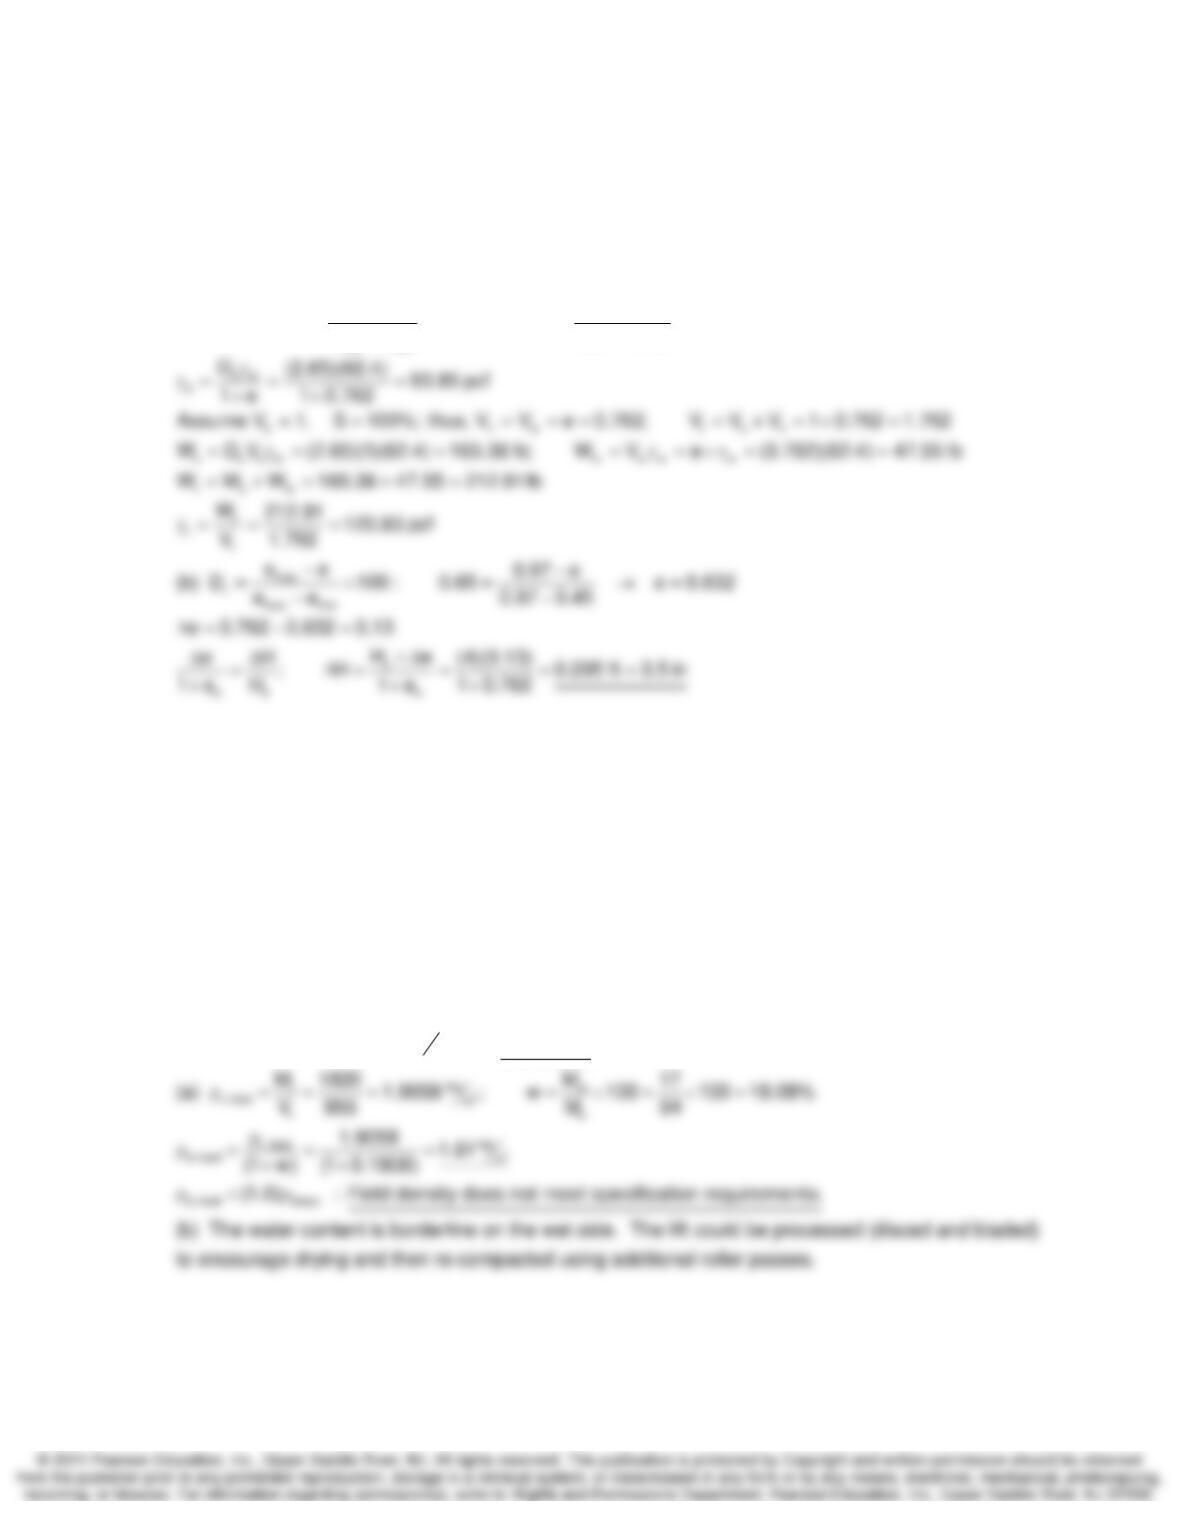
5-15. A sample of sand has a relative density of 40% with a specific gravity of solids of 2.65. The
minimum void ratio is 0.45 and the maximum void ratio is 0.97. (a) What is the unit weight (in
units of pcf ) of this sand in the saturated condition? (b) If the sand is compacted to relative
density of 65%, what will be the decrease in thickness of a 4 ft. thick layer?
SOLUTION:
max
r
max min
ee 0.97 e
(a) Eq. 5.4: D 100 : 0.40 e 0.762
e e 0.97 0.45
−−
=× = →=
−−
5-16. A field compaction control test was conducted on a compacted lift. The mass of the
material removed from the hole was 1820 g and the volume of the hole was found to be 955 cm3.
A small sample of the soil lost 17 g in the drying test and the mass remaining after drying was 94
g. The laboratory control test results are shown in Fig. P5.16. (a) If end-product specification
requires 100% relative compaction and w = (optimum – 3%) to optimum + 1%), determine the
acceptability of the field compaction and state why this is so. (b) If it is not acceptable, what
should be done to improve the compaction so that it will meet the specification?
SOLUTION:
3
Mg
dmax opt
m
From Fig. 5.16, 1.72 and w 17%
ρ= =
Compaction and Stabilization of Soils Chapter 5
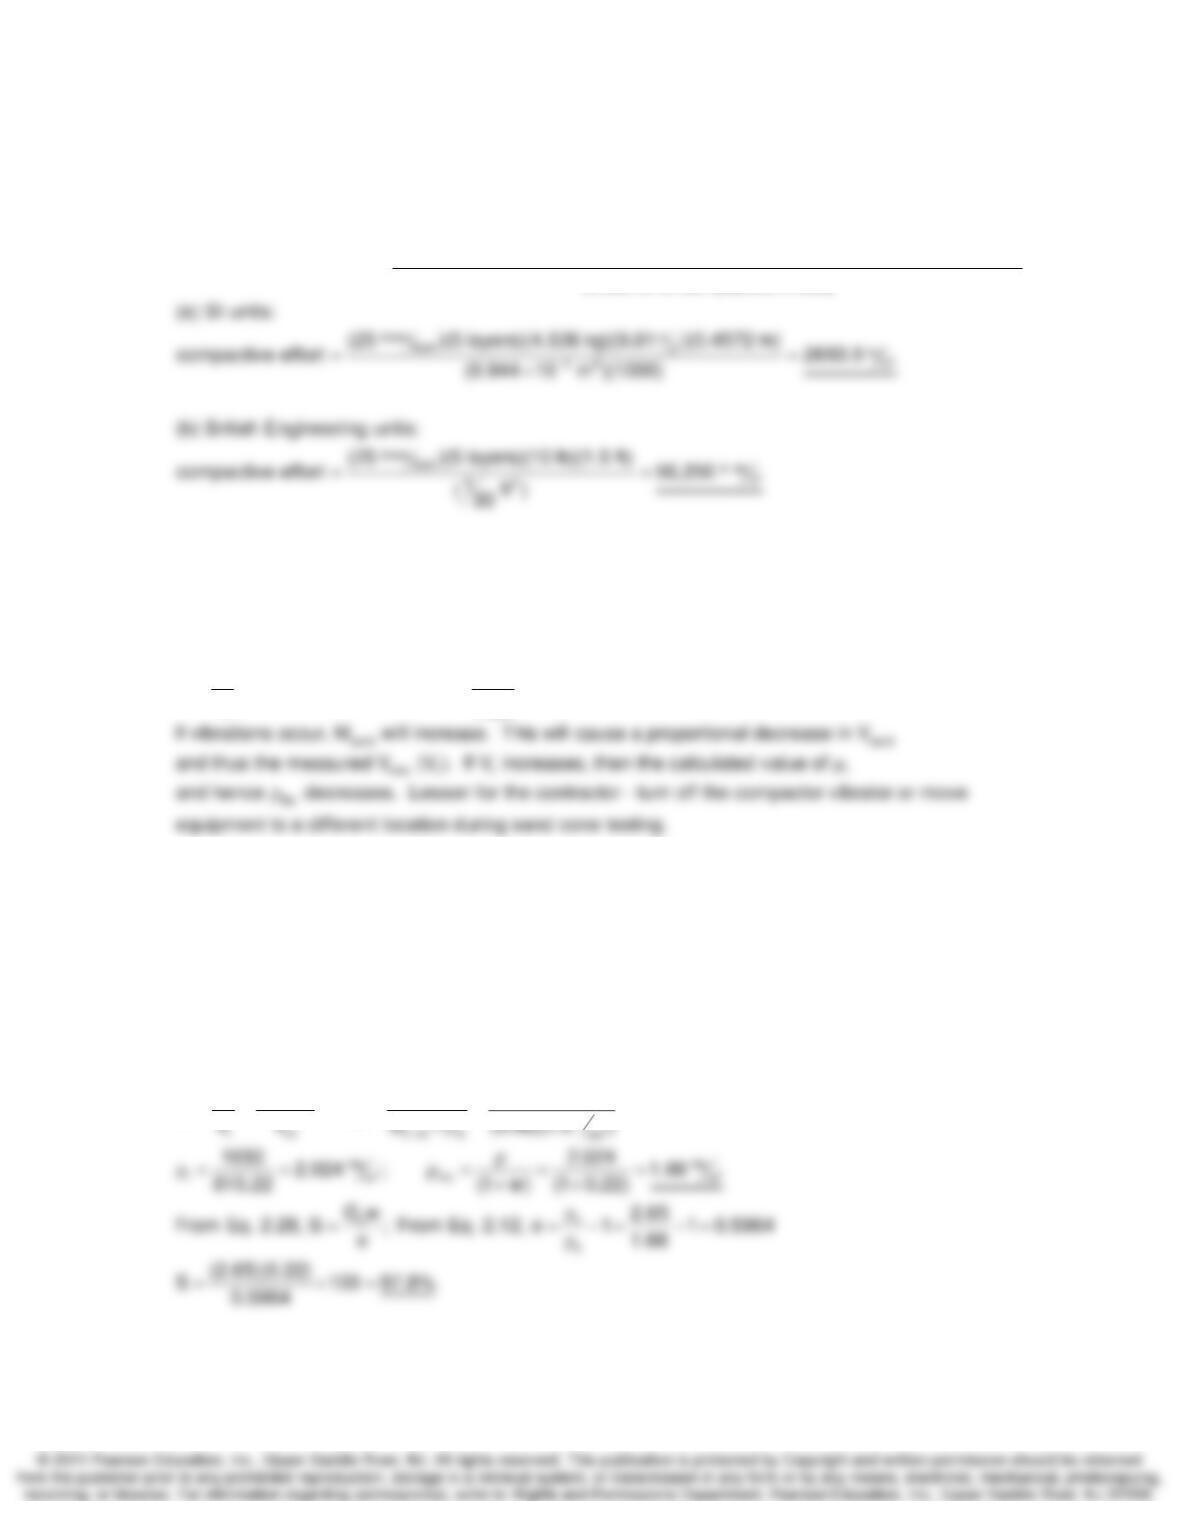
5-17. Calculate the compactive effort of the modified Proctor test in both (a) SI and (b) British
engineering units.
SOLUTION:
(no. of blows per layer)(no. of layers)(wt. of hammer)(ht. of hammer drop)
Modified Proctor Effort = (volume of compaction mold)
5.18. Why does the relative compaction decrease if there is vibration during the sand-cone test?
SOLUTION:
tsand
t t hole sand sand
t sand
MM
;V V V ;V
V
ρ= = = =
ρ
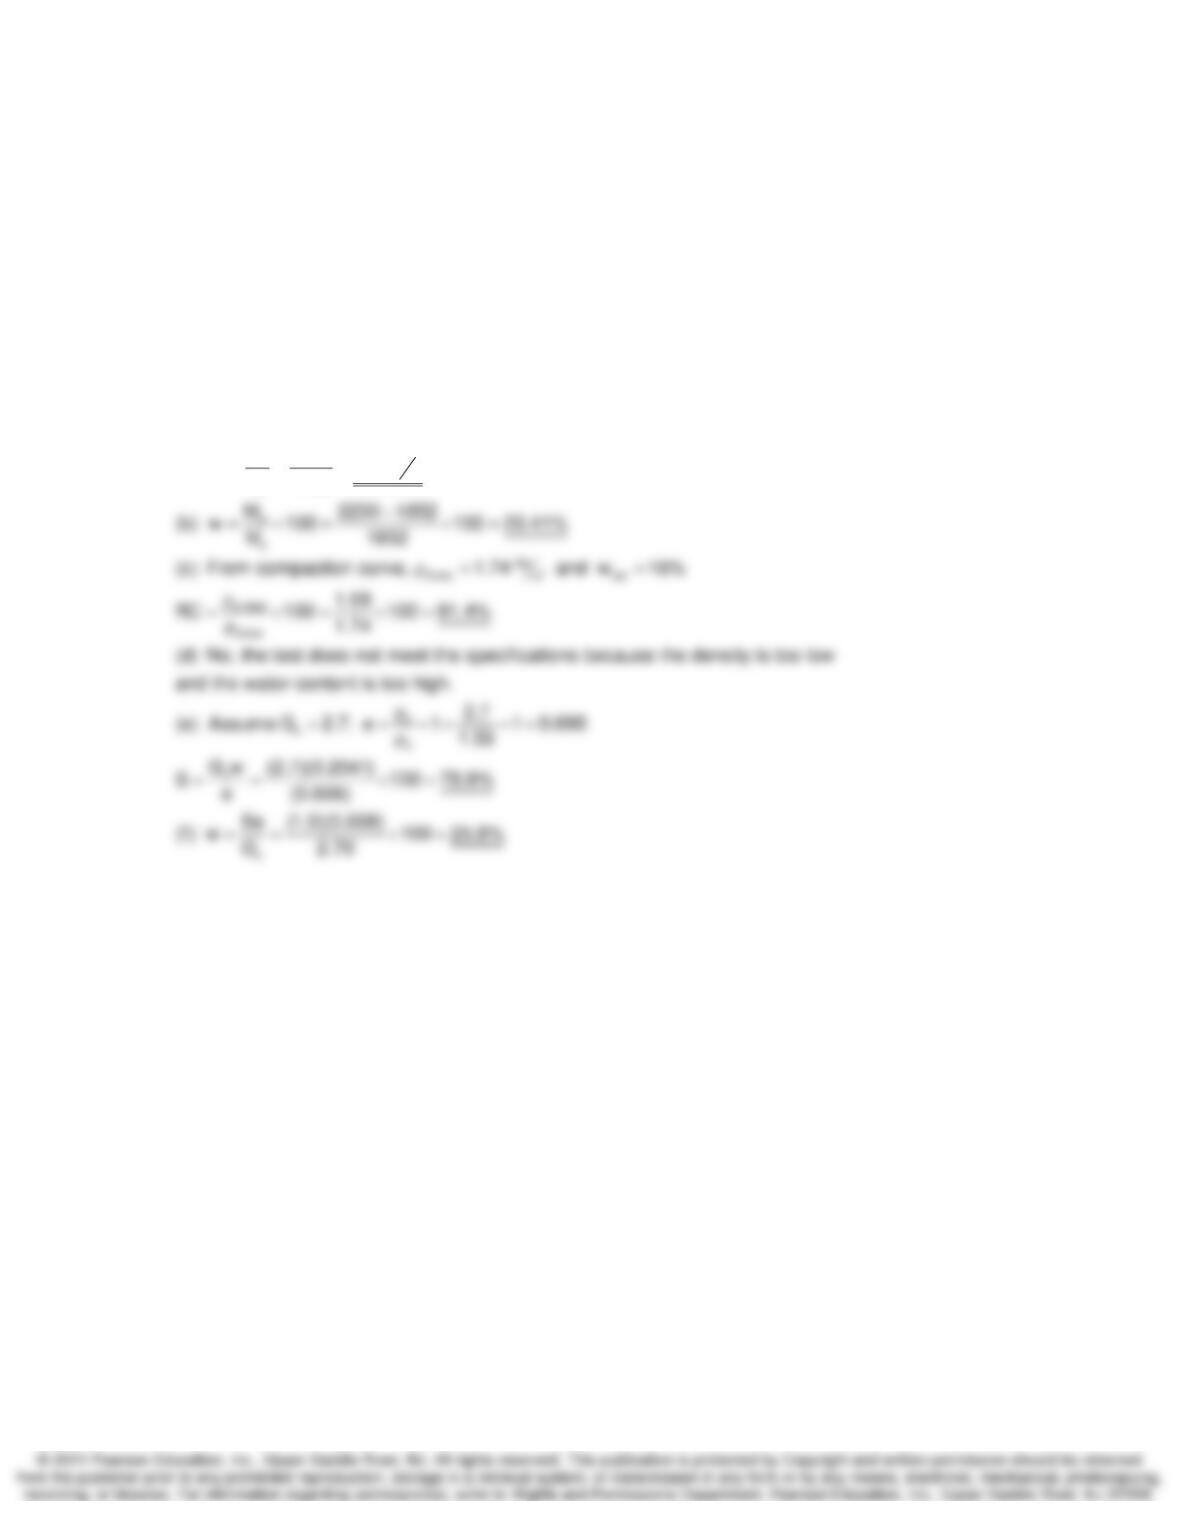
5.19. In a field density test, using the oil method, the wet mass of soil removed from a small hole
in the fill was 1.65 kg. The mass of oil (Gs-oil = 0.92) required to fill the hole was 0.75 kg, and the
field water content was found to be 22%. If the
ρ
s of the soil solids is 2650 kg/m3, what are the dry
density and degree of saturation of the fill?
SOLUTION:
3
toil
toil g
MM
1650 g 750 g
; V 815.22 cm
ρ= = = = =
Compaction and Stabilization of Soils Chapter 5
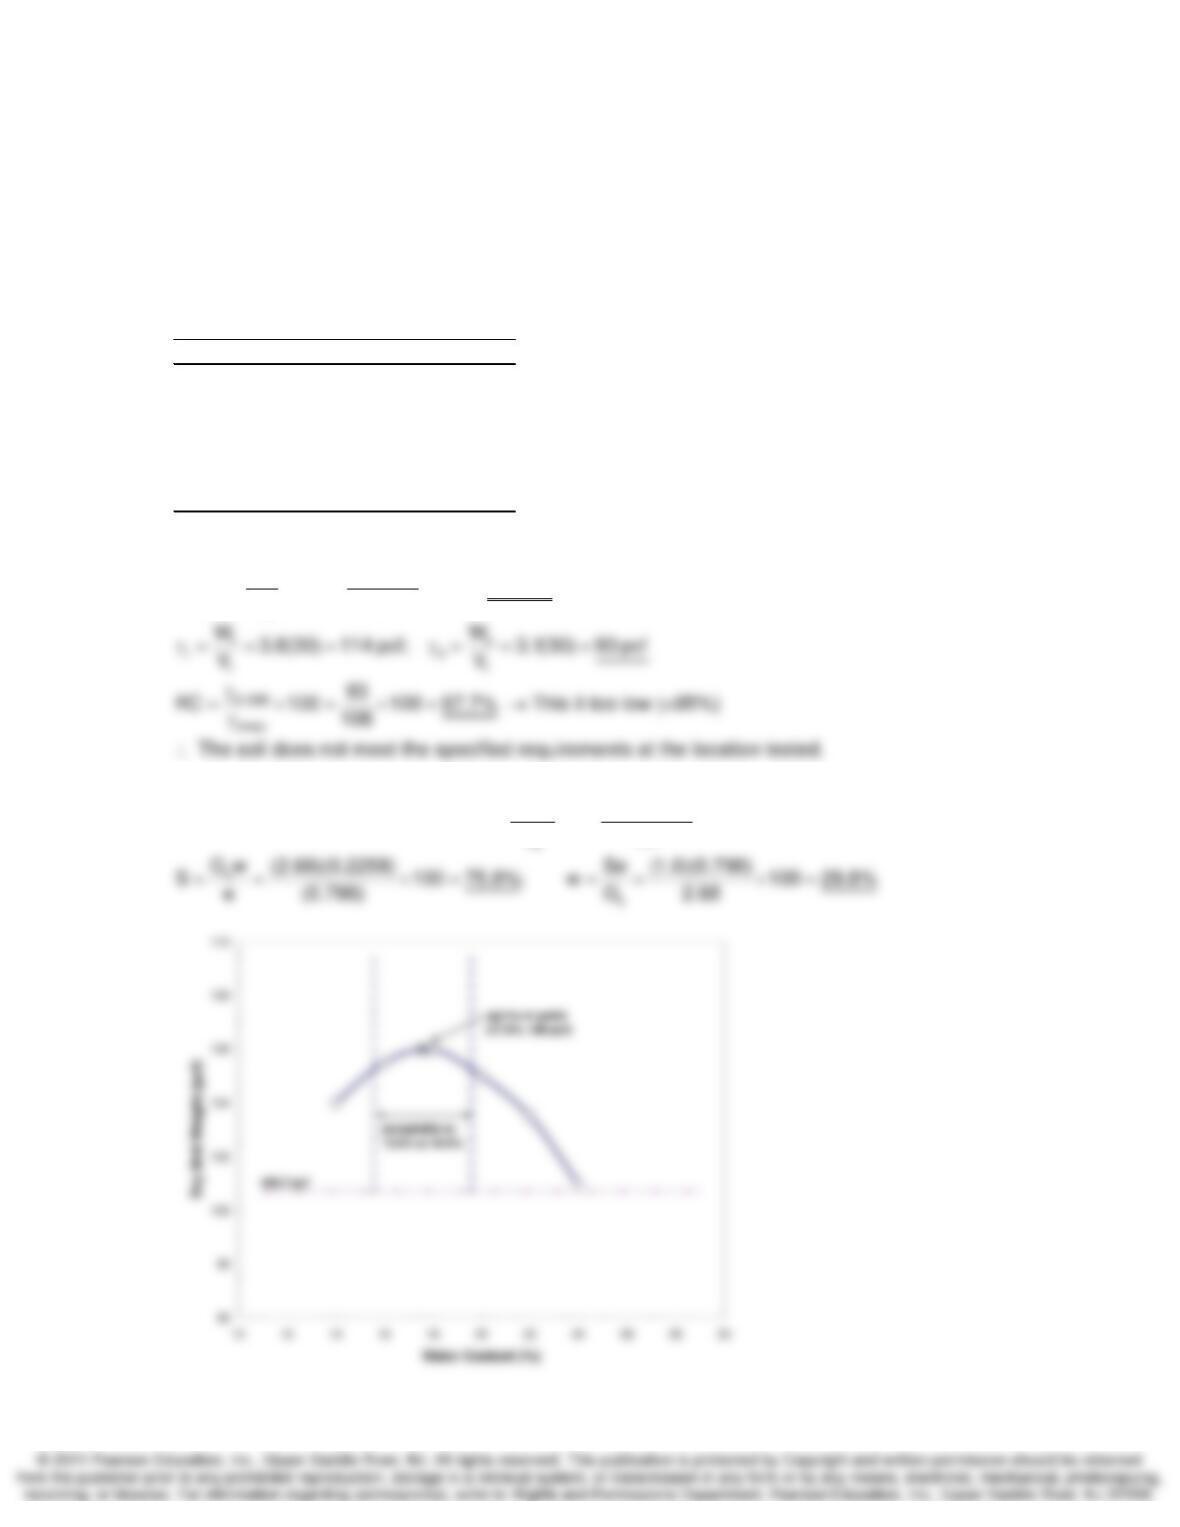
5-20. You are an earthwork construction control inspector checking the field compaction of a
layer of soil. The laboratory compaction curve is shown in Fig. P5.20. Specifications call for the
compacted density to be at least 95% of the maximum laboratory value and within 2% of the
optimum water content. When you did the sand cone test, the volume of soil excavated was 1165
cm3. It weighed 2230 g wet and 1852 g dry.
(a) What is the compacted dry density? (b) What is the field water content? (c) What is the
relative compaction? (d) Does the test meet specifications? (e) What is the degree of saturation
of the field sample? (f) If the sample were saturated at constant density, what would be the water
content?
SOLUTION:
3
sMg
dm
t
M1852
(a) 1.59
V 1165
ρ= = =
Compaction and Stabilization of Soils Chapter 5
5-21. The specification for compaction states that the field-compacted soil must be at least 95%
of the maximum control density and within 2% of the optimum moisture for the control curve. You
dig a hole 1/30 ft3 in the compacted layer and extract a sample that weighs 3.8 lb wet and 3.1 lb
dry. (a) What is the compacted γd? The compaction w? The percent compaction? Does the
sample meet the specifications? (b) If the density of solids is 2.68 Mg/m3 what is the compacted
degree of saturation? If the sample were saturated at constant density, what would be the water
content? (After C.W. Lovell.)
Water Content (%) Dry Unit Weight (pcf)
14 104
16 105.5
18 106
20 105
22 103.5
24 101
SOLUTION:
w
s
W3.8 3.1
(a) w 100 100 22.58% This is too high (>19.6%)
W3.1
−
=×= ×= →
sw
s
G2.68(62.4)
(b) G 2.68; Using Eq. 2.28; e 1 1 0.798
93
γ
==−=−=
γ
Compaction and Stabilization of Soils Chapter 5
5-22. A mixture contains 28% by dry weight fines and 72% coarse. When the coarse material
has w = 3%, its affinity for water is completely satisfied. The fines have a PL = 22 and an LL = 34.
This mixture is compacted by rolling to
ρ
d = 128 pcf and w = 13%. What is the water content of
the fines in the compacted mass? What is the liquidity index of the fines in the compacted mass?
(After C.W. Lovell.)
SOLUTION:
wc wf
The weight of water in the coarse and fine fractions are symbolically
defined here as W and W ,respectively
−−
Compaction and Stabilization of Soils Chapter 5
5-23. A soil proposed for a compacted fill contains 38% fines and 62% coarse material by dry
weight. When the coarse fraction has w = 2.0%, its affinity for water is completely satisfied (that
is, it is saturated but surface dry). The Atterberg limits of the fines are LL=31 and PL = 13. The
soil is compacted by rolling to a
ρ
d = 1.96 Mg/m3 at w = 15%. (a) What is the water content of the
fines in the compacted mass? (b) What is the likely classification of the soil? (USCS and
AASHTO) (c) What is the liquidity index of the fines?
SOLUTION:
(a) The mass of water in the coarse and fine fractions are symbolically
defined here as M and M , respectively
Compaction and Stabilization of Soils Chapter 5
5-27. Given: The data shown in Fig. 5.4. Soil types 3 and 4 are mixed in the borrow area to some
unknown extent. After a representative sample of the combined material is air dried to a uniform
water content (hopefully on the dry side of optimum), a compaction test is performed and a value
of 1.85 Mg/m3 dry density at 12.5% water content is obtained. (a) Estimate the maximum dry
density of the combined soils. (b) If a field dry density of 1.54 Mg/m3 is obtained after compaction
by a sheepsfoot roller, compute the relative compaction.
SOLUTION:
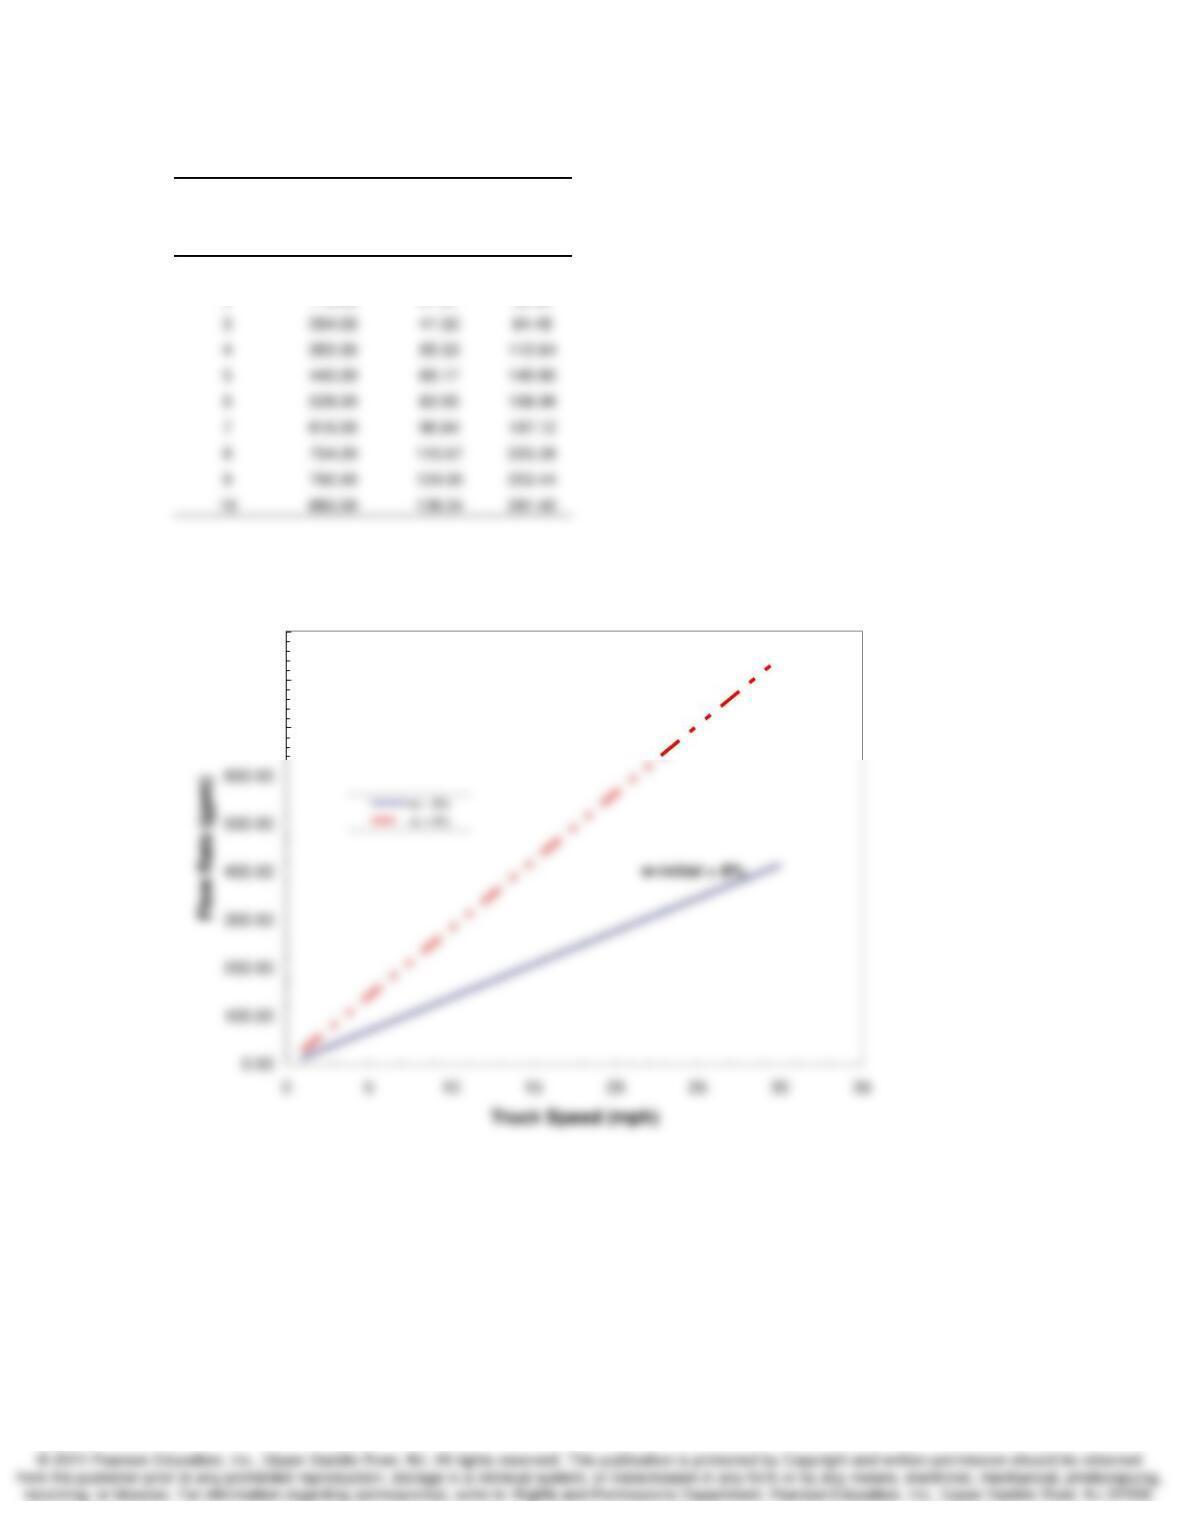
(a) On Fig. 5.4, plot the data point (12.5, 1.85) and draw a compaction curve through the data point
5-29. A contractor is placing soil in 10-in. loose lifts, each at about 85 pcf. The moisture content
is 8% at the time of placement. The optimum water content for this soil is 10%.The contractor has
a water truck with a spray bar on the back. How fast should the truck move with the spray running
at some flow rate? Make a plot of gal/min from the spray bar (ordinate) versus speed of the truck
in mph (abscissa) for the driver to use. Use a spreadsheet to create the data and corresponding
plots. Extra credit: Make a similar plot, for a soil with a 6% initial water content. (After D. Elton.)
SOLUTION:
initial
tt
(a) w 8%
V (w)(x)(t); t 0.833 ft, w 1ft V 0.833x
=
===→=
for an i
nitial water content of 8%.
Compaction and Stabilization of Soils Chapter 5
5-29 continued.
w
i
= 8% w
i
= 6%
truck speed truck speed flow rate flow rate
(mph) (ft/min) (gal/min) (gal/min)
1 88.00 13.83 28.16
2 176.00 27.67 56.32
700.00
800.00
900.00
w-initial = 6%