Unlock document.
This document is partially blurred.
Unlock all pages and 1 million more documents.
Get Access
85
WHAT’S NEW IN THE SEVENTH EDITION:
There are no major changes to this chapter.
LEARNING OBJECTIVES:
By the end of this chapter, students should understand:
➢ the meaning of the elasticity of demand.
➢ what determines the elasticity of demand.
➢ the meaning of the elasticity of supply.
➢ what determines the elasticity of supply.
➢ the concept of elasticity in three very different markets (the market for wheat, the market for oil, and
the market for illegal drugs).
CONTEXT AND PURPOSE:
Chapter 5 is the second chapter of a three-chapter sequence that deals with supply and demand and how
markets work. Chapter 4 introduced supply and demand. Chapter 5 shows how much buyers and sellers
respond to changes in market conditions. Chapter 6 will address the impact of government polices on
competitive markets.
The purpose of Chapter 5 is to add precision to the supply-and-demand model. We introduce the
concept of elasticity, which measures the responsiveness of buyers and sellers to changes in economic
variables such as prices and income. The concept of elasticity allows us to make quantitative observations
about the impact of changes in supply and demand on equilibrium prices and quantities.
KEY POINTS:
• The price elasticity of demand measures how much the quantity demanded responds to changes in
the price. Demand tends to be more elastic if close substitutes are available, if the good is a luxury
5
ELASTICITY AND ITS
APPLICATION
86 ❖ Chapter 5/Elasticity and Its Application
rather than a necessity, if the market is narrowly defined, or if buyers have substantial time to react
to a price change.
• The price elasticity of demand is calculated as the percentage change in quantity demanded divided
• Total revenue, the total amount paid for a good, equals the price of the good times the quantity sold.
For inelastic demand curves, total revenue moves in the same direction as the price. For elastic
demand curves, total revenue moves in the opposite direction as the price.
• The income elasticity of demand measures how much the quantity demanded responds to changes in
consumers’ income. The cross-price elasticity of demand measures how much the quantity demanded
of one good responds to the price of another good.
• The price elasticity of supply measures how much the quantity supplied responds to changes in the
price. This elasticity often depends on the time horizon under consideration. In most markets, supply
is more elastic in the long run than in the short run.
• The tools of supply and demand can be applied in many different kinds of markets. This chapter uses
them to analyze the market for wheat, the market for oil, and the market for illegal drugs.
CHAPTER OUTLINE:
I. The Elasticity of Demand
A. Definition of elasticity: a measure of the responsiveness of quantity demanded or
quantity supplied to one of its determinants.
B. The Price Elasticity of Demand and Its Determinants
1. Definition of price elasticity of demand: a measure of how much the quantity
demanded of a good responds to a change in the price of that good, computed as
the percentage change in quantity demanded divided by the percentage change in
price.
2. Determinants of the Price Elasticity of Demand
Chapter 5/Elasticity and Its Application ❖ 87
c. Definition of the market: narrowly defined markets (ice cream) have more elastic
demand than broadly defined markets (food).
C. Computing the Price Elasticity of Demand
1. Formula
2. Example: the price of ice cream rises by 10% and quantity demanded falls by 20%.
Price elasticity of demand = (20%)/(10%) = 2
D. The Midpoint Method: A Better Way to Calculate Percentage Changes and Elasticities
1. Because we use percentage changes in calculating the price elasticity of demand, the
elasticity calculated by going from one point to another on a demand curve will be different
from an elasticity calculated by going from the second point to the first. This difference arises
because the percentage changes are calculated using a different base.
a. A way around this problem is to use the midpoint method.
b. Using the midpoint method involves calculating the percentage change in either price or
quantity demanded by dividing the change in the variable by the midpoint between the
initial and final levels rather than by the initial level itself.
c. Example: the price rises from $4 to $6 and quantity demanded falls from 120 to 80.
Work through a few elasticity calculations, starting with the example in the book. For
principles of economics courses where there is no mathematical prerequisite, this
may be difficult for some students. Working through a few simple examples will help
to alleviate some of the students’ anxiety. Show every step of the algebra involved.
Students hate this! Explain that it really makes things easier and makes more sense
because larger elasticities (in absolute value) imply greater sensitivity and
responsiveness.
% change in quantity demanded
Price elasticity of demand = % change in price
88 ❖ Chapter 5/Elasticity and Its Application
price elasticity of demand = 40/40 = 1
E. The Variety of Demand Curves
1. Classification of Elasticity
a. When the price elasticity of demand is greater than one, demand is defined to be elastic.
( - ) /[( ) / ]
( - ) /[( ) / ]
2 1 1 2
2 1 1 2
2
Price elasticity of demand = 2
+
+
Q Q Q Q
P P P P
To clearly show the differences between relatively elastic and relatively inelastic
demand curves, draw a graph on the board showing a relatively flat demand curve
and one showing a relatively steep demand curve. Show that any given change in
price will result in a larger change in quantity demanded if the demand curve is
relatively flat. Use the same method when discussing the shape of the supply curve
later in the chapter.
Activity 1—How the Ball Bounces
Type: In-class demonstration
Topics: Elastic, inelastic
Materials needed: One rubber ball and one “dead” ball. The “dead” ball is made of
shock-absorbing material and doesn’t bounce. Museum stores and
magic shops carry them.
Time: 1 minute
Class limitations: Works in any size class
Purpose
This quick, but memorable, demonstration can be used to introduce the concepts of elastic
and inelastic.
Instructions
Bring two students to the front of the class. Give each of them a ball and ask them to bounce
it off the floor and catch it. The student with the rubber ball can do this easily. The student
Figure 1
Chapter 5/Elasticity and Its Application ❖ 89
2. In general, the flatter the demand curve that passes through a given point, the more elastic
the demand.
3. Extreme Cases
a. When the price elasticity of demand is equal to zero, the demand is perfectly inelastic
and is a vertical line.
4.
FYI: A Few Elasticities from the Real World
Make sure that you provide several examples of goods with these types of demand
curves. You may want to point out that students will see the perfectly elastic demand
curve again when competitive firms are discussed.
90 ❖ Chapter 5/Elasticity and Its Application
F. Total Revenue and the Price Elasticity of Demand
1. Definition of total revenue: the amount paid by buyers and received by sellers of a
good, computed as the price of the good times the quantity sold.
2. If demand is inelastic, the percentage change in price will be greater than the percentage
change in quantity demanded.
3. If demand is elastic, the percentage change in quantity demanded will be greater than the
percentage change in price.
a. If price rises, quantity demanded falls, and total revenue will fall (because the increase in
4. If demand is unit elastic, the percentage change in price will be equal to the percentage
change in quantity demanded.
a. If price rises, quantity demanded falls, and total revenue will remain the same (because
the increase in price will be equal to the decrease in quantity demanded).
Figure 2
Another term for price times quantity is “total expenditure.” This term is sometimes
used in questions found in the study guide and test bank. It is also important to
point this out when discussing the market for illegal drugs at the end of the chapter.
Students find the relationship between changes in total revenue and elasticity difficult
to understand. It may take several thorough discussions of this material before
students will be able to master it.
Figure 3
Chapter 5/Elasticity and Its Application ❖ 91
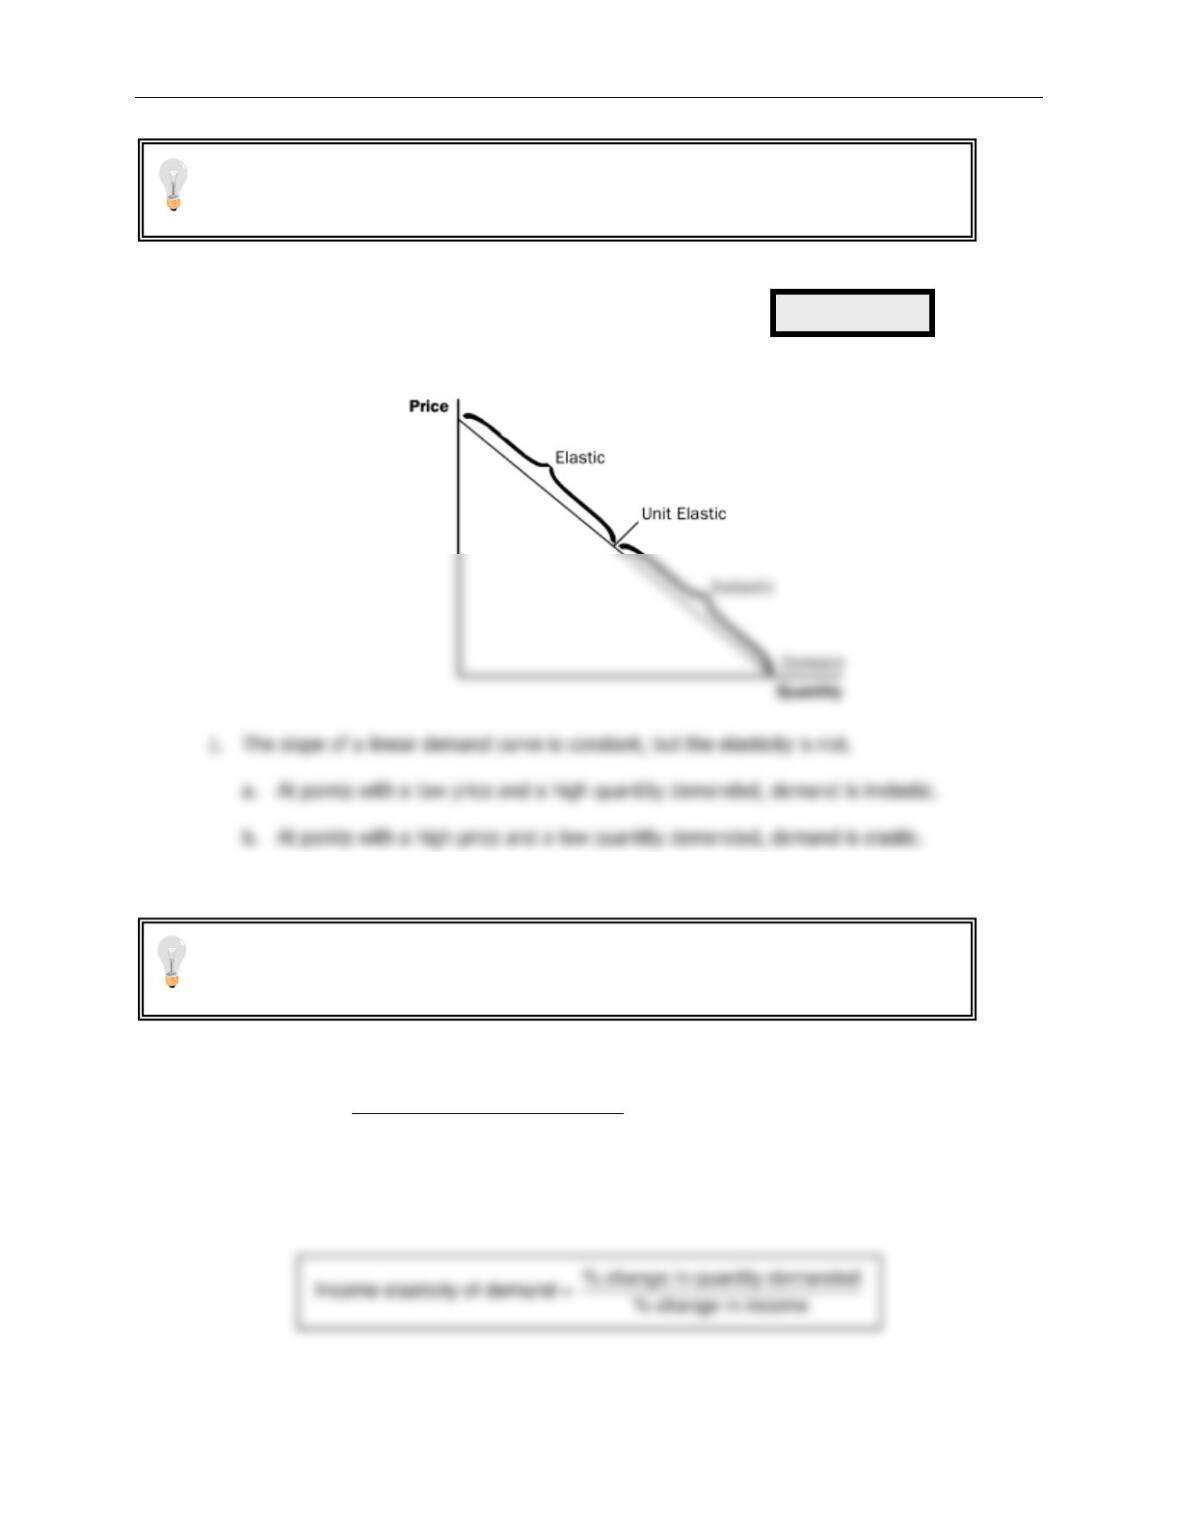
G. Elasticity and Total Revenue along a Linear Demand Curve
2. Total revenue also varies at each point along the demand curve.
H. Other Demand Elasticities
1. Definition of income elasticity of demand: a measure of how much the quantity
demanded of a good responds to a change in consumers’ income, computed as the
percentage change in quantity demanded divided by the percentage change in
income.
a. Formula
Figure 4
Point out the usefulness of elasticity from a business owner’s point of view. Students
should be able to see why a firm’s manager would want to know the elasticity of
demand for the firm’s products.
Note that when demand is elastic and price falls, total revenue rises. Also point out
that once demand is inelastic, any further decrease in price results in a decrease in
total revenue.
92 ❖ Chapter 5/Elasticity and Its Application
b. Normal goods have positive income elasticities, while inferior goods have negative
income elasticities.
c. Necessities tend to have small income elasticities, while luxuries tend to have large
income elasticities.
2. Definition of cross-price elasticity of demand: a measure of how much the quantity
demanded of one good responds to a change in the price of another good,
computed as the percentage change in the quantity demanded of the first good
divided by the percentage change in the price of the second good.
a. Formula
b. Substitutes have positive cross-price elasticities, while complements have negative cross-
price elasticities.
ALTERNATIVE CLASSROOM EXAMPLE:
John’s income rises from $20,000 to $22,000 and the quantity of hamburger he buys each
week falls from 2 pounds to 1 pound.
% change in quantity demanded of good 1
Cross-price elasticity of demand = % change in price of good 2
ALTERNATIVE CLASSROOM EXAMPLE:
The price of apples rises from $1.00 per pound to $1.50 per pound. As a result, the quantity
of oranges demanded rises from 8,000 per week to 9,500.
Because the cross-price elasticity is positive, the two goods are substitutes.
Make sure that you explain to students why the signs of the income elasticity and the
cross-price elasticity matter. This will undoubtedly lead to some confusion because
we ignore the sign of the own-price elasticity of demand. You may want to put
together a table to present this distinction to students.
Chapter 5/Elasticity and Its Application ❖ 93
II. The Elasticity of Supply
A. The Price Elasticity of Supply and Its Determinants
1. Definition of price elasticity of supply: a measure of how much the quantity
supplied of a good responds to a change in the price of that good, computed as
the percentage change in quantity supplied divided by the percentage change in
price.
2. Determinants of the Price Elasticity of Supply
B. Computing the Price Elasticity of Supply
1. Formula
2. Example: the price of milk increases from $2.85 per gallon to $3.15 per gallon and the
quantity supplied rises from 9,000 to 11,000 gallons per month.
% change in price = (3.15 – 2.85)/3.00 × 100 = 10%
% change in quantity supplied = (11,000 – 9,000)/10,000 × 100 = 20%
Price elasticity of supply = (20%)/(10%) = 2
C. The Variety of Supply Curves
1. In general, the flatter the supply curve that passes through a given point, the more elastic
the supply.
2. Extreme Cases
3. Because firms often have a maximum capacity for production, the elasticity of supply may be
very high at low levels of quantity supplied and very low at high levels of quantity supplied.
% change in quantity supplied
Price elasticity of supply = % change in price
Figure 5
Figure 6
94 ❖ Chapter 5/Elasticity and Its Application
III. Three Applications of Supply, Demand, and Elasticity
A. Can Good News for Farming Be Bad News for Farmers?
1. A new hybrid of wheat is developed that is more productive than those used in the past.
What happens?
2. Supply increases, price falls, and quantity demanded rises.
3. If demand is inelastic, the fall in price is greater than the increase in quantity demanded and
total revenue falls.
4. If demand is elastic, the fall in price is smaller than the rise in quantity demanded and total
revenue rises.
5. In practice, the demand for basic foodstuffs (like wheat) is usually inelastic.
a. This means less revenue for farmers.
b. Because farmers are price takers, they still have the incentive to adopt the new hybrid so
that they can produce and sell more wheat.
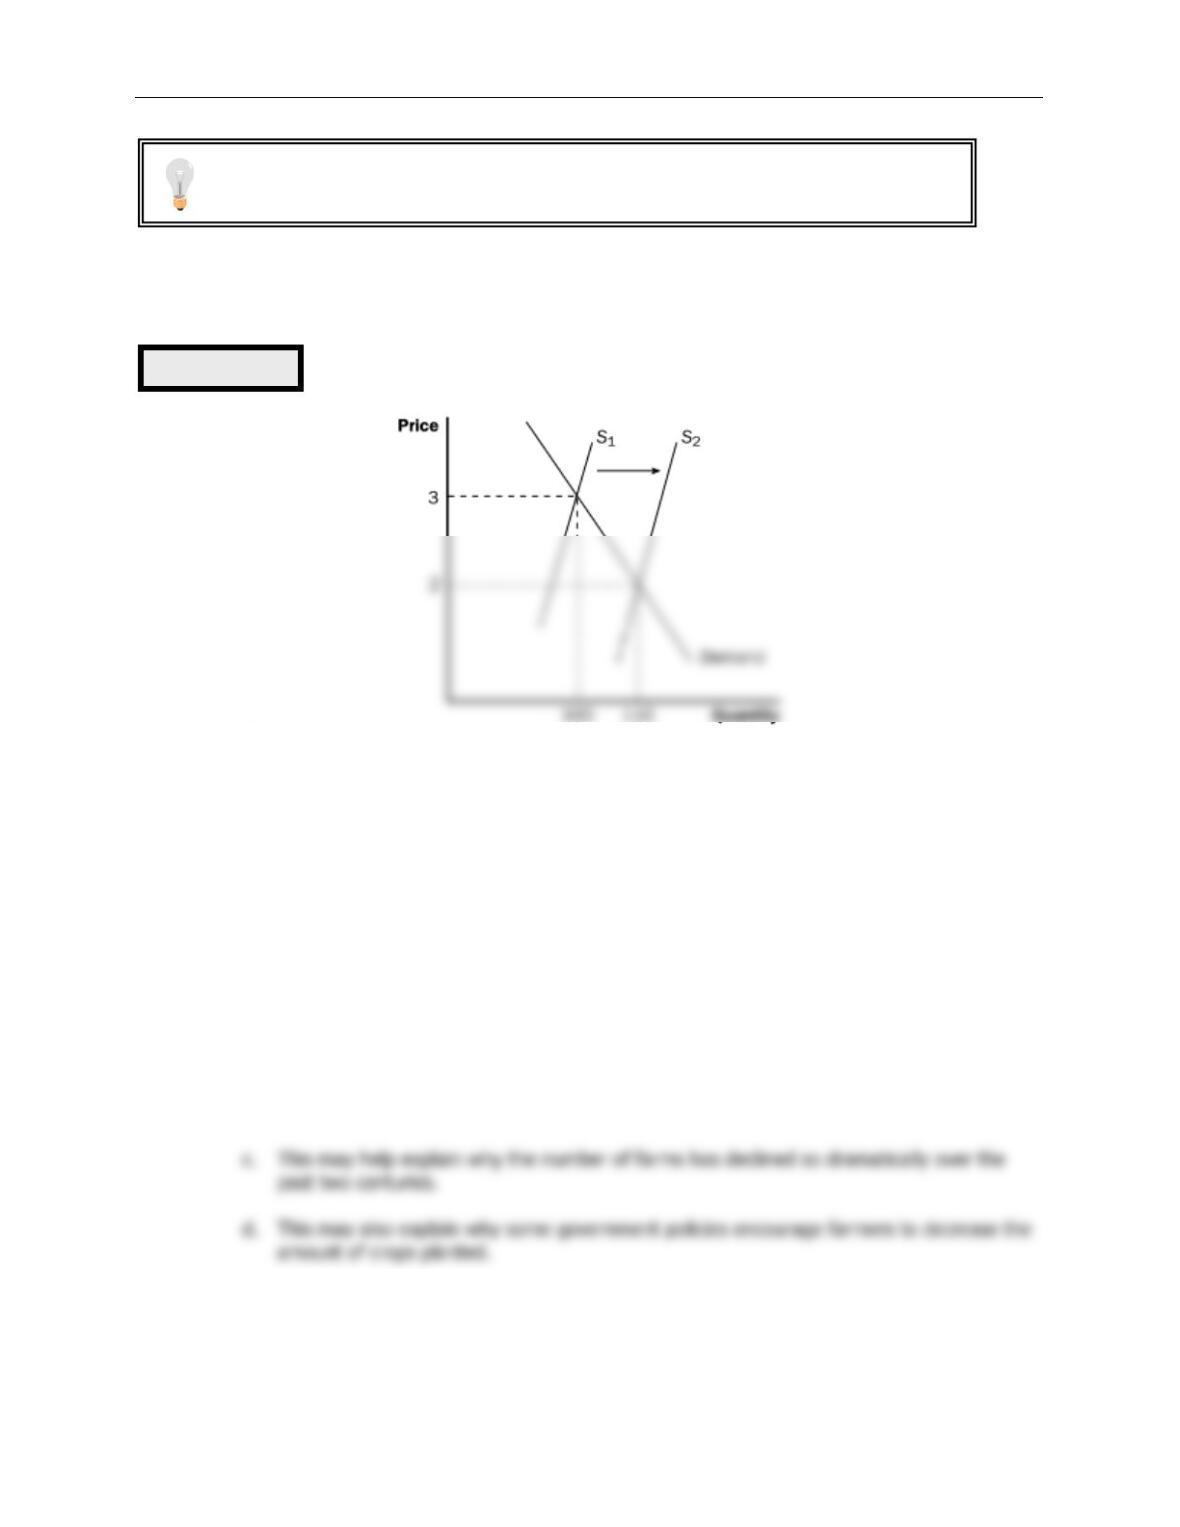
B. Why Did OPEC Fail to Keep the Price of Oil High?
Figure 7
Again, you may want to present several examples of goods that may have supply
curves like these.
Chapter 5/Elasticity and Its Application ❖ 95
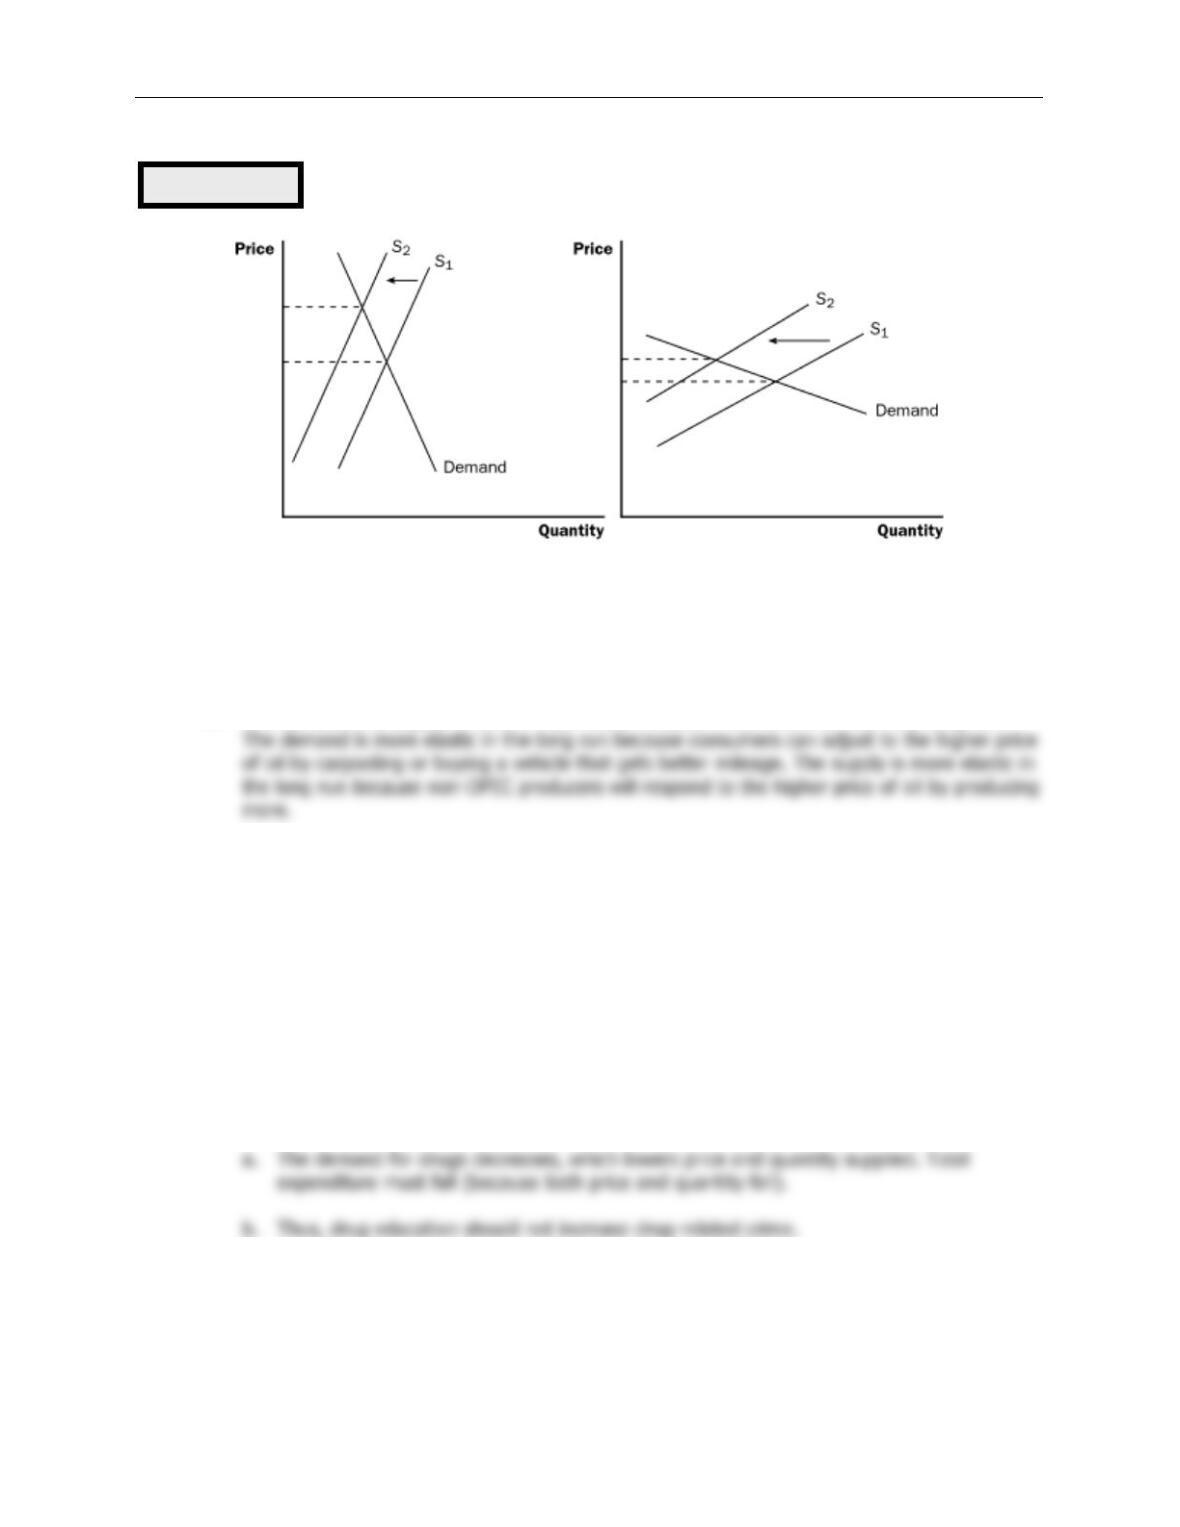
1. In the 1970s and 1980s, OPEC reduced the amount of oil it was willing to supply to world
markets. The decrease in supply led to an increase in the price of oil and a decrease in
quantity demanded. The increase in price was much larger in the short run than the long run.
Why?
2. The demand and supply of oil are much more inelastic in the short run than the long run.
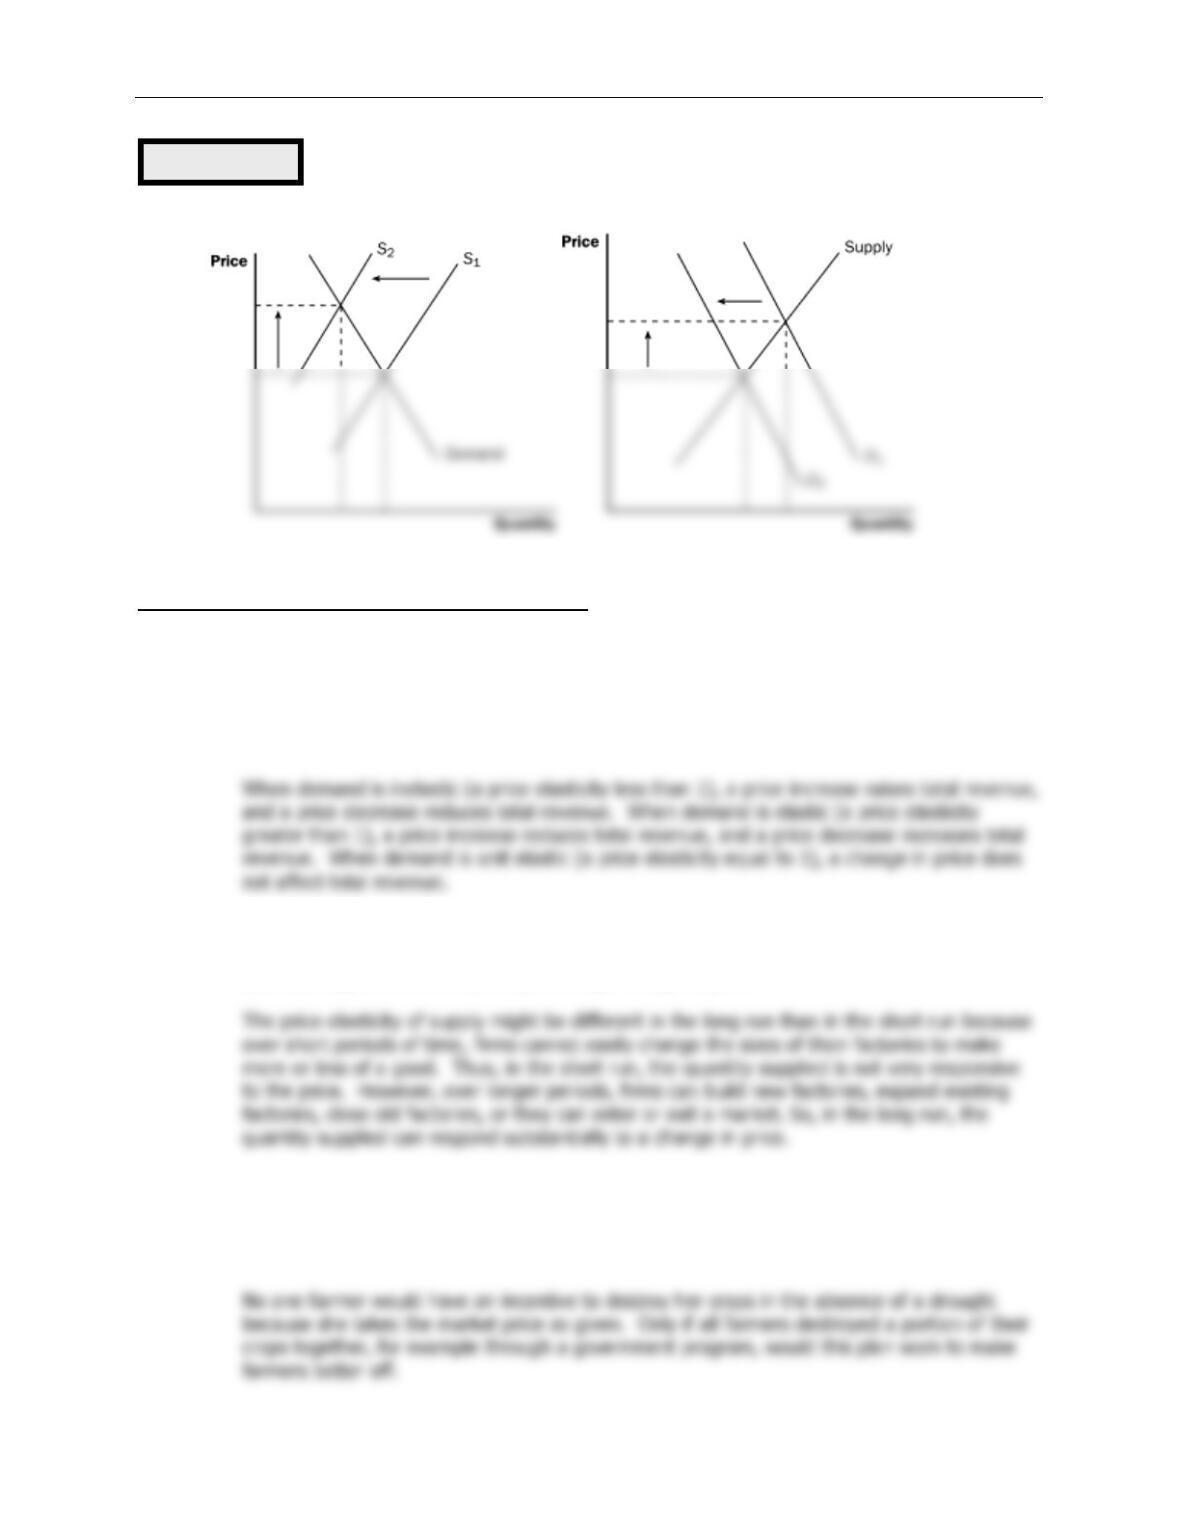
C. Does Drug Interdiction Increase or Decrease Drug-Related Crime?
1. The federal government increases the number of federal agents devoted to the war on
drugs. What happens?
a. The supply of drugs decreases, which raises the price and leads to a reduction in
quantity demanded. If demand is inelastic, total expenditure on drugs (equal to total
revenue) will increase. If demand is elastic, total expenditure will fall.
b. Thus, because the demand for drugs is likely to be inelastic, drug-related crime may rise.
2. What happens if the government instead pursued a policy of drug education?
Figure 8
Short Run
Long Run
96 ❖ Chapter 5/Elasticity and Its Application
SOLUTIONS TO TEXT PROBLEMS:
Quick Quizzes
1. The price elasticity of demand is a measure of how much the quantity demanded of a good
responds to a change in the price of that good, computed as the percentage change in
quantity demanded divided by the percentage change in price.
2. The price elasticity of supply is a measure of how much the quantity supplied of a good
responds to a change in the price of that good, computed as the percentage change in
quantity supplied divided by the percentage change in price.
3. A drought that destroys half of all farm crops could be good for farmers (at least those
unaffected by the drought) if the demand for the crops is inelastic. The shift to the left of
the supply curve leads to a price increase that will raise total revenue if the price elasticity of
demand is less than 1.
Figure 9
(a) Drug Interdiction
(b) Drug Education
Chapter 5/Elasticity and Its Application ❖ 97
Questions for Review
1. The price elasticity of demand measures how much quantity demanded responds to a change
2. The determinants of the price elasticity of demand include the availability of close
3. An elasticity greater than one means that demand is elastic. When the elasticity is greater
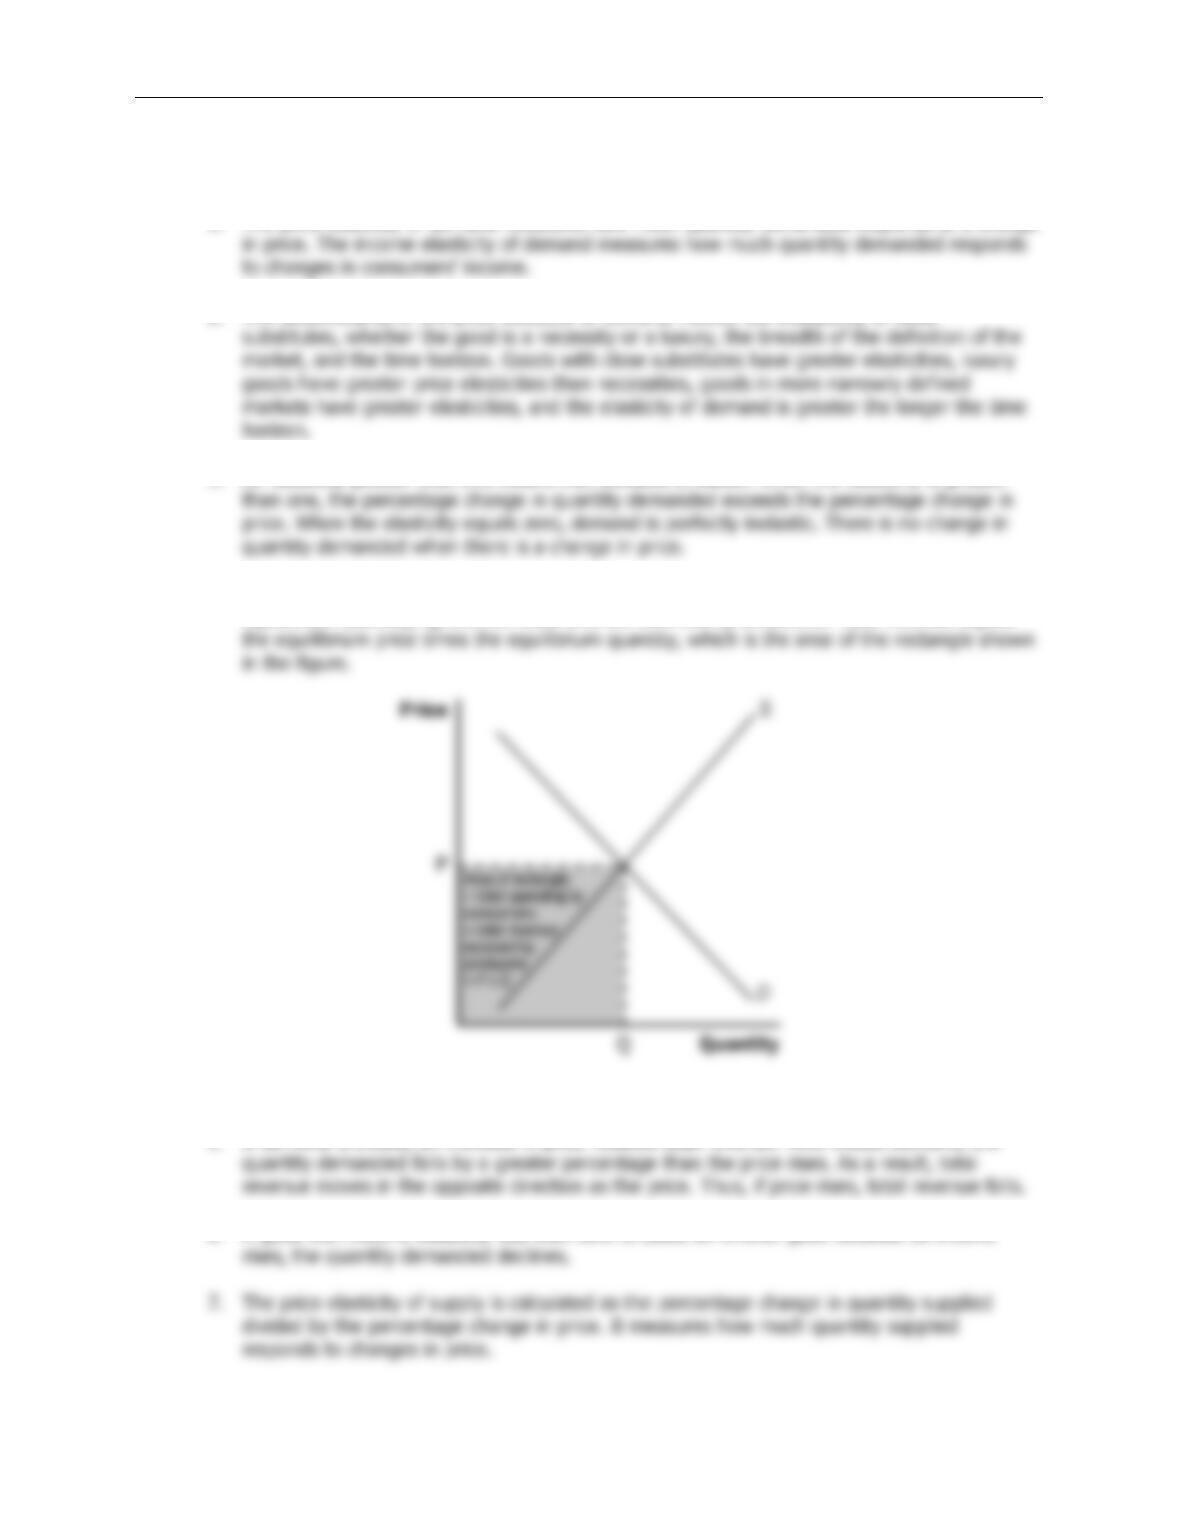
4. Figure 1 presents a supply-and-demand diagram, showing the equilibrium price, P, the
equilibrium quantity, Q, and the total revenue received by producers. Total revenue equals
Figure 1
5. If demand is elastic, an increase in price reduces total revenue. With elastic demand, the
6. A good with income elasticity less than zero is called an inferior good because as income
98 ❖ Chapter 5/Elasticity and Its Application
8. If a fixed quantity of a good is available and no more can be made, the price elasticity of
Quick Check Multiple Choice
Problems and Applications
1. a. Mystery novels have more elastic demand than required textbooks because mystery
c. Subway rides during the next five years have more elastic demand than subway rides
during the next six months. Goods have a more elastic demand over longer time
d. Root beer has more elastic demand than water. Root beer is a luxury with close
Chapter 5/Elasticity and Its Application ❖ 99
b. The price elasticity of demand for vacationers is higher than the elasticity for business
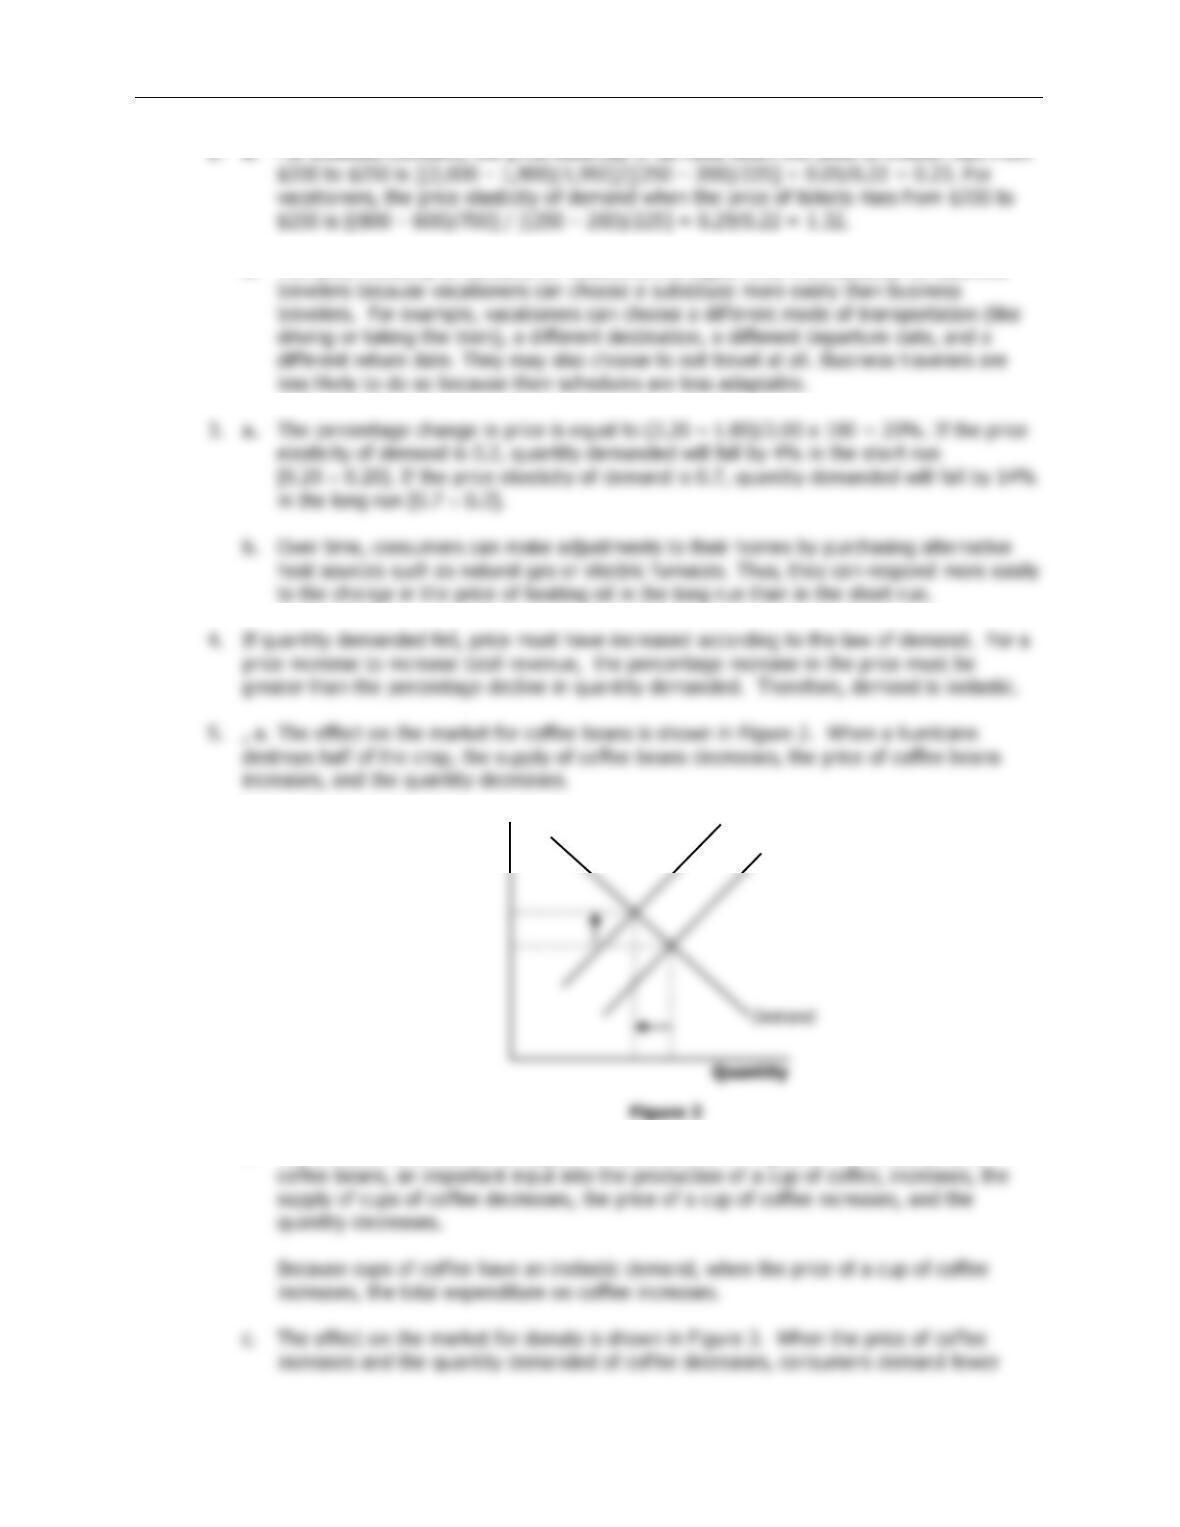
b. The effect on the market for cups of coffee is shown in Figure 2. When the price of
Price
S1
S2
100 ❖ Chapter 5/Elasticity and Its Application
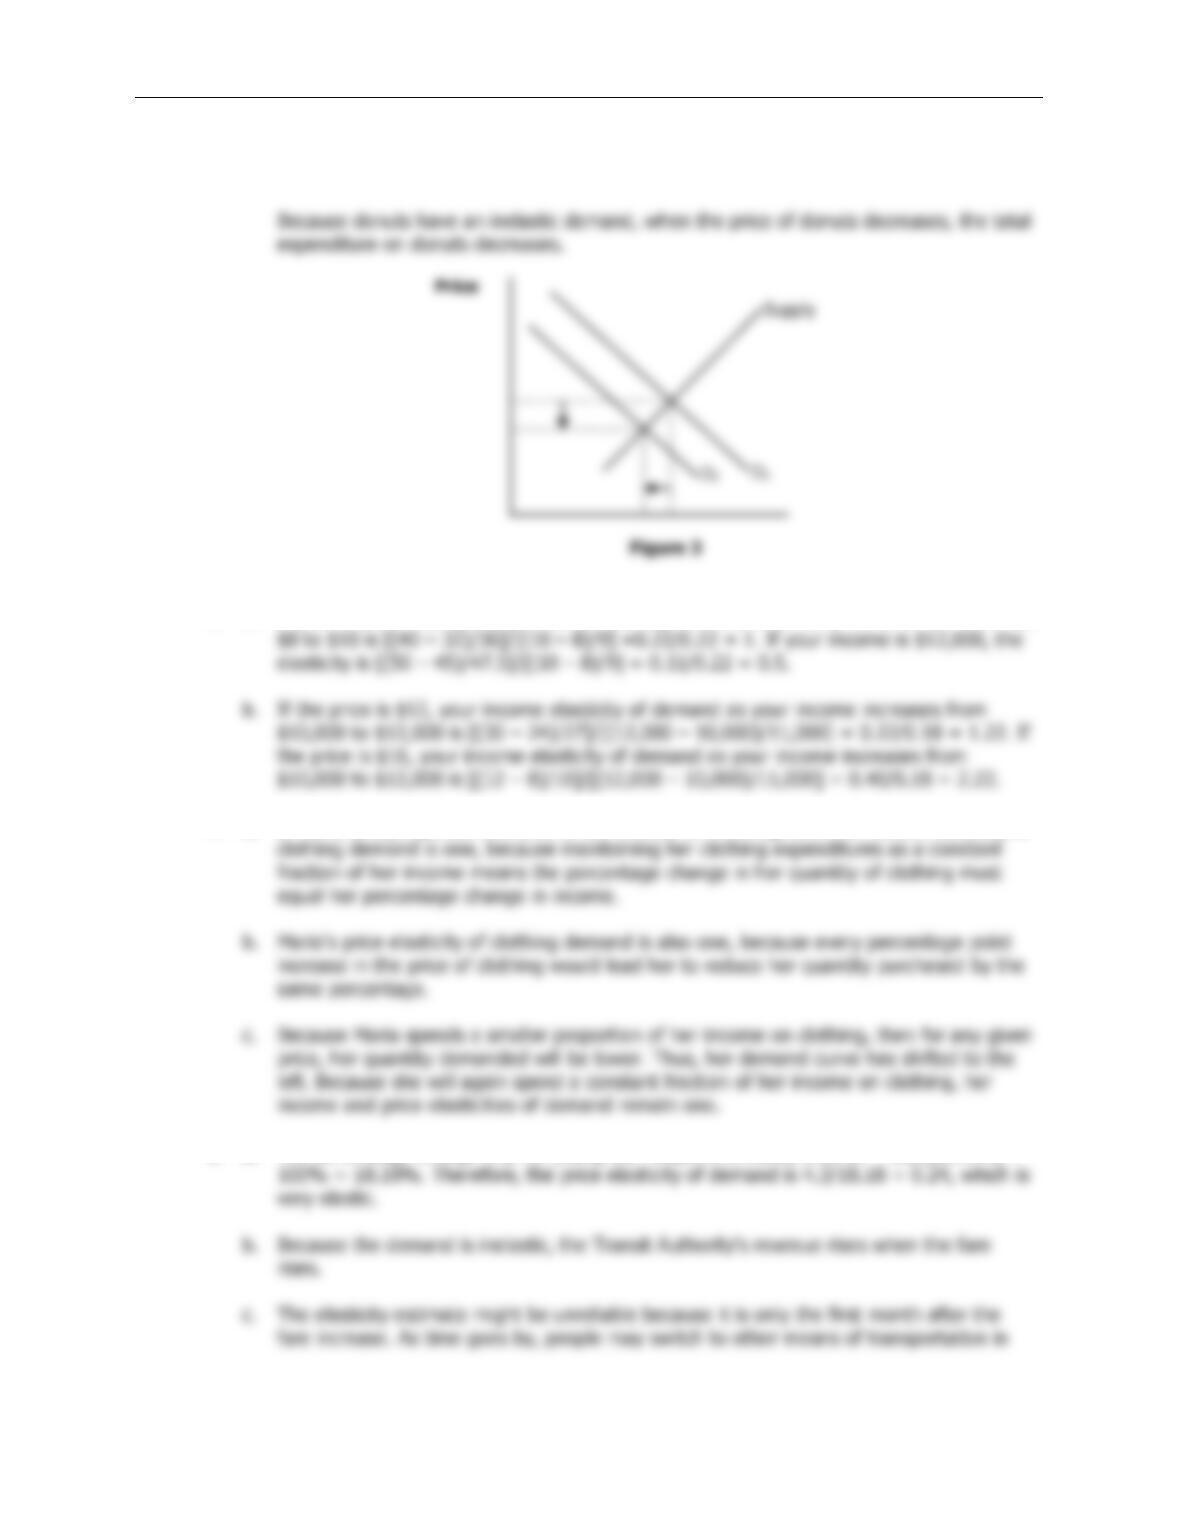
donuts because coffee and donuts are complements. When demand decreases, the price
of donuts decreases.
6. a. If your income is $10,000, your price elasticity of demand as the price of DVDs rises from
7. a. If Maria always spends one-third of her income on clothing, then her income elasticity of
8. a. The percentage change in price (using the midpoint formula) is (1.50 – 1.25)/(1.375) ×
Chapter 5/Elasticity and Its Application ❖ 101
9. Walt's price elasticity of demand is zero, because he wants the same quantity regardless of
10. a. With a price elasticity of demand of 0.4, reducing the quantity demanded of cigarettes by
11. To determine whether you should increase or decrease the price of admissions, you need to
12. A worldwide drought could increase the total revenue of farmers if the price elasticity of
demand for grain is inelastic. The drought reduces the supply of grain, but if demand is


