3
Chapter 5
Lecture Notes
Chapter theme: Cost-volume-profit (CVP) analysis helps
managers understand the interrelationships among cost,
volume, and profit by focusing their attention on the
I. The basics of cost-volume-profit (CVP) analysis
Learning Objective 1: Explain how changes in activity
affect contribution margin and net operating income.
A. The contribution income statement is helpful to
managers in judging the impact on profits of changes in
selling price, cost, or volume. For example, let’s look at
a hypothetical contribution income statement for
Racing Bicycle Company (RBC). Notice:
2
iv. Sales, variable expenses, and contribution margin
can also be expressed on a per unit basis. Thus:
1. For each additional unit RBC sells, $200
more in contribution margin will help to
cover fixed expenses and provide a profit.
operating income will increase by $200.
v. You do not need to prepare an income statement to
estimate profits at a particular sales volume. Simply
multiply the number of units sold above break-even
by the contribution margin per unit.
1. For example, if RBC sells 430 bikes, its net
B. CVP relationships in equation form (for those who
prefer an algebraic approach to solving problems in the
chapter)
i. The contribution format income statement can be
5
9
10
7
16
ii. When a company has only one product we can
further refine this equation as shown on this slide.
iii. The profit equation can also be expressed in terms
unit contribution margin as shown on this slide.
C. CVP relationships in graphic form
i. The relationships among revenue, cost, profit, and
volume can be expressed graphically by preparing a
cost-volume-profit (CVP) graph. To illustrate, we
will use contribution income statements for RBC at
0, 200, 400, and 600 units sold.
ii. In a CVP graph, unit volume is represented on the
horizontal (X) axis and dollars on the vertical (Y)
axis. A CVP graph can be prepared in three steps.
17
18
14
12
13
expenses (e.g., fixed and variable) at that
sales volume. Draw a line through the data
iii. Interpreting the CVP graph.
1. The break-even point is where the total
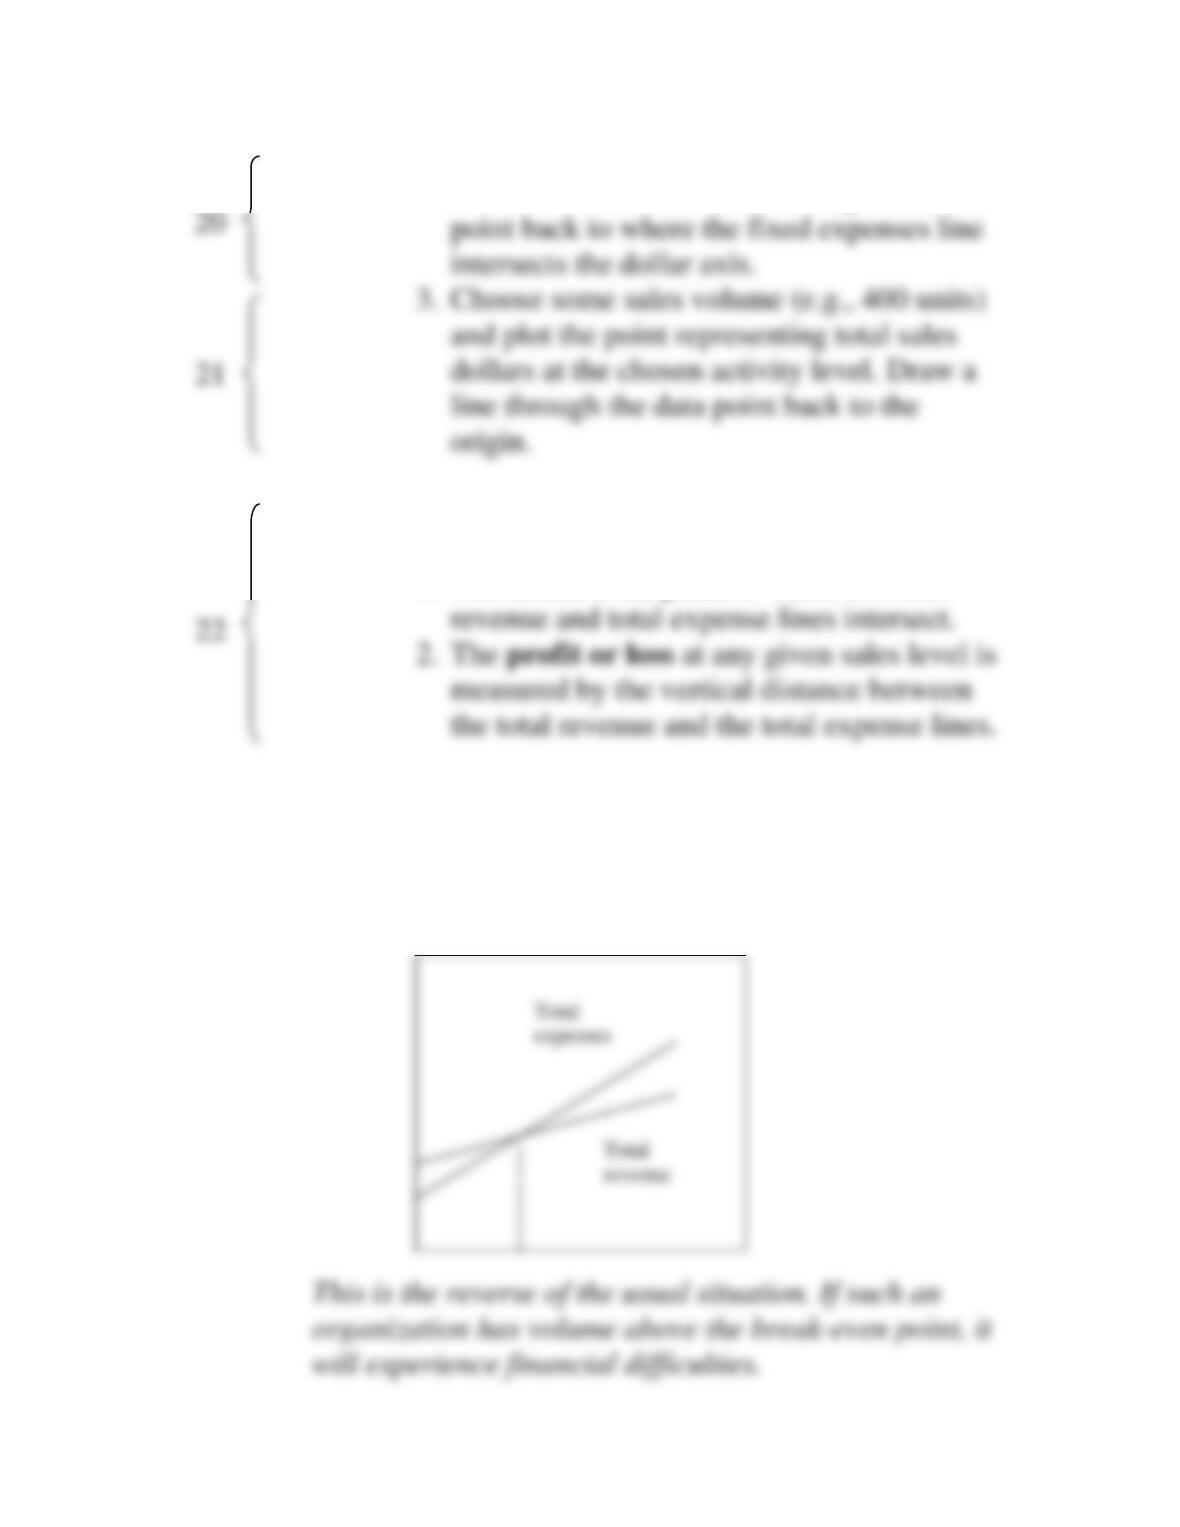
Helpful Hint: Ask students what the CVP graph would
look like for a public agency like a county hospital
receiving a fixed budget each year and collecting fees
less than its variable costs. It would look like this:
26
28
iv. An even simpler form of the CVP graph is called
the profit graph. The profit graph is based on the
equation shown on this slide.
D. Contribution margin ratio (CM ratio)
Learning Objective 3: Use the contribution margin
ratio (CM ratio) to compute changes in contribution
margin and net operating income resulting from
changes in sales volume.
i. The CM ratio is calculated by dividing the total
contribution margin by total sales.
ii. The CM ratio can also be calculated by dividing the
contribution margin per unit by the selling price
per unit.
27
25
24
Quick Check – contribution margin ratio
iii. The relation between profit and the CM ratio can
also be expressed in terms of the equation shown
on this slide.
1. For example, we can use this equation to
Learning Objective 4: Show the effects on net operating
income of changes in variable costs, fixed costs, selling
price, and volume.
Helpful Hint: The five examples that are forthcoming
i. The variable expense ratio
1. Before proceeding with five examples that
29–30
32
38
40
ii. Change in fixed cost and sales volume
1. What is the profit impact if RBC can
increase unit sales from 500 to 540 by
increasing the monthly advertising budget
by $10,000?
1. What is the profit impact if RBC can use
higher quality raw materials, thus increasing
iv. Change in fixed cost, sales price, and sales
volume.
1. What is the profit impact if RBC: (1) cuts its
selling price $20 per unit, (2) increases its
37
39
34
42
v. Change in variable cost, fixed cost, and sales
volume.
1. What is the profit impact if RBC: (1) pays a
$15 sales commission per bike sold instead
vi. Change in regular sales price.
1. If RBC has an opportunity to sell 150 bikes
to a wholesaler without disturbing sales to
II. Target profit analysis
Learning Objective 5: Determine the level of sales
needed to achieve a desired target profit.
A. We can compute the number of units that must be sold
41
45
46
47
1. Suppose RBC wants to know how many
bikes must be sold to earn a target profit of
ii. The formula method is summarized on this slide.
It can also be used to compute the quantity of units
that must be sold to attain a target profit. For
example:
1. Suppose RBC wants to know how many
bikes must be sold to earn a target profit of
B. We can also compute the target profit in terms sales
dollars using either the equation method or the
formula method.
i. The equation method is summarized on this slide.
Our goal is to solve for the unknown “Sales,”
which represents the dollar amount of sales that
must be sold to attain the target profit. For
example:
49
51
62
ii. The formula method is summarized on this slide.
It can also be used to compute the dollar sales
needed to attain a target profit. For example:
1. Suppose RBC wants to compute the dollar
Quick Check – target profit calculations
C. Break-even analysis
Learning Objective 6: Determine the break-even
point.
1. Suppose RBC wants to know how many
bikes must be sold to break-even (i.e. earn a
target profit of $0). The equation shown on
38
54–57
60
58
73
74
2. Suppose RBC wants to compute the sales
dollars required to break-even (i.e. earn a
target profit of $0). The equation shown here
can be used to answer this question.
Quick Check – break-even calculations
D. The margin of safety
Learning Objective 7: Compute the margin of safety
and explain its significance.
$250,000, given that we have already
determined the break-even sales to be
$200,000, the margin of safety is $50,000.
66–69
70
72
63
Quick Check – margin of safety calculations
III. CVP considerations in choosing a cost structure
A. Cost structure and profit stability
1. An advantage of a high fixed cost structure
is that income will be higher in good years
compared to companies with a lower
proportion of fixed costs.
Learning Objective 8: Compute the degree of operating
leverage at a particular level of sales and explain how
75–76
78
B. Operating leverage
i. Operating leverage is a measure of how sensitive
net operating income is to percentage changes in
sales.
ii. The degree of operating leverage is a measure, at
iii. To illustrate, let’s revisit the contribution income
statement for RBC:
1. RBC’s degree of operating leverage is 5
($100,000/$20,000).
Quick Check – operating leverage calculations
Helpful Hint: Emphasize that the degree of operating
leverage is not a constant like unit variable cost or unit
contribution margin that a manager can apply with
81
84–88
91
IV. Structuring sales commissions
A. Companies generally compensate salespeople by
paying them either a commission based on sales or a
salary plus a sales commission. Commissions based on
sales dollars can lead to lower profits in a company.
Consider the following illustration:
contribution margin per unit of $18.
ii. Salespeople compensated based on sales
commission will push hard to sell the Turbo even–
though the XR7 earns a higher contribution margin
per unit.
V. The concept of sales mix
Learning Objective 9: Compute the break-even point
89
90
A. The term sales mix refers to the relative proportions in
which a company’s products are sold. Since different
products have different selling prices, variable costs,
and contribution margins, when a company sells more
than one product, break-even analysis becomes more
complex as the following example illustrates:
i. Assume the RBC sells bikes and carts. The bikes
comprise 45% of the company’s total sales revenue
and the carts comprise the remaining 55%. The
contribution margin ratio for both products
combined is 48.2%.
94
93
VI. Assumptions of CVP analysis
A. Four key assumptions underlie CVP analysis:
i. Selling price is constant.
ii. Costs are linear and can be accurately divided into
iii. In multiproduct companies, the sales mix is
constant.
iv. In manufacturing companies, inventories do not
Helpful Hint: Point out that nothing is sacred about
these assumptions. When violations of these