Unlock document.
This document is partially blurred.
Unlock all pages and 1 million more documents.
Get Access
CHAPTER 5 • INVENTORIES AND COST OF GOODS SOLD 5-21
EXERCISE 5-27 (Concluded)
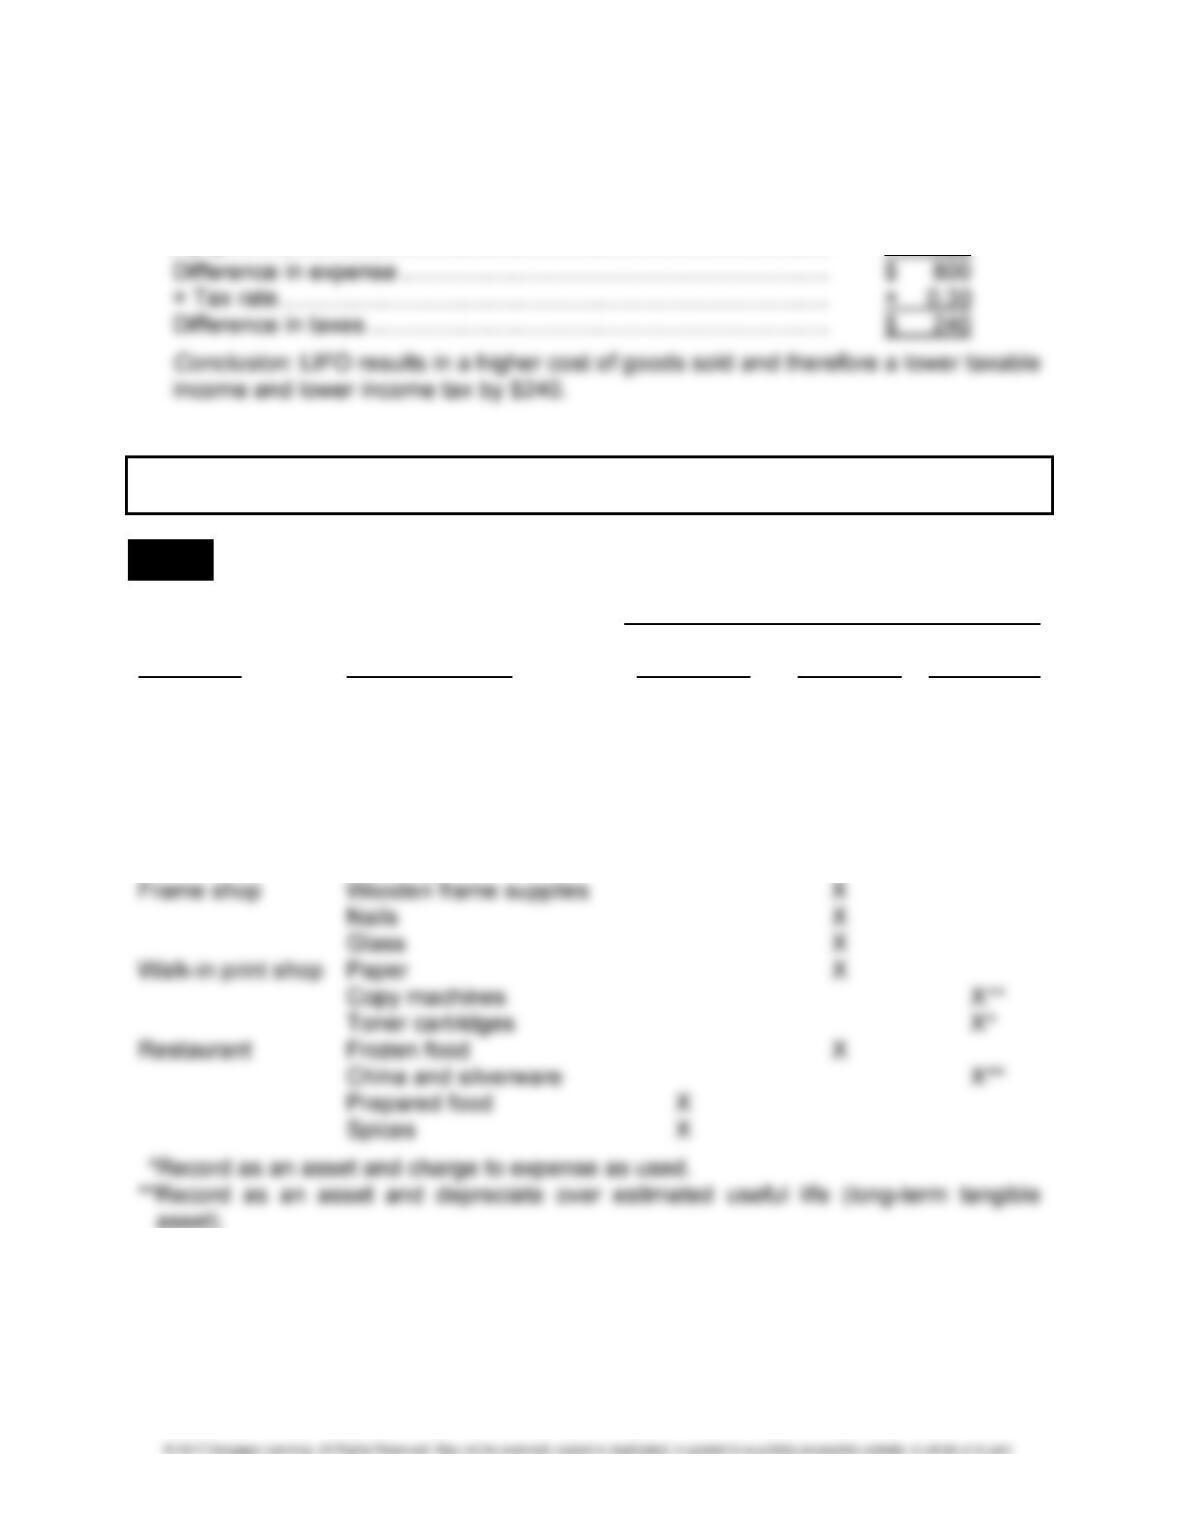
3. Cost of goods sold:
LIFO ............................................................................................. $12,200
FIFO ............................................................................................. 11,400
PROBLEMS
LO 1 PROBLEM 5-1 INVENTORY COSTS IN VARIOUS BUSINESSES
Accounting Treatment
Expense of Inventory Other
Business Types of Costs the Period Cost Treatment
Retail shoe store Shoes for sale X
Shoe boxes X
Advertising signs X
Grocery store Canned goods on the shelves X
Produce X
Cleaning supplies X*
Cash registers X**
5-22 FINANCIAL ACCOUNTING SOLUTIONS MANUAL
LO 4 PROBLEM 5-2 MAKING BUSINESS DECISIONS: ANALYZING WAL-MART’S GROSS
PROFIT RATIO
Part A. Ratio Analysis Model
1. Formulate the Question:
How many cents on the dollar does Wal-Mart have available to cover expenses
other than cost of goods sold and to earn a profit?
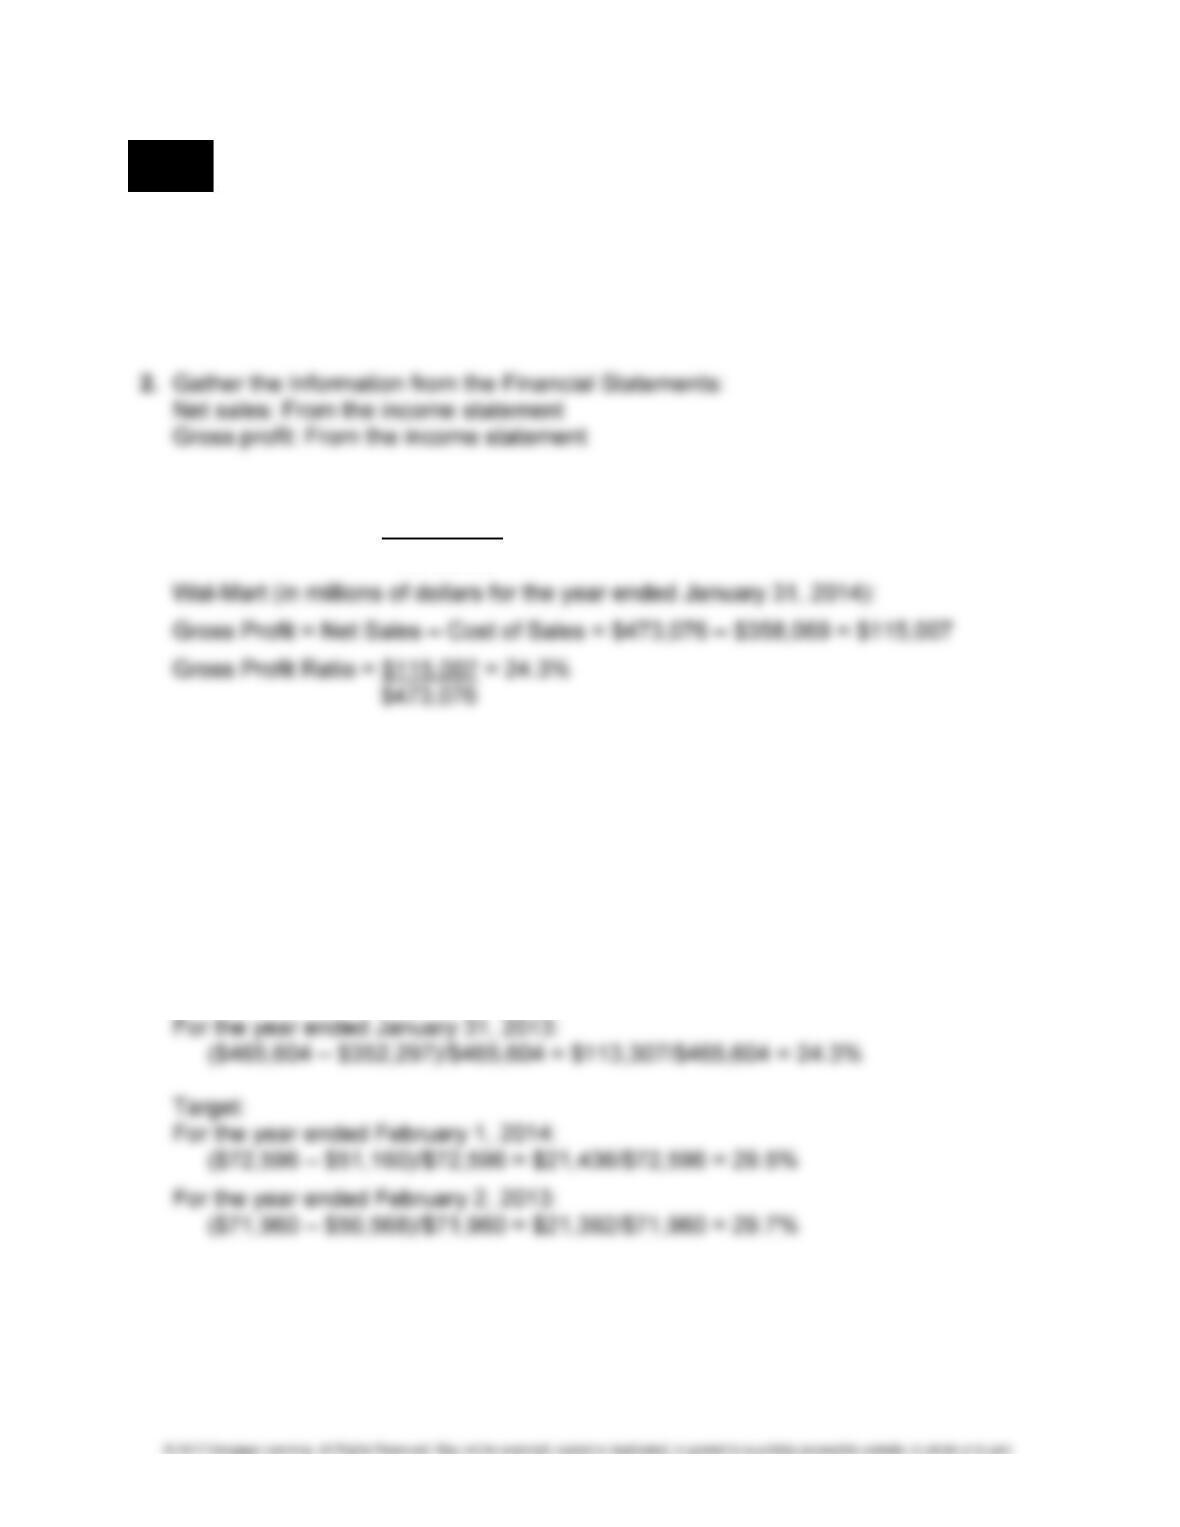
3. Calculate the Ratio:
Gross Profit Ratio = Gross Profit
Net Sales
4. Compare the Ratio with Other Ratios:
Gross Profit Ratio
Wal-Mart Target
Year Ended Year Ended Year Ended Year Ended
January 31, 2014 January 31, 2013 February 1, 2014 February 2, 2013
24.3% 24.3% 29.5% 29.7%
Calculations:
Wal-Mart:
CHAPTER 5 • INVENTORIES AND COST OF GOODS SOLD 5-23
PROBLEM 5-2 (Continued)
5. Interpret the Ratios:
For every dollar of sales, Wal-Mart has 24.3 cents available after deducting the cost
Part B. Business Decision Model
1. Formulate the Question:
After considering all relevant information, should I invest in the common stock of
Wal-mart?
2. Gather Information from the Financial Statements and Other Sources:
The information will come from a variety of sources, not limited to but including:
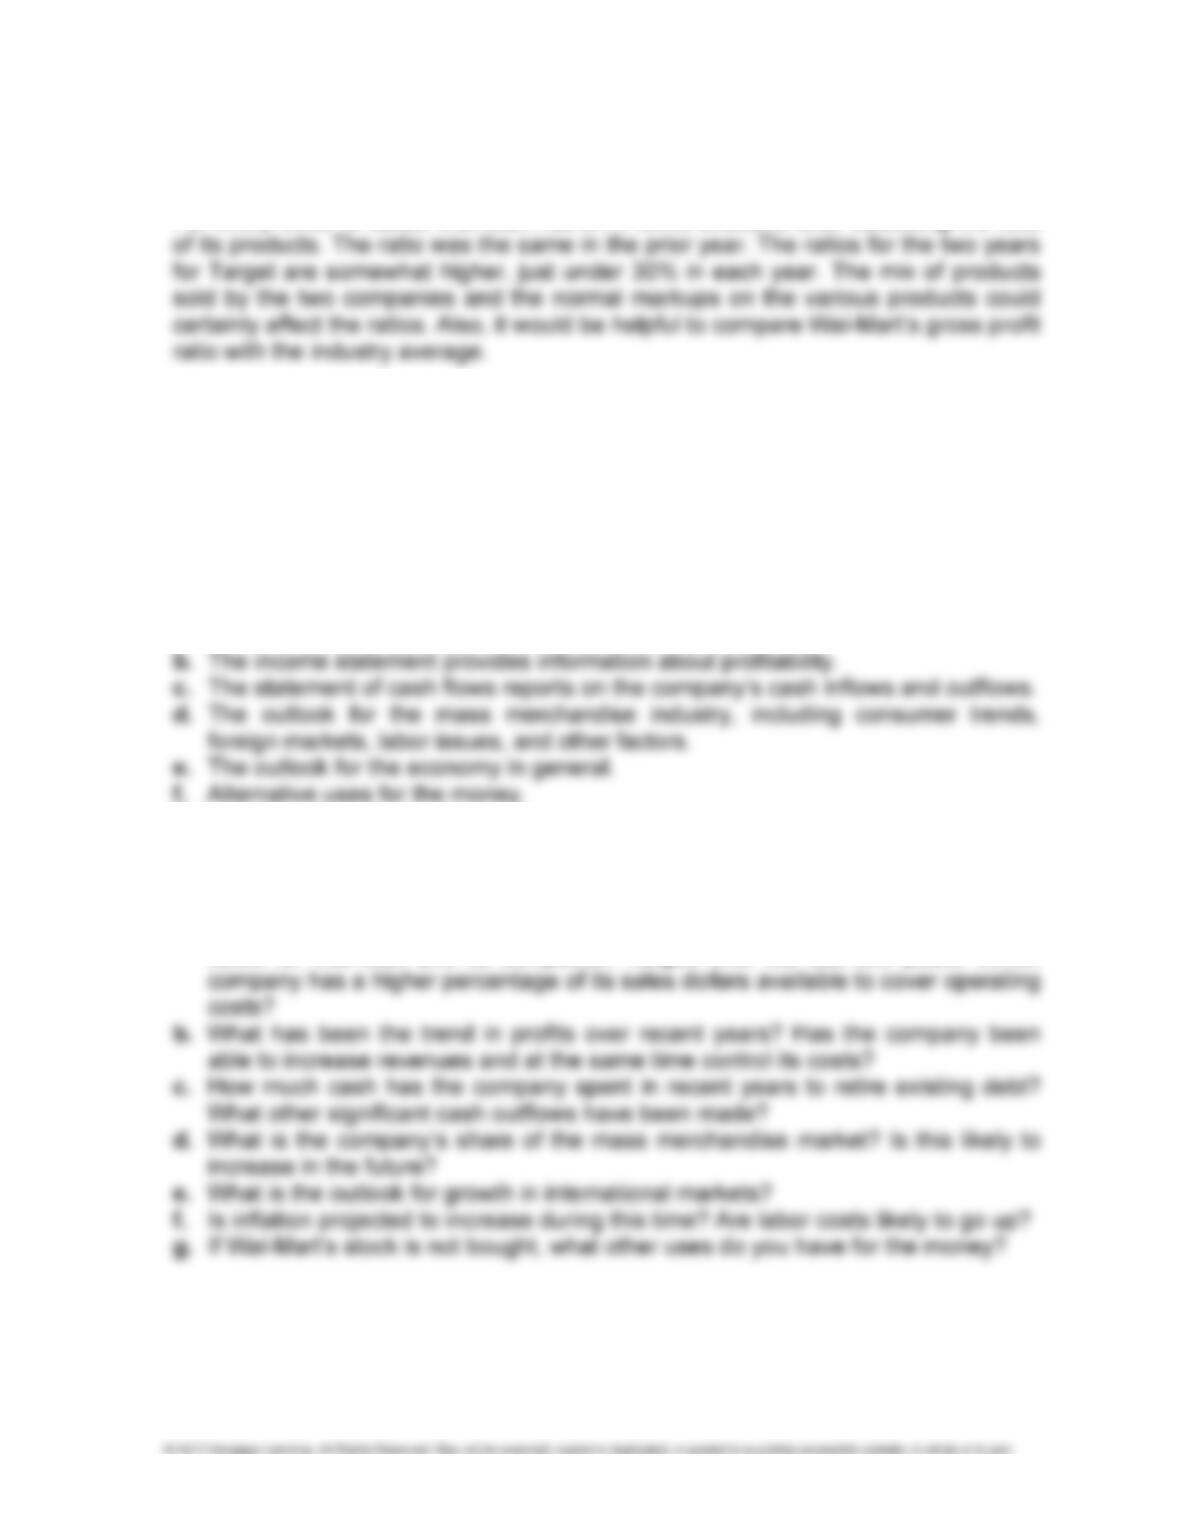
a. The balance sheet provides information about liquidity.
3. Analyze the Information Gathered:
The information gathered in (2) above must be analyzed. Among the relevant ques-
tions that must be answered are the following:
a. Refer to part (5) of the Ratio Analysis Model for a comparison of the gross profit
ratios for Wal-Mart and its competitor, Target, over the last two years. Which
PROBLEM 5-2 (Concluded)
4. Make the Decision:
5. Monitor Your Decision:
If you decide to buy the stock, you will need to monitor your investment periodically.
During the time you hold the stock, you will want to assess the company’s continuing
profitability as well as other factors you considered before making the investment.
LO 7 PROBLEM 5-3 EVALUATION OF INVENTORY COSTING METHODS
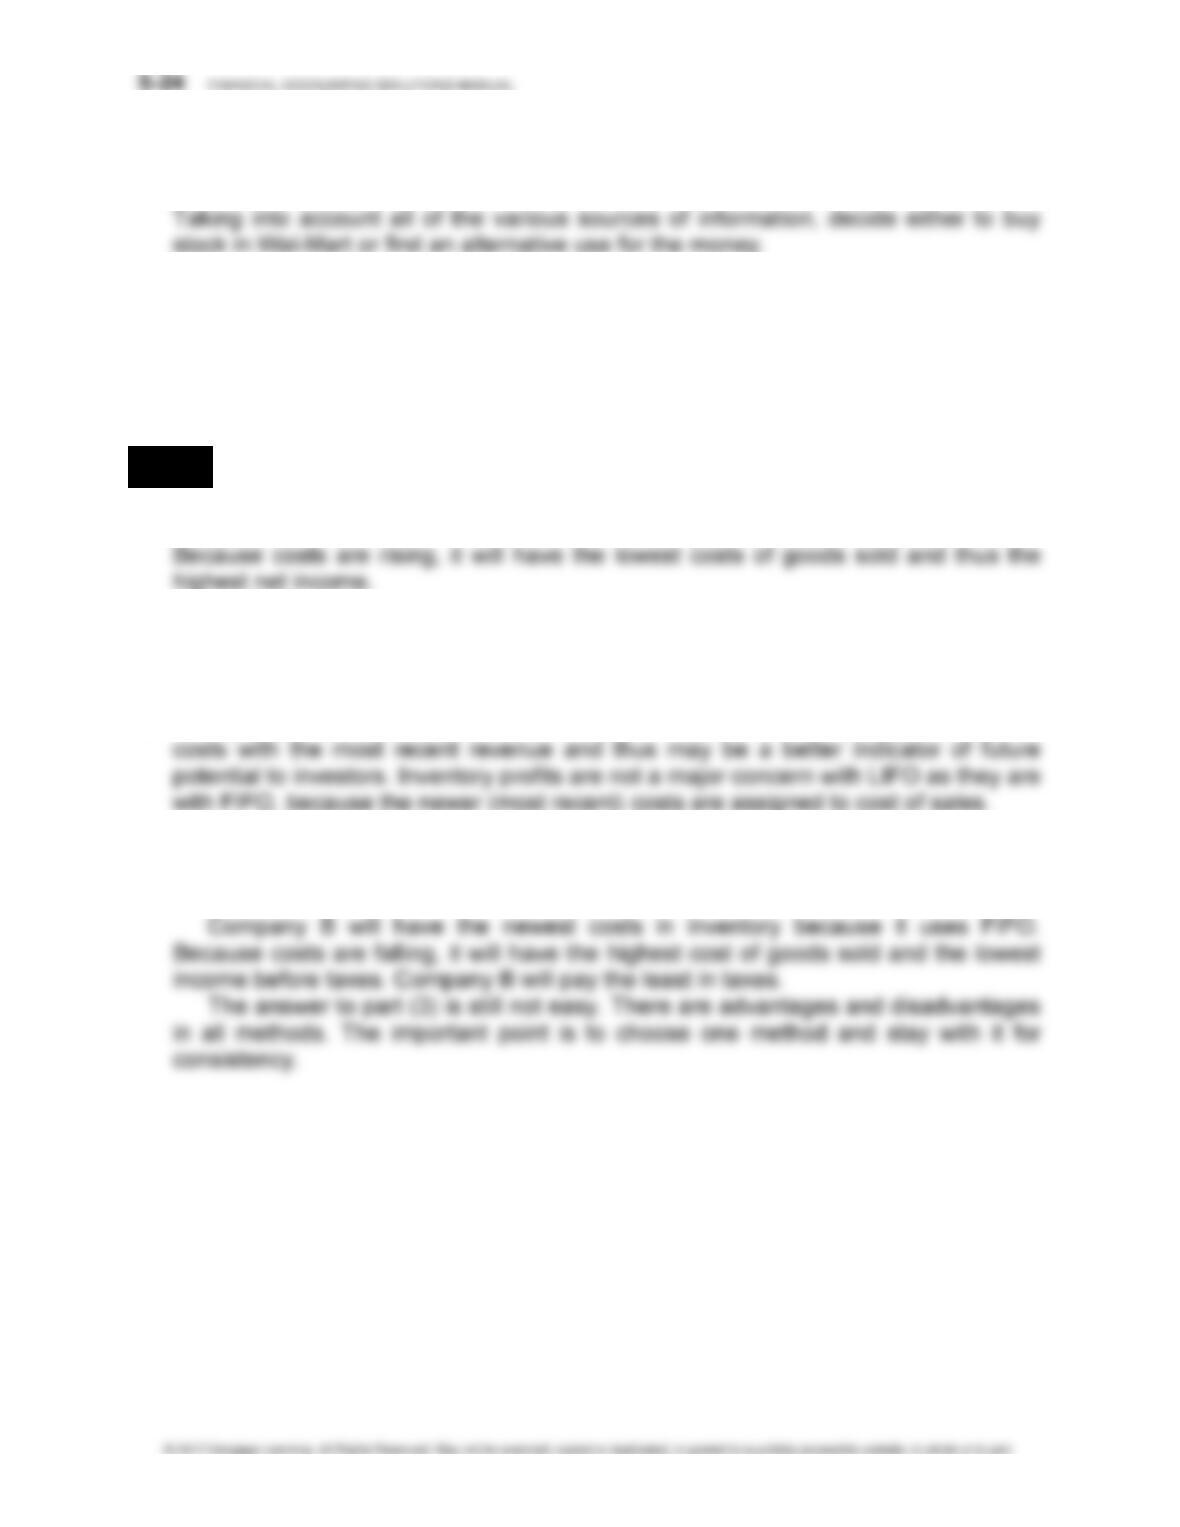
1. Company B will have the newest costs in inventory because it uses first-in, first-out.
2. Company C will have the oldest costs in inventory because it uses last-in, first-out.
Because costs are rising, it will have the highest cost of goods sold and thus the
lowest income before taxes. Company C will pay the least in taxes.
3. This question does not lend itself to an easy answer. LIFO matches the most recent
4. Company C would have the oldest costs in inventory because it uses LIFO. Because
costs are falling, it will have the lowest cost of goods sold and the highest net
income.
CHAPTER 5 • INVENTORIES AND COST OF GOODS SOLD 5-25
LO 8 PROBLEM 5-4 INVENTORY ERROR
1. Revised income statements: 2016 2015
Revenues .......................................................... $20,000 $15,000
Cost of goods sold ............................................. 13,600** 9,400*
Gross profit ................................................... $ 6,400 $ 5,600
Operating expenses .......................................... 3,000 2,000
Net income ................................................... $ 3,400 $ 3,600
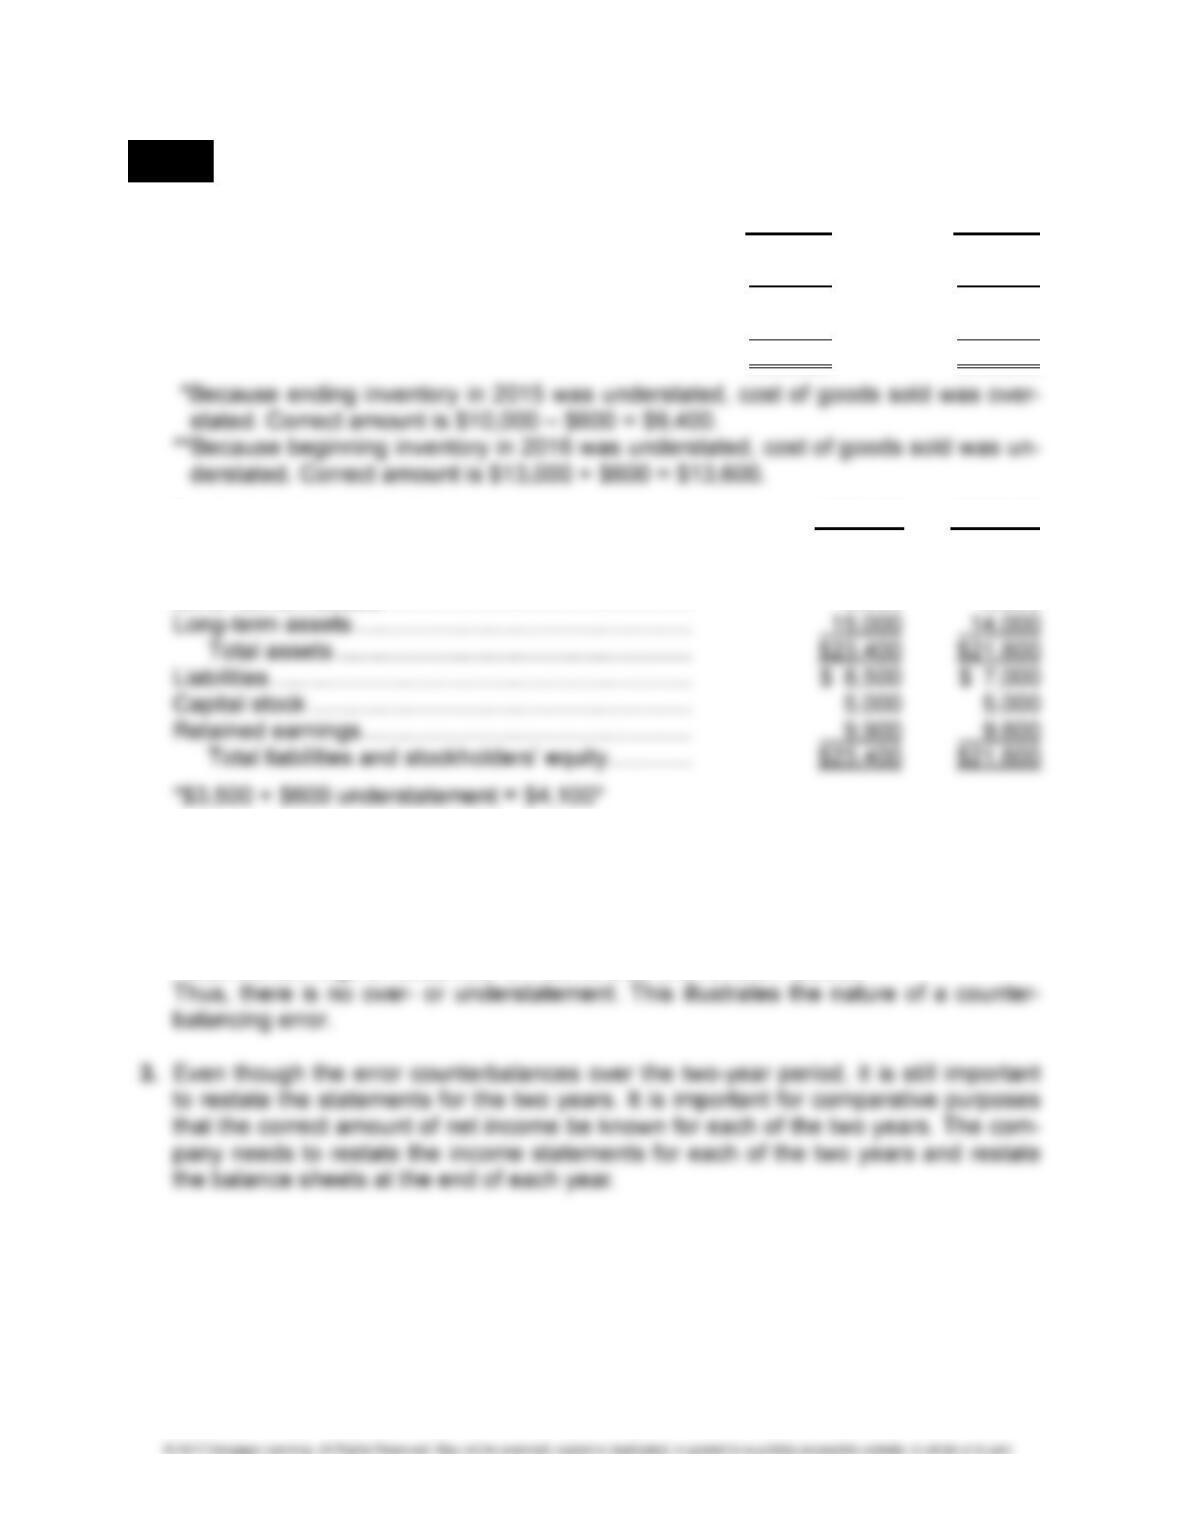
Revised balance sheets: 12/31/16 12/31/15
Cash ....................................................................... $ 1,700 $ 1,500
Inventory ................................................................. 4,200 4,100*
Other current assets ............................................... 2,500 2,000
2. Net income for two years, before revision: $3,000 + $4,000 = $7,000
Net income for two years, after revision: $3,600 + $3,400 = $7,000
Thus, there is no net over- or understatement.
Retained earnings at December 31, 2016, before the revision: $9,900
Retained earnings at December 31, 2016, after the revision: $9,900
5-26 FINANCIAL ACCOUNTING SOLUTIONS MANUAL
LO 10 PROBLEM 5-5 MAKING BUSINESS DECISIONS: ANALYZING APPLE’S INVENTORY
TURNOVER RATIO
Part A. Ratio Analysis Model
1. Formulate the Question:
How many times a year does Apple Inc. turn over its inventory?
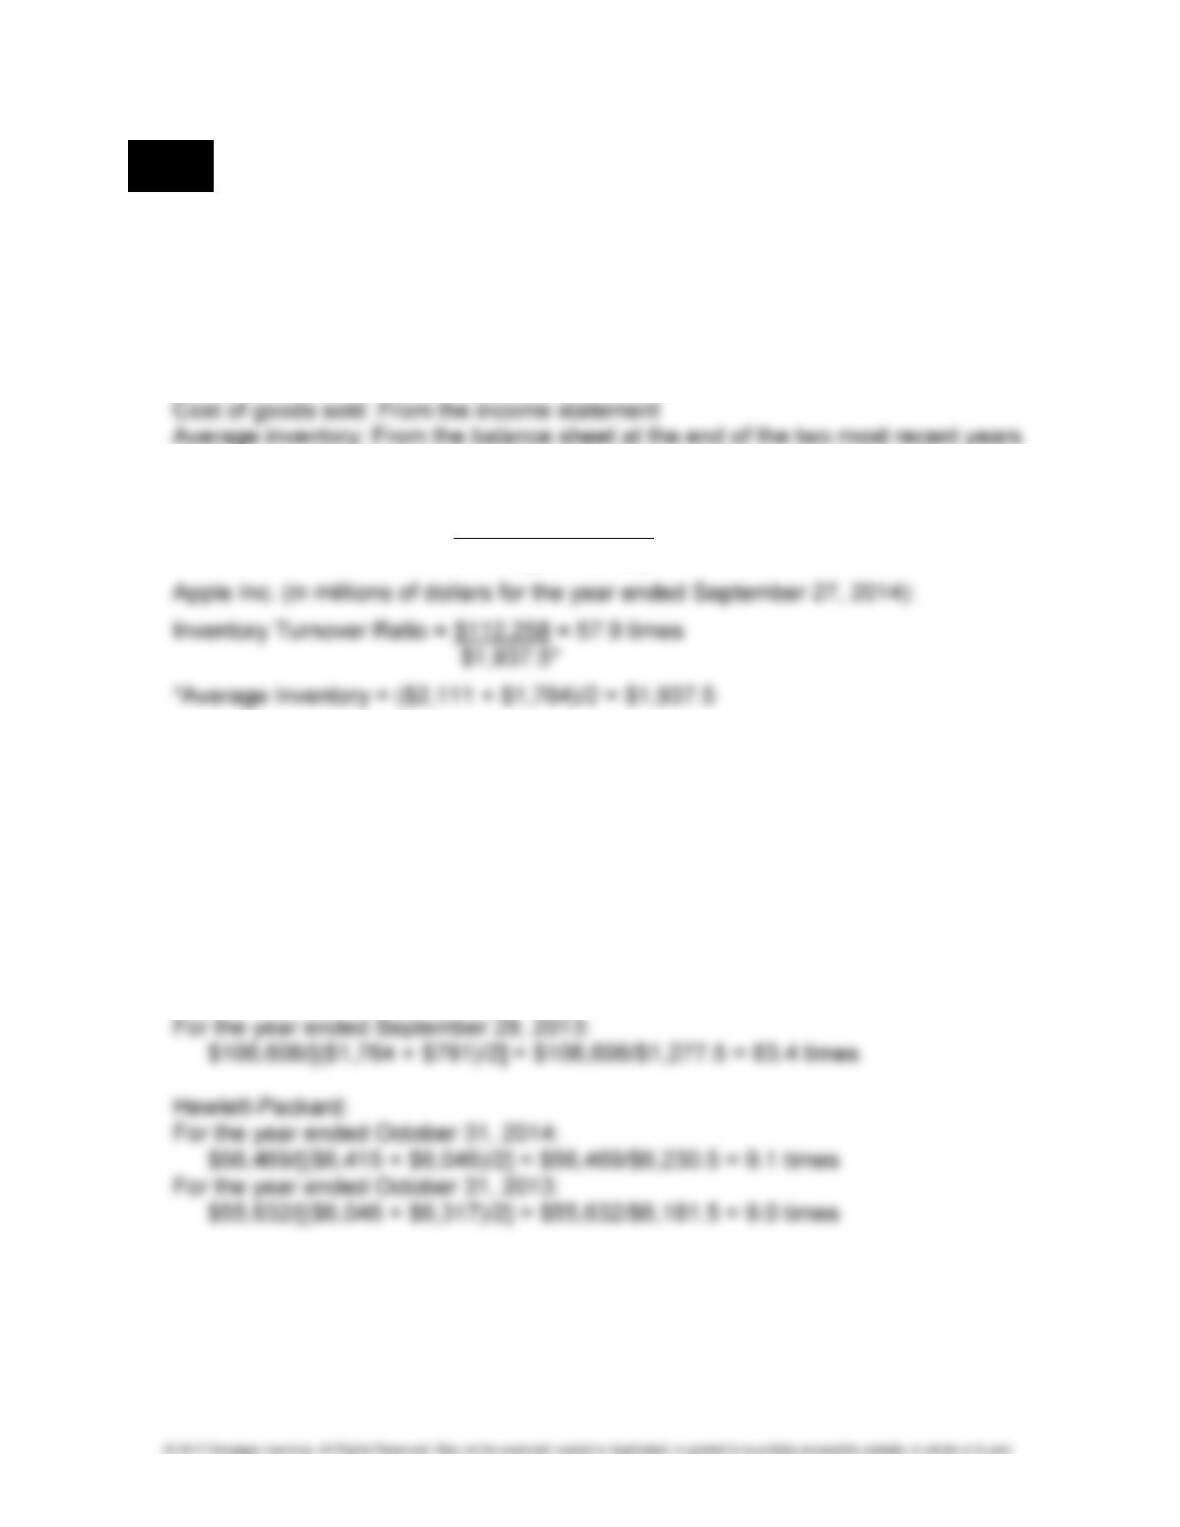
2. Gather the Information from the Financial Statements:
3. Calculate the Ratio:
Inventory Turnover Ratio = Cost of Goods Sold
Average Inventory
4. Compare the Ratio with Other Ratios:
Inventory Turnover Ratio
Apple Inc. Hewlett-Packard
Year Ended Year Ended Year Ended Year Ended
September 27, 2014 September 28, 2013 October 31, 2014 October 31, 2013
57.9 times 83.4 times 9.1 times 9.0 times
Calculations:
Apple Inc.:
CHAPTER 5 • INVENTORIES AND COST OF GOODS SOLD 5-27
PROBLEM 5-5 (Continued)
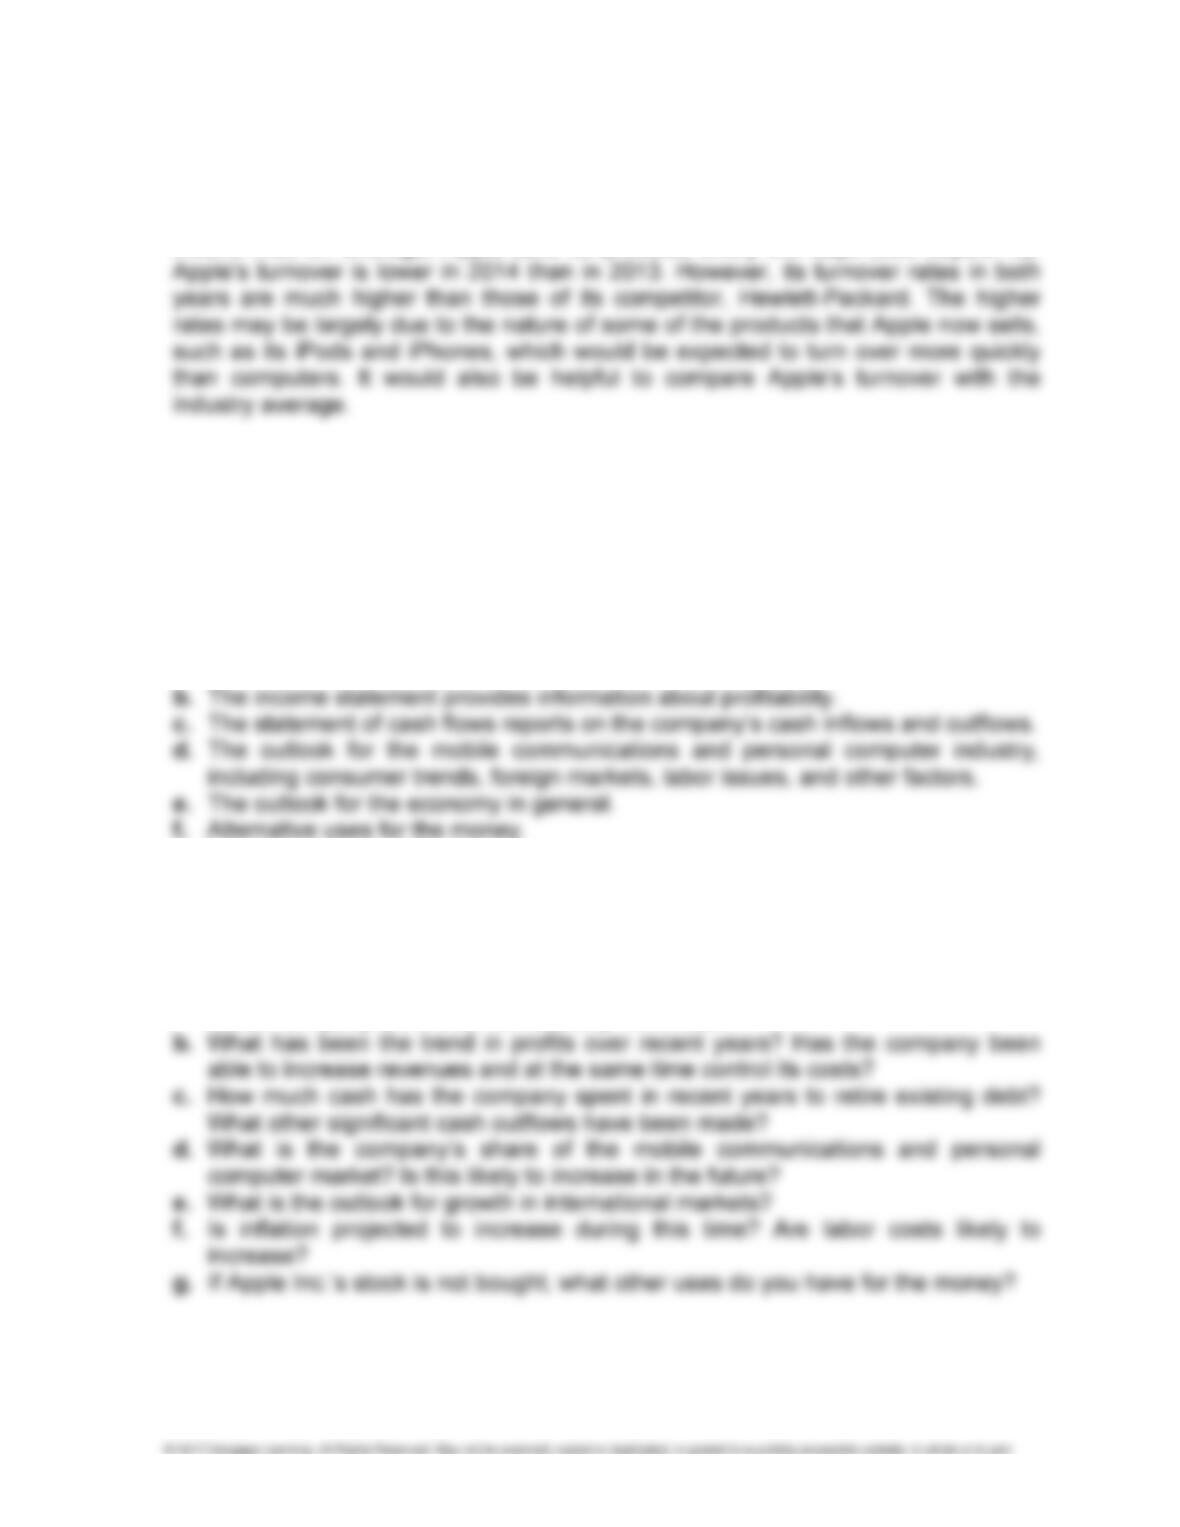
5. Interpret the Ratios:
Apple Inc. turned over its inventory 57.9 times during the 2014 fiscal year. This
means that, on average, Apple sells its products every 6.2 days (360 days/57.9).
Part B. Business Decision Model
1. Formulate the Question:
After considering all relevant information, should I invest in the common stock of
Apple Inc.?
2. Gather Information from the Financial Statements and Other Sources:
The information will come from a variety of sources, not limited to but including:
a. The balance sheet provides information about liquidity.
3. Analyze the Information Gathered:
The information gathered in (2) above must be analyzed. Among the relevant ques-
tions that must be answered are the following:
a. Refer to part (5) of the Ratio Analysis Model for a comparison of the turnover
ratios for Apple Inc. and its competitor, Hewlett-Packard, over the last two years.
Which company turns over its inventory more often?
5-28 FINANCIAL ACCOUNTING SOLUTIONS MANUAL
PROBLEM 5-5 (Concluded)
4. Make the Decision:
5. Monitor Your Decision:
LO 11 PROBLEM 5-6 EFFECTS OF CHANGES IN INVENTORY AND ACCOUNTS PAYABLE
BALANCES ON STATEMENT OF CASH FLOWS
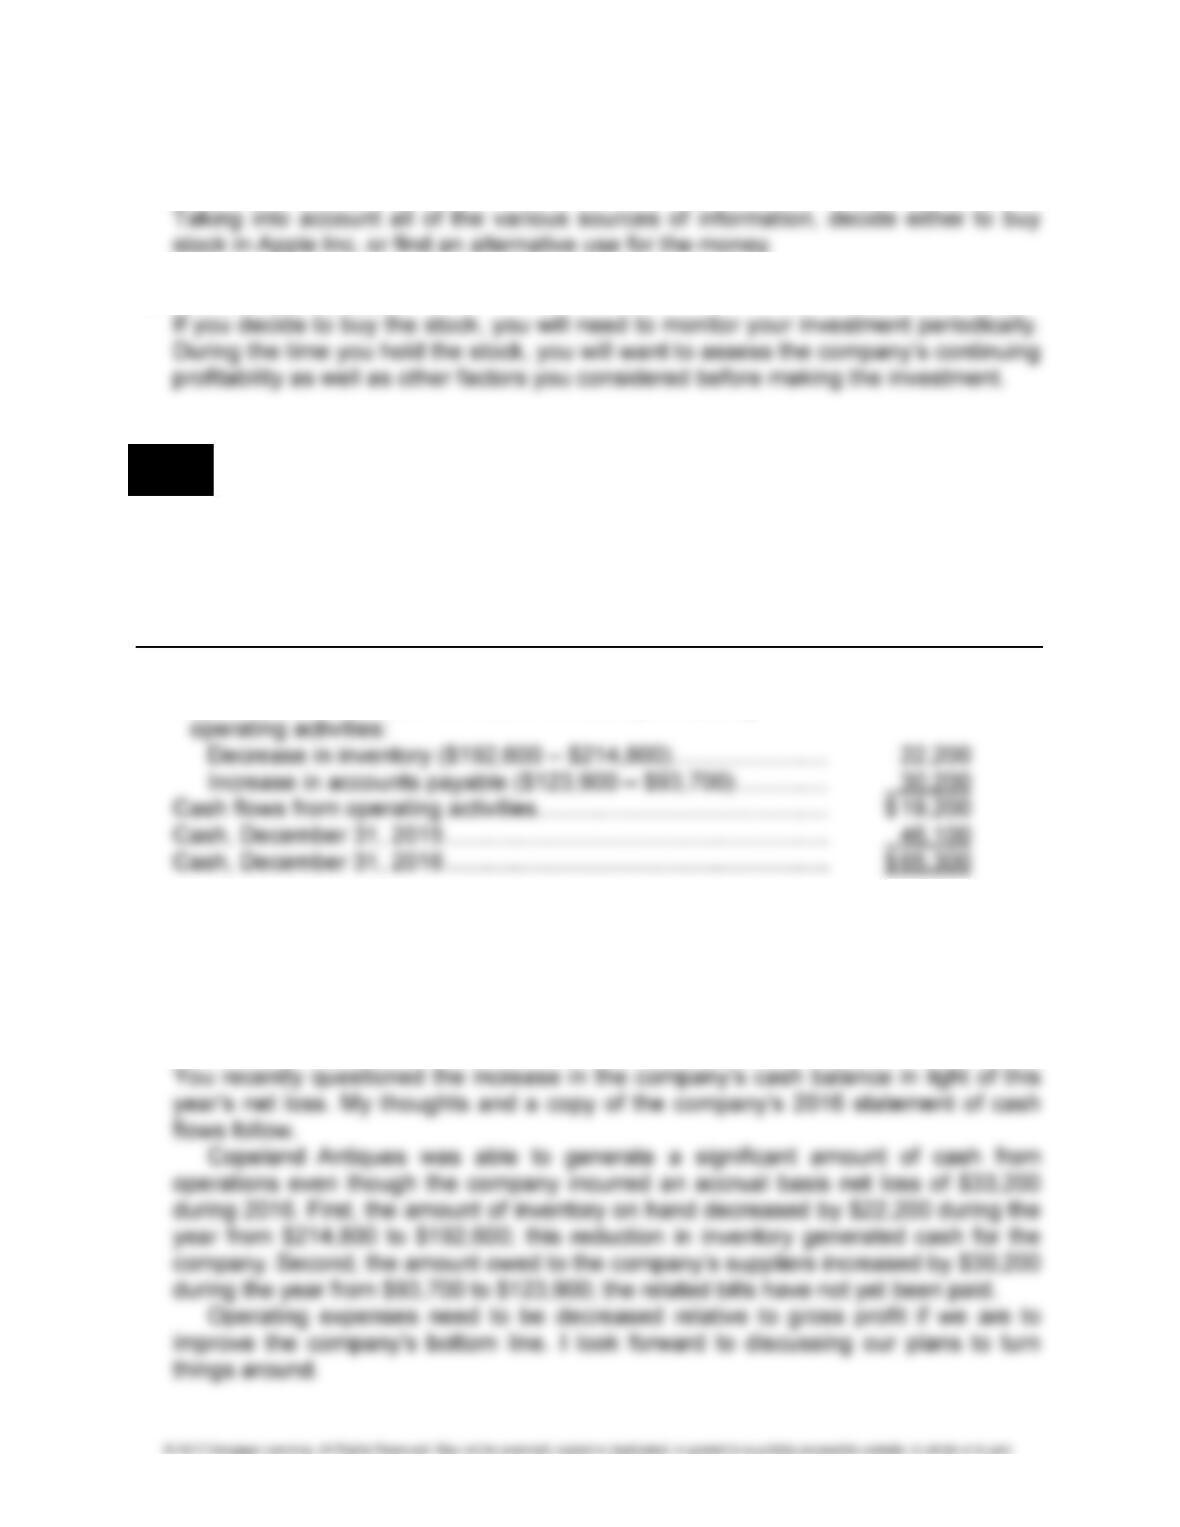
1. Statement of cash flows:
COPELAND ANTIQUES
STATEMENT OF CASH FLOWS
FOR THE YEAR ENDED DECEMBER 31, 2016
Net loss ........................................................................................ $(33,200)
Adjustments to reconcile net loss to net cash provided by
2. Memo to the president:
TO: President of Copeland Antiques
FROM: Student’s name
DATE: January 20, 2017
SUBJECT: Cash Flows
CHAPTER 5 • INVENTORIES AND COST OF GOODS SOLD 5-29
MULTI-CONCEPT PROBLEMS
LO 2,3,11 PROBLEM 5-7 PURCHASES AND SALES OF MERCHANDISE, CASH FLOWS
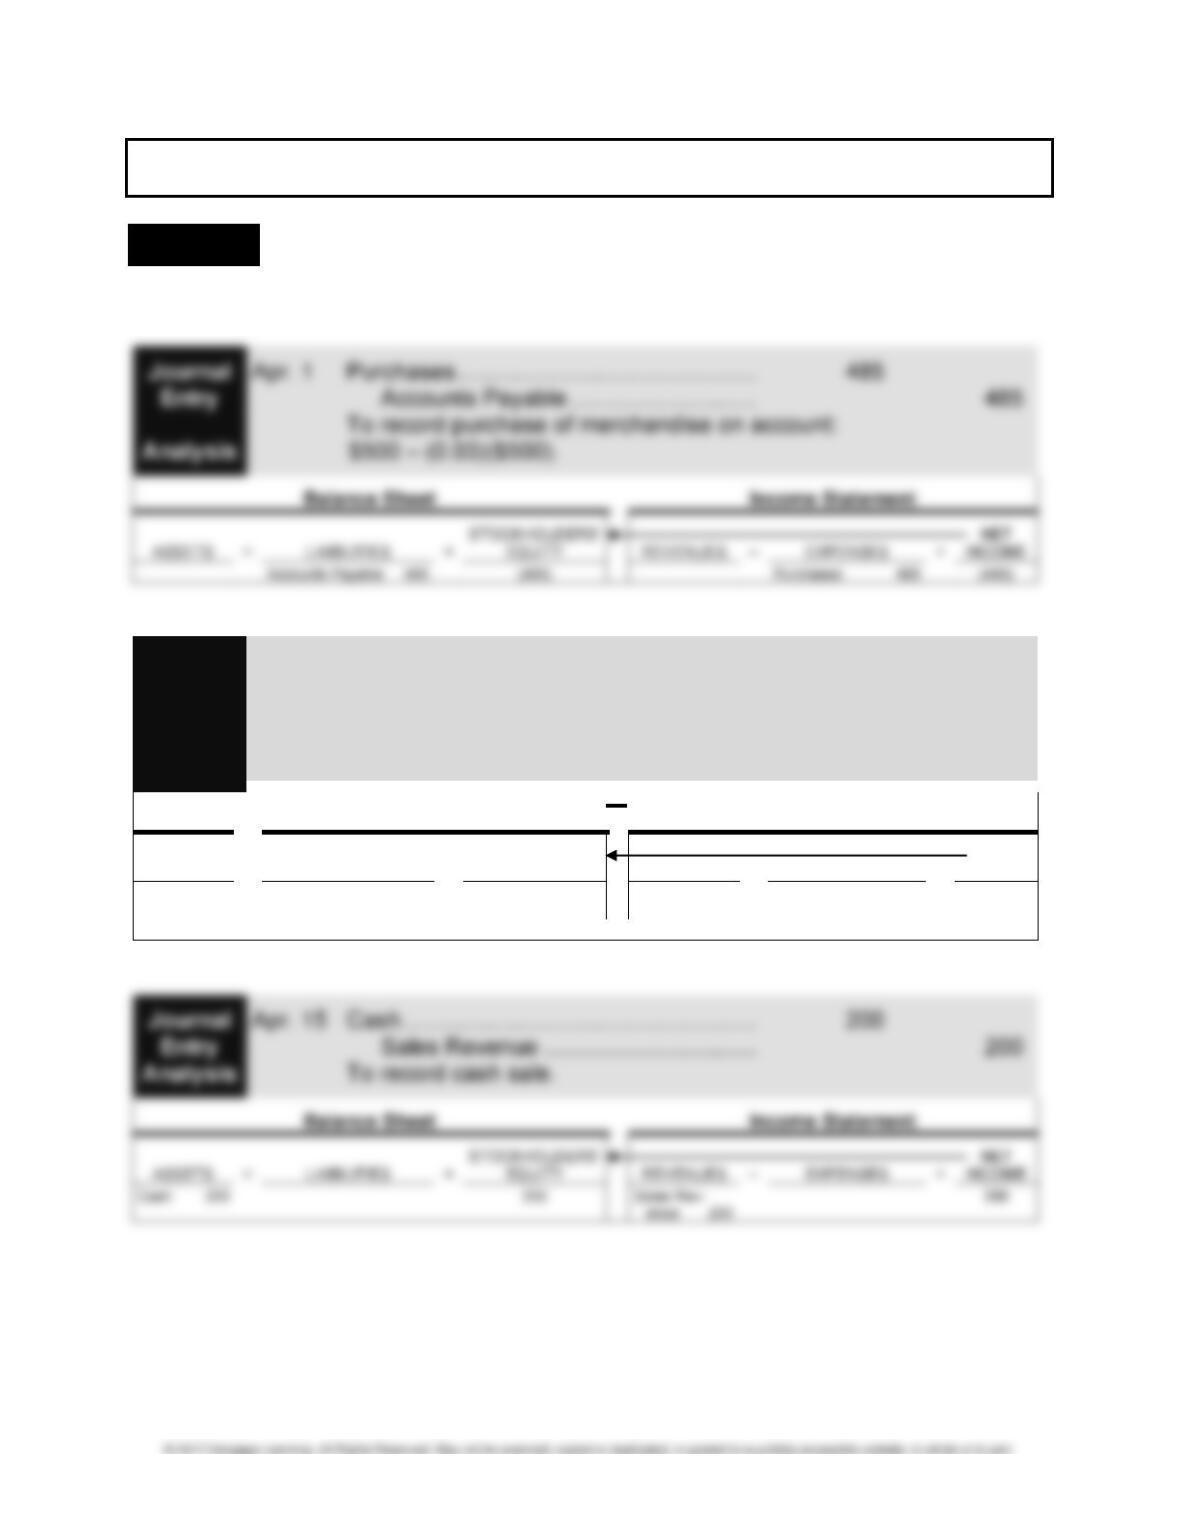
1. Journal entries:
Journal Apr. 10 Accounts Payable .................................. 485
Entry Cash ................................................. 485
Analysis To record payment on account.
Balance Sheet Income Statement
=
ASSETS LIABILITIES +
STOCKHOLDERS’
EQUITY REVENUES – EXPENSES =
NET
INCOME
Cash (485)
Accounts Payable (485)
PROBLEM 5-7 (Continued)
Journal Apr. 18 Purchases .............................................. 873
Entry Accounts Payable ............................. 873
Analysis To record purchase of merchandise on account.
$900 – (0.03)($900).
Balance Sheet Income Statement
ASSETS = LIABILITIES +
STOCKHOLDERS’
EQUITY REVENUES – EXPENSES =
NET
INCOME
Accounts Payable 873 (873) Purchases 873 (873)
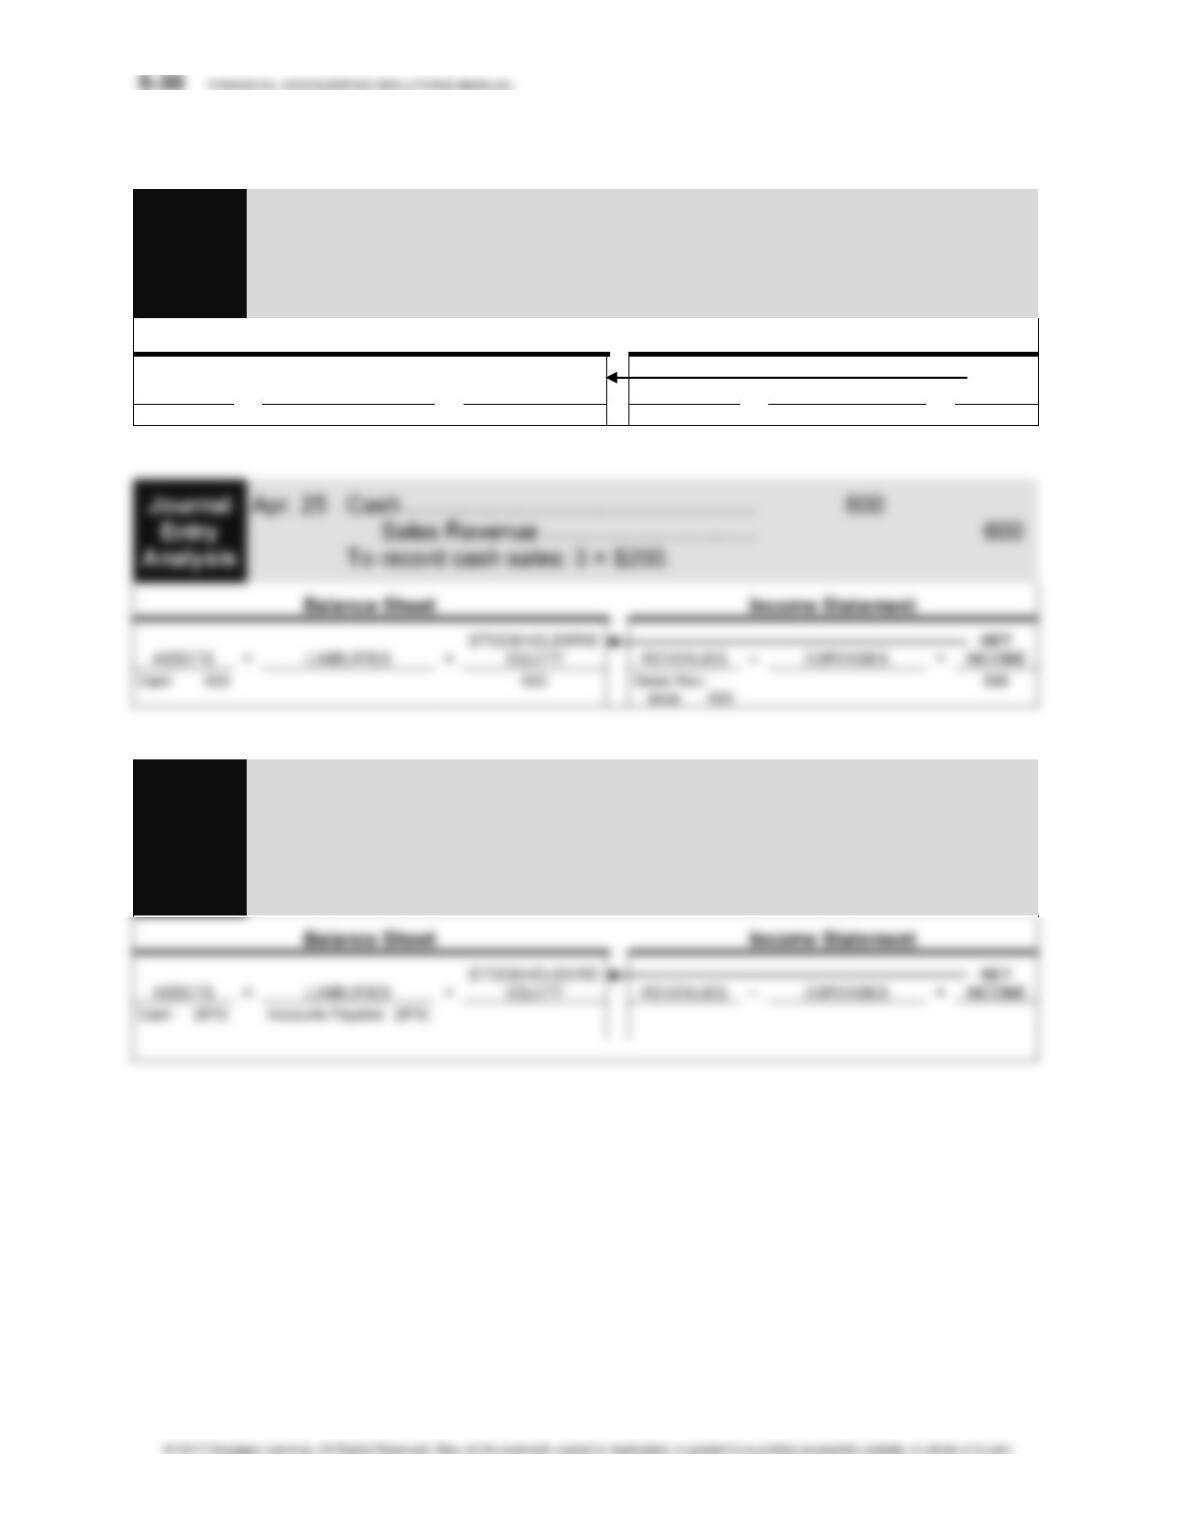
Journal Apr. 28 Accounts Payable .................................. 873
Entry Cash ................................................. 873
Analysis
To record payment on account.
CHAPTER 5 • INVENTORIES AND COST OF GOODS SOLD 5-31
PROBLEM 5-7 (Concluded)
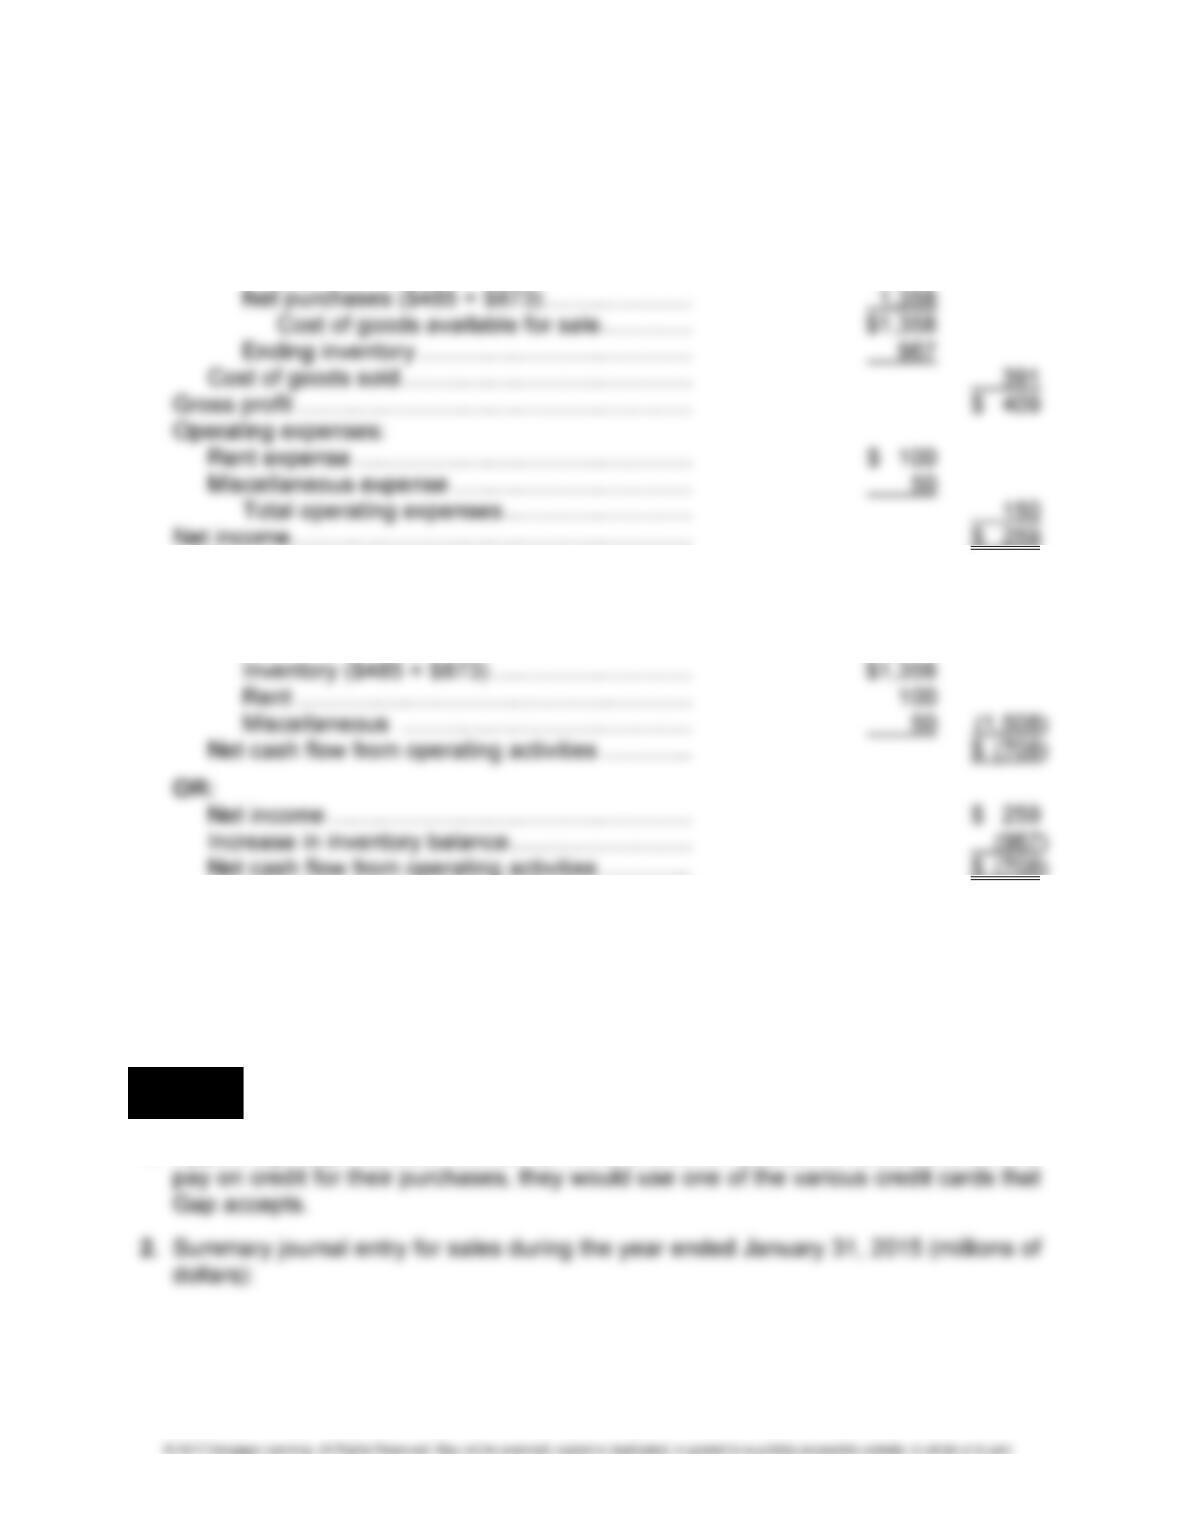
2. Net income for April:
Sales revenue ($200 + $600) ............................ $ 800
Cost of goods sold:
Beginning inventory ...................................... $ 0
3. Net cash flow from operating activities for April:
Cash collected from sales ($200 + $600) .......... $ 800
Cash paid for:
4. Net income is $259. Net cash flow from operating activities is a negative $708. The
difference of $967 is attributable to inventory that has not been sold. That is, the
company has paid for $1,358 of inventory (a cash outlay) but has only recognized
cost of goods sold expense of $391. The difference is $967.
LO 2,3,4 PROBLEM 5-8 GAP INC.’S SALES, COST OF GOODS SOLD, AND GROSS
PROFIT
1. Apparently, Gap Inc. does not sell its merchandise on account. If customers want to
5-32 FINANCIAL ACCOUNTING SOLUTIONS MANUAL
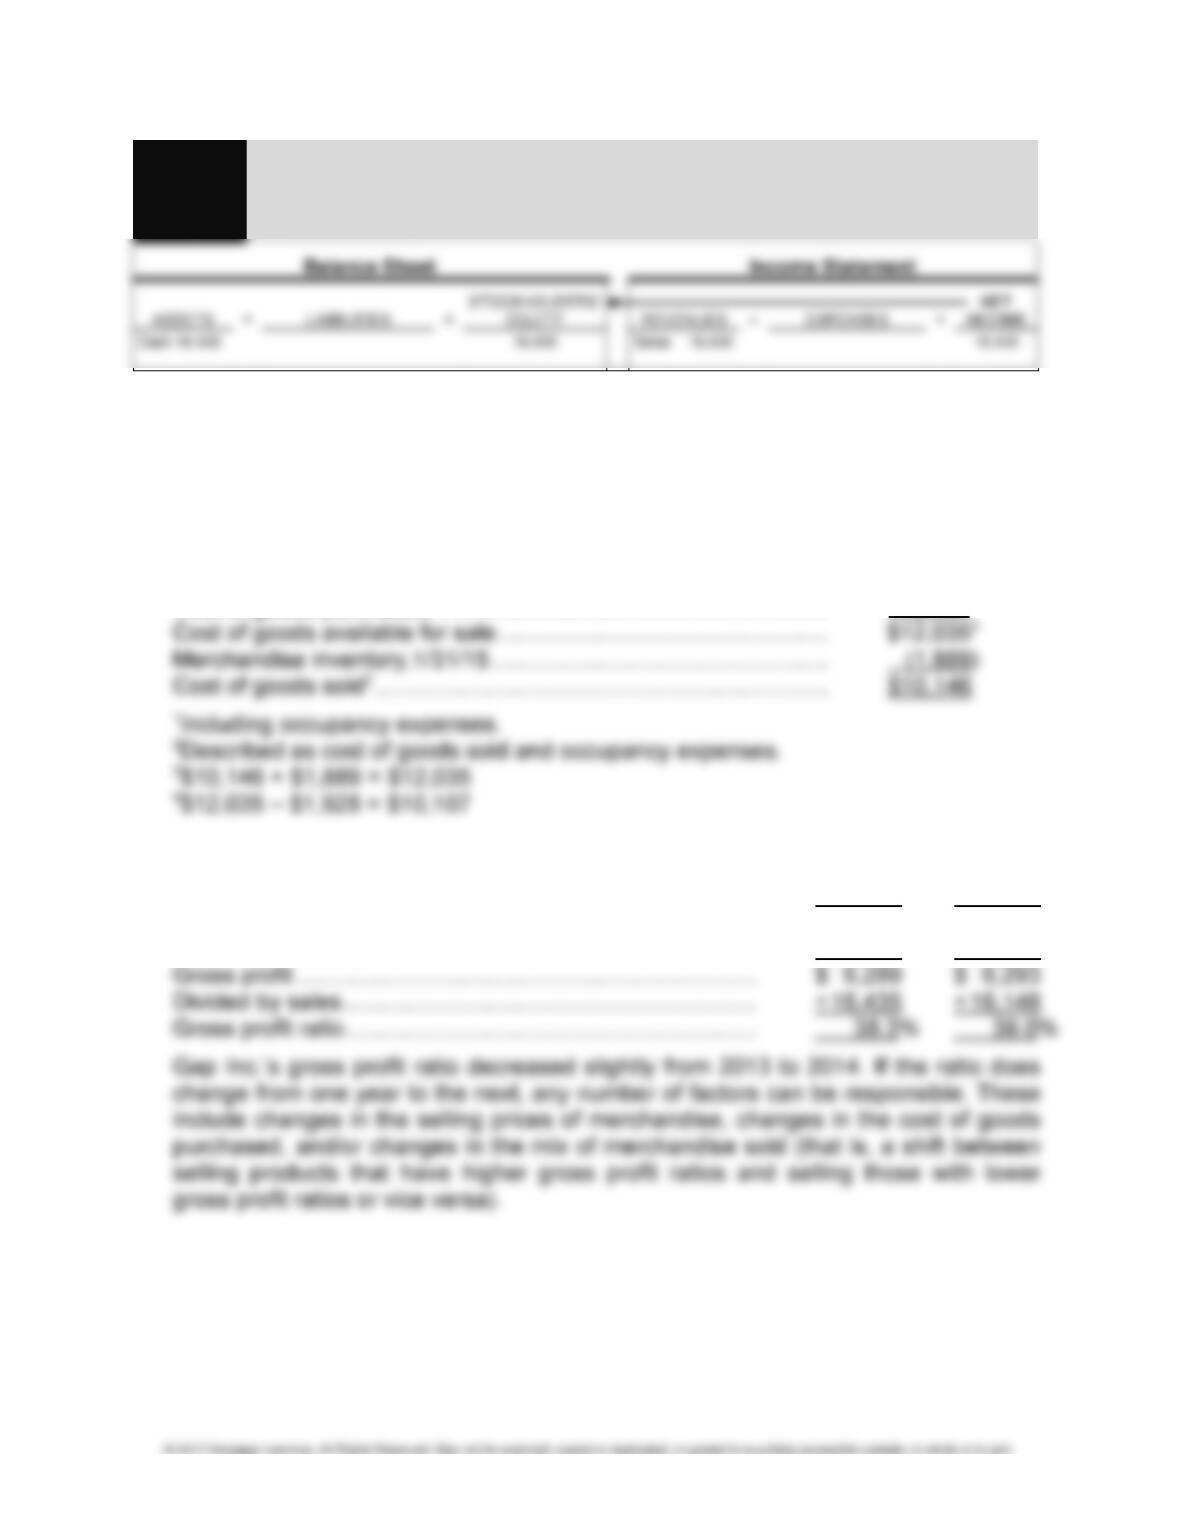
Journal Cash ................................................................... 16,435
Entry Sales ............................................................ 16,435
Analysis To record sales.
3. Gap Inc. would deduct sales returns and allowances from sales to arrive at the
amount of net sales reported on its income statement. Since Gap Inc. does not have
any accounts receivable on its balance sheet, it is unlikely that it offers sales
discounts to its customers.
4. Cost of Goods Sold section of 2014 income statement (millions of dollars):
Merchandise inventory, 2/1/14 ..................................................... $ 1,928
Cost of goods purchased1 ............................................................ 10,1074
5. Gross profit ratios:
(millions of dollars) 2014 2013
Sales ................................................................................. $ 16,435 16,148
Cost of goods sold ............................................................ 10,146 9,855
CHAPTER 5 • INVENTORIES AND COST OF GOODS SOLD 5-33
LO 2,3 PROBLEM 5-9 FINANCIAL STATEMENTS
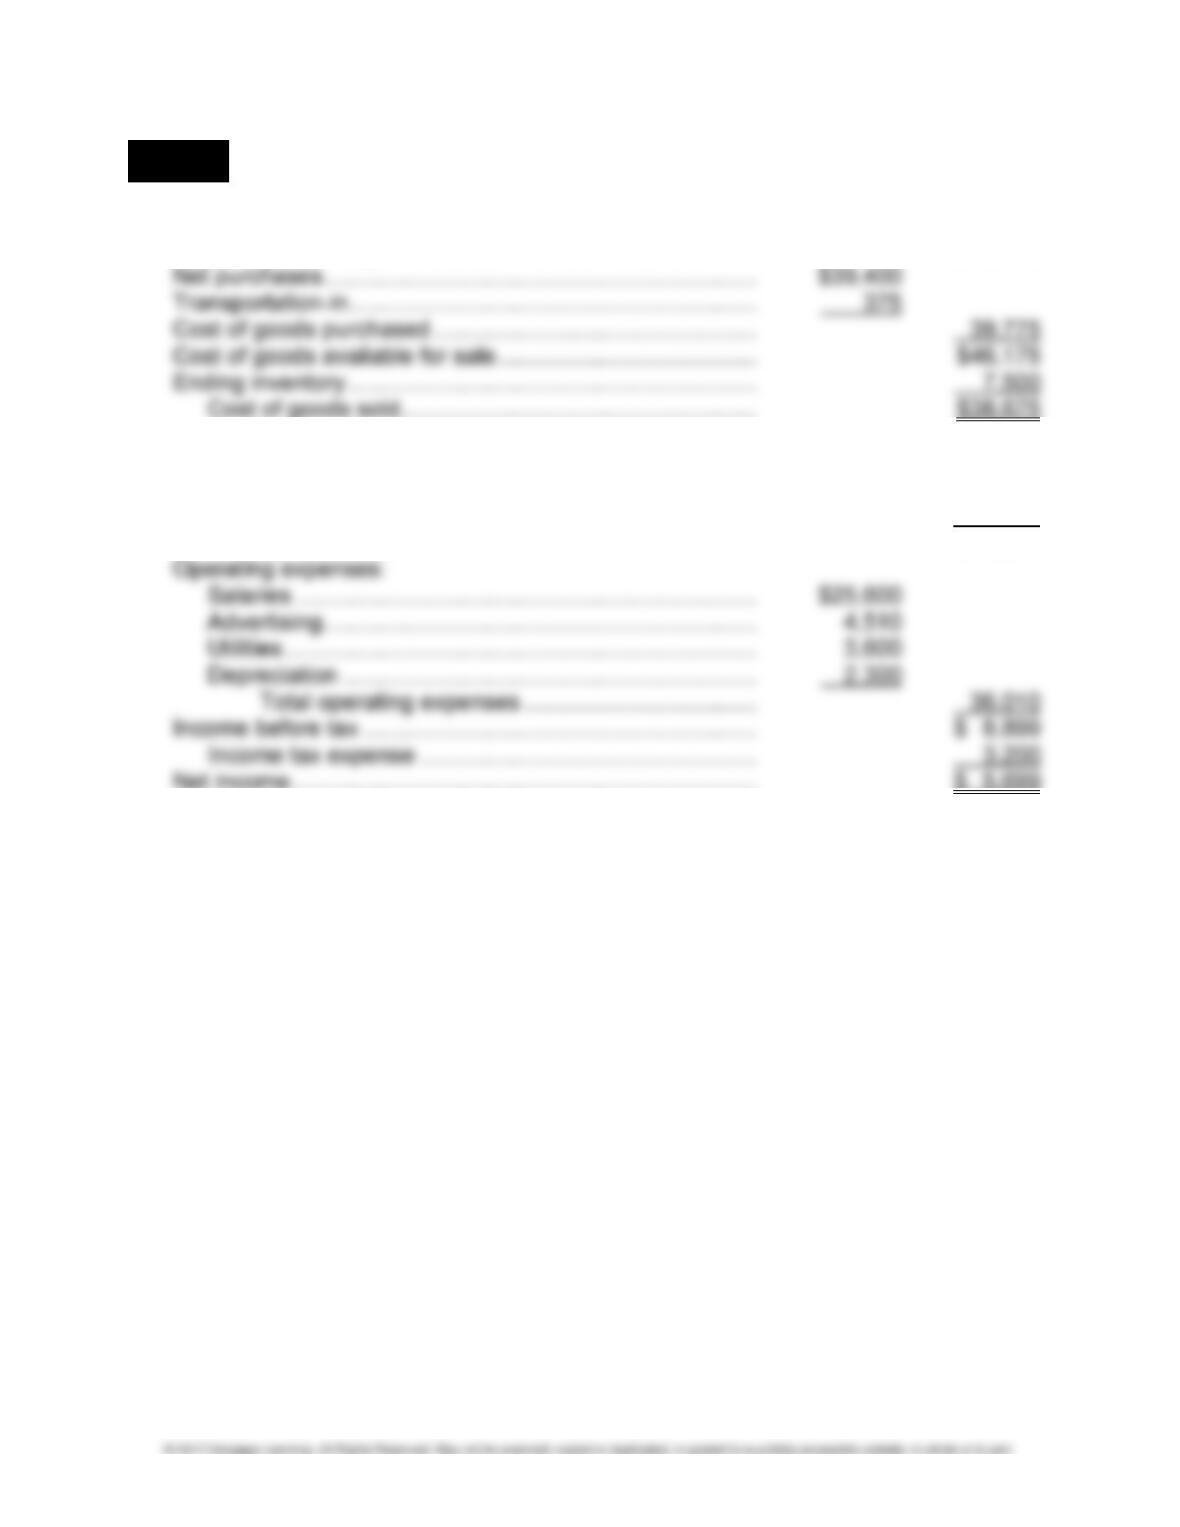
1. Cost of goods sold for 2016:
Beginning inventory .......................................................... $ 6,400
2. Net income for 2016:
Net sales ........................................................................... $83,584
Cost of goods sold [from part (1)] ...................................... 38,675
Gross profit .................................................................. $44,909
5-34 FINANCIAL ACCOUNTING SOLUTIONS MANUAL
PROBLEM 5-9 (Concluded)
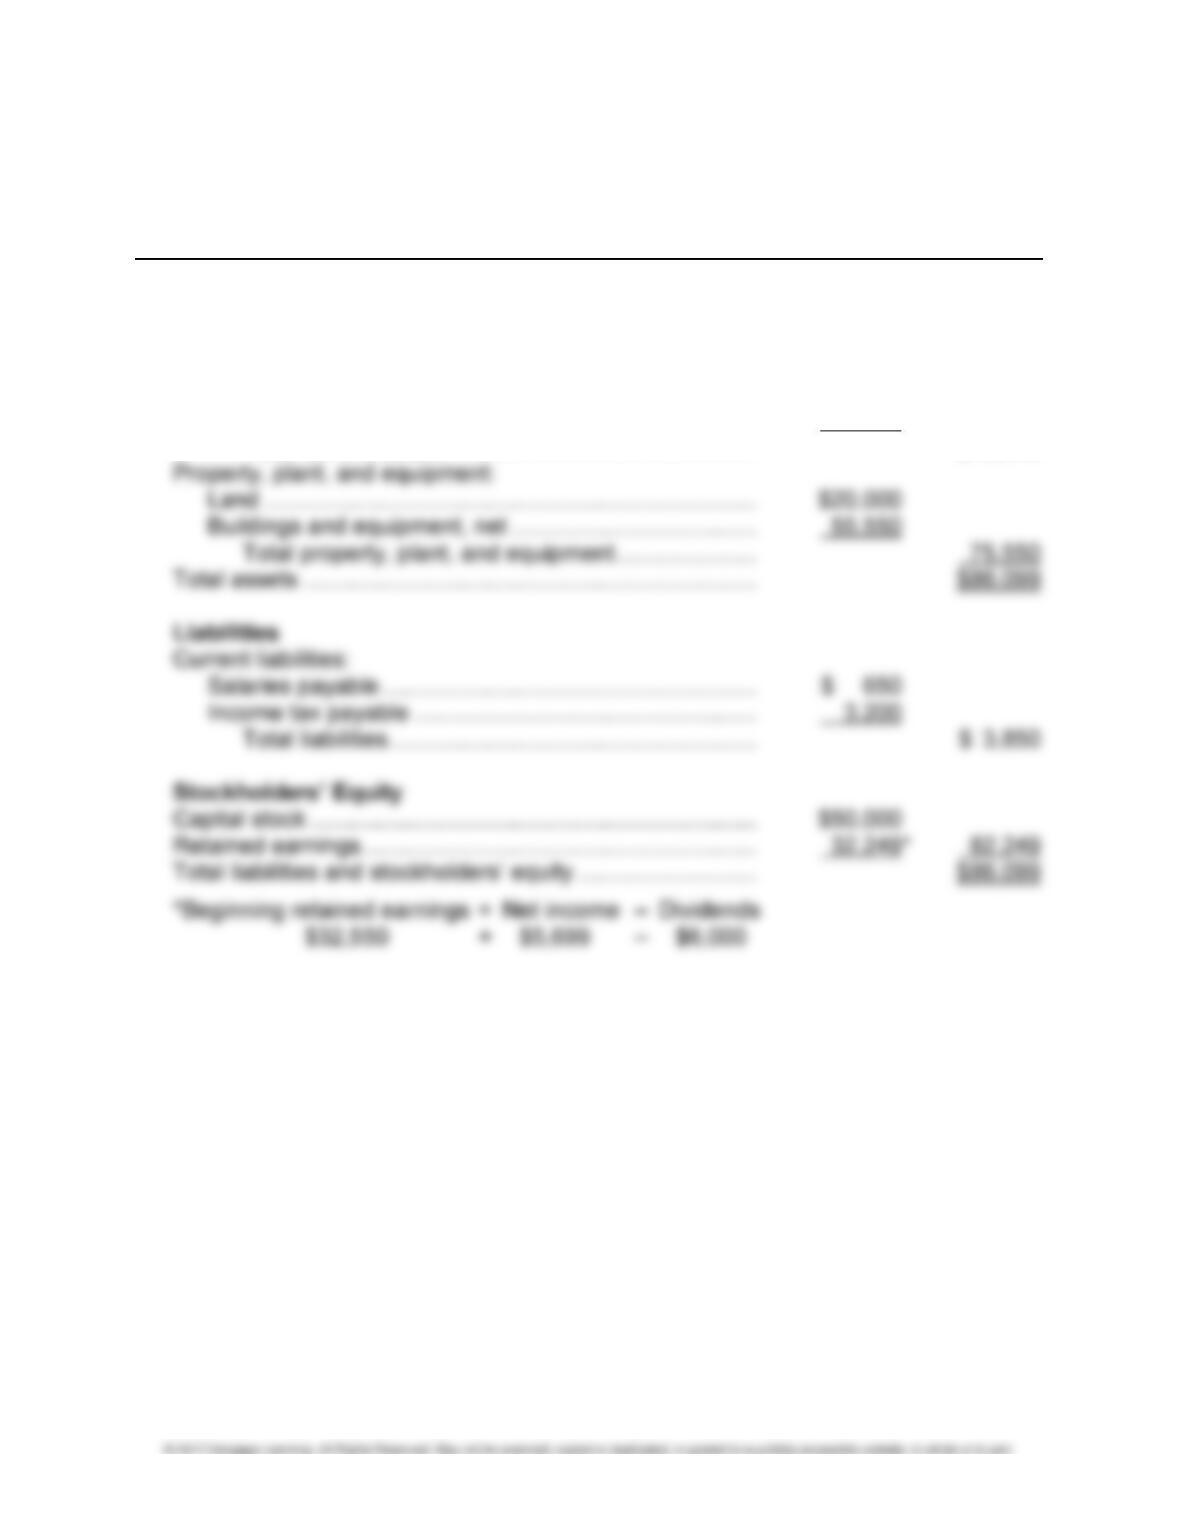
3. MAPLE INC.
BALANCE SHEET
AT DECEMBER 31, 2016
Assets
Current assets:
Cash ............................................................................ $ 590
Accounts receivable .................................................... 2,359
Inventory ...................................................................... 7,500
Interest receivable ...................................................... 100
Total current assets ................................................ $10,549
CHAPTER 5 • INVENTORIES AND COST OF GOODS SOLD 5-35
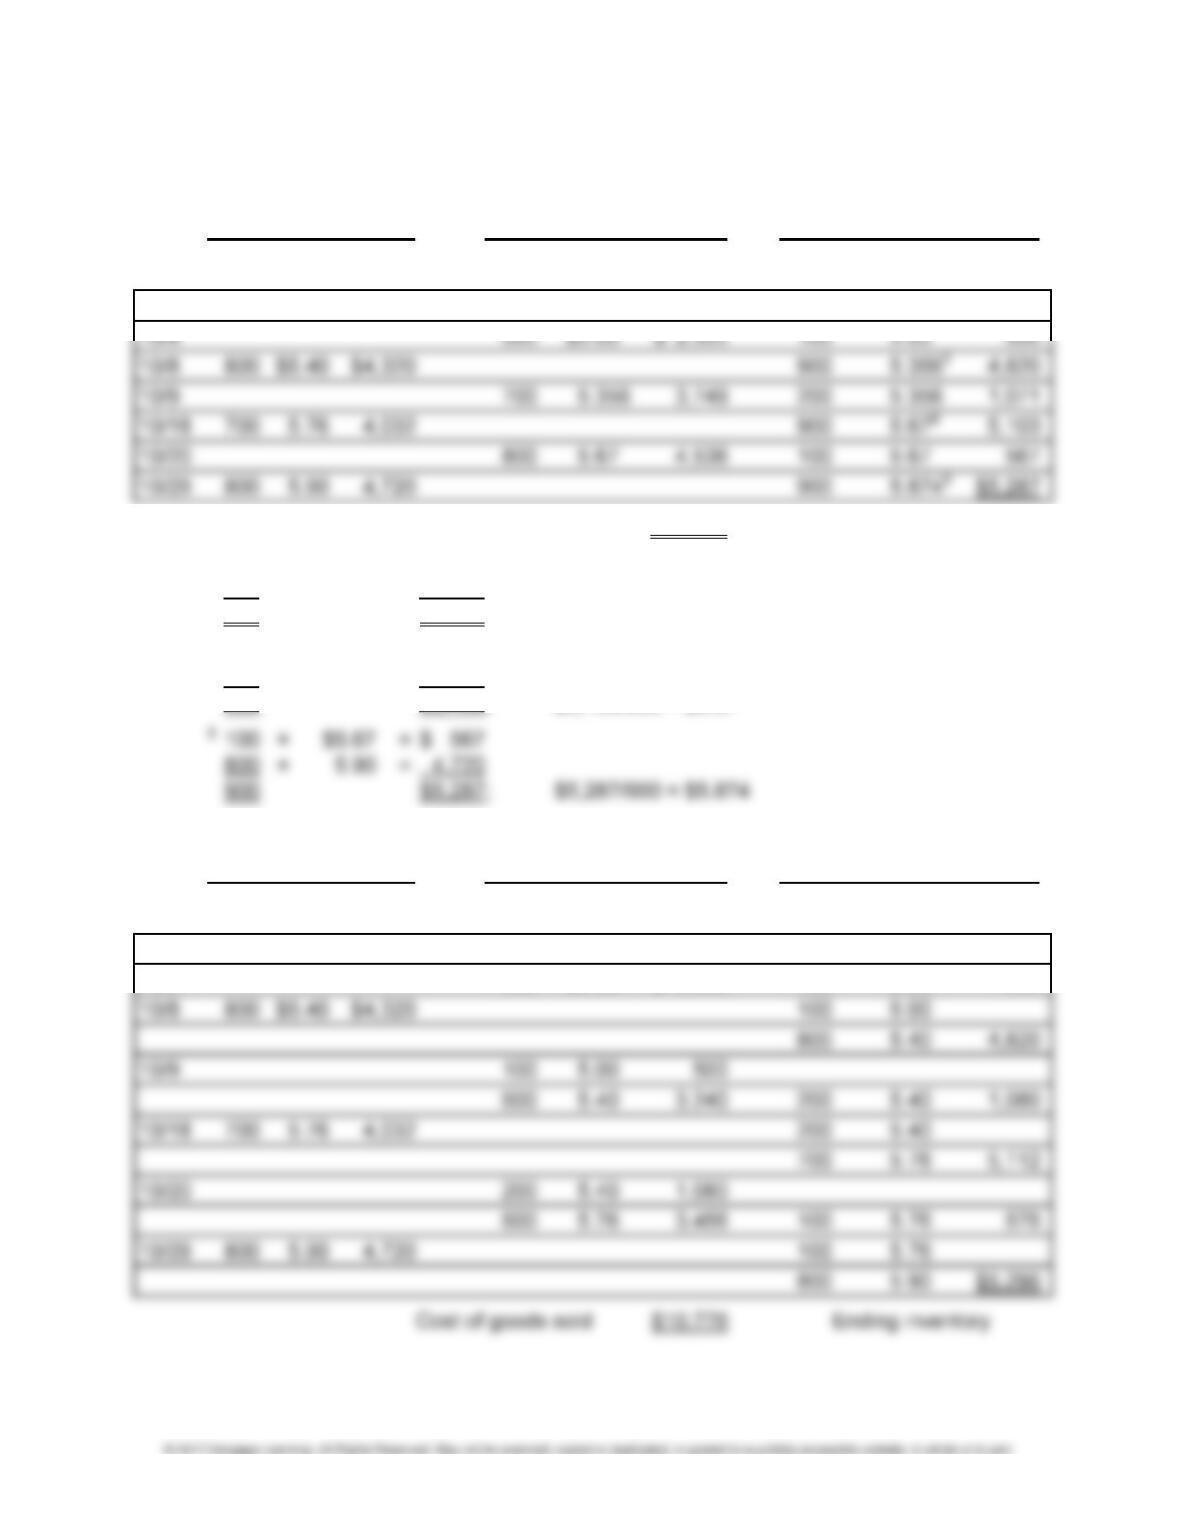
LO 5,6,7 PROBLEM 5-10 COMPARISON OF INVENTORY COSTING METHODS—
PERIODIC SYSTEM
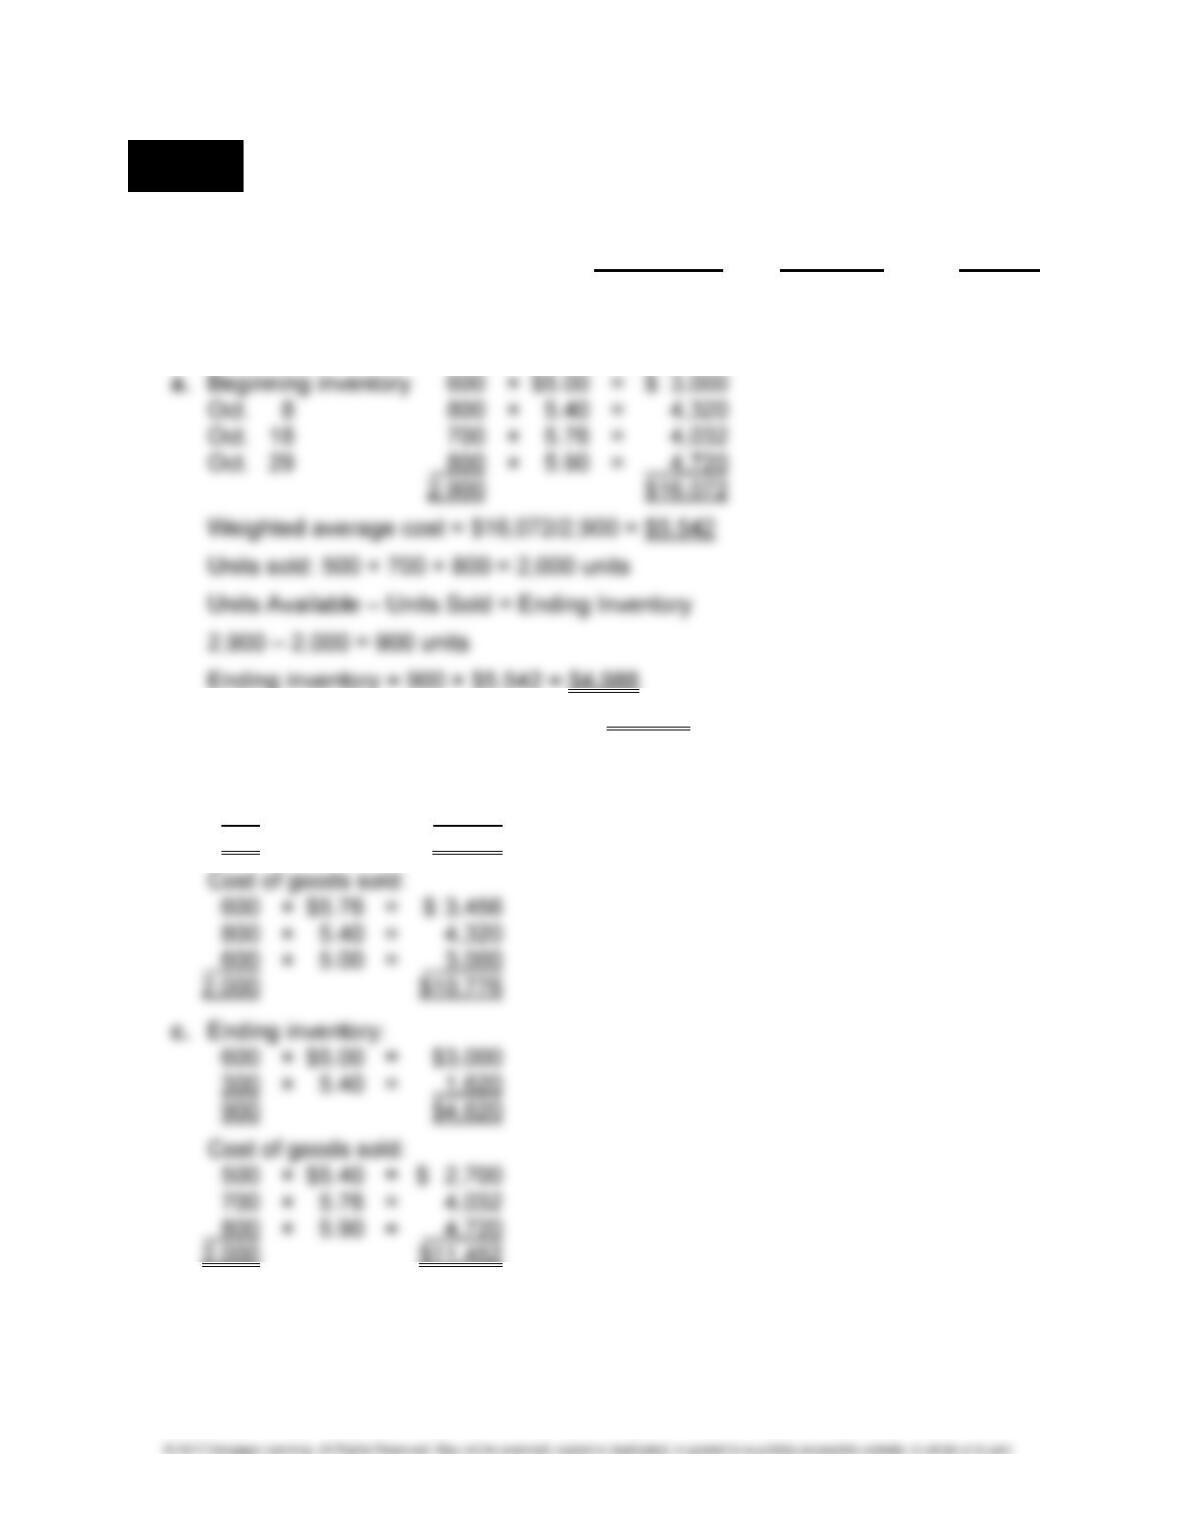
1. Cost of Ending
Goods Sold Inventory Total
a. Weighted average ....................... $11,084 $4,988 $16,072
b. FIFO ............................................ 10,776 5,296 16,072
c. LIFO ............................................ 11,452 4,620 16,072
Cost of goods sold = 2,000 × $5.542 = $11,084
b. Ending inventory:
800 × $5.90 = $4,720
100 × 5.76 = 576
900 $5,296
5-36 FINANCIAL ACCOUNTING SOLUTIONS MANUAL
PROBLEM 5-10 (Concluded)
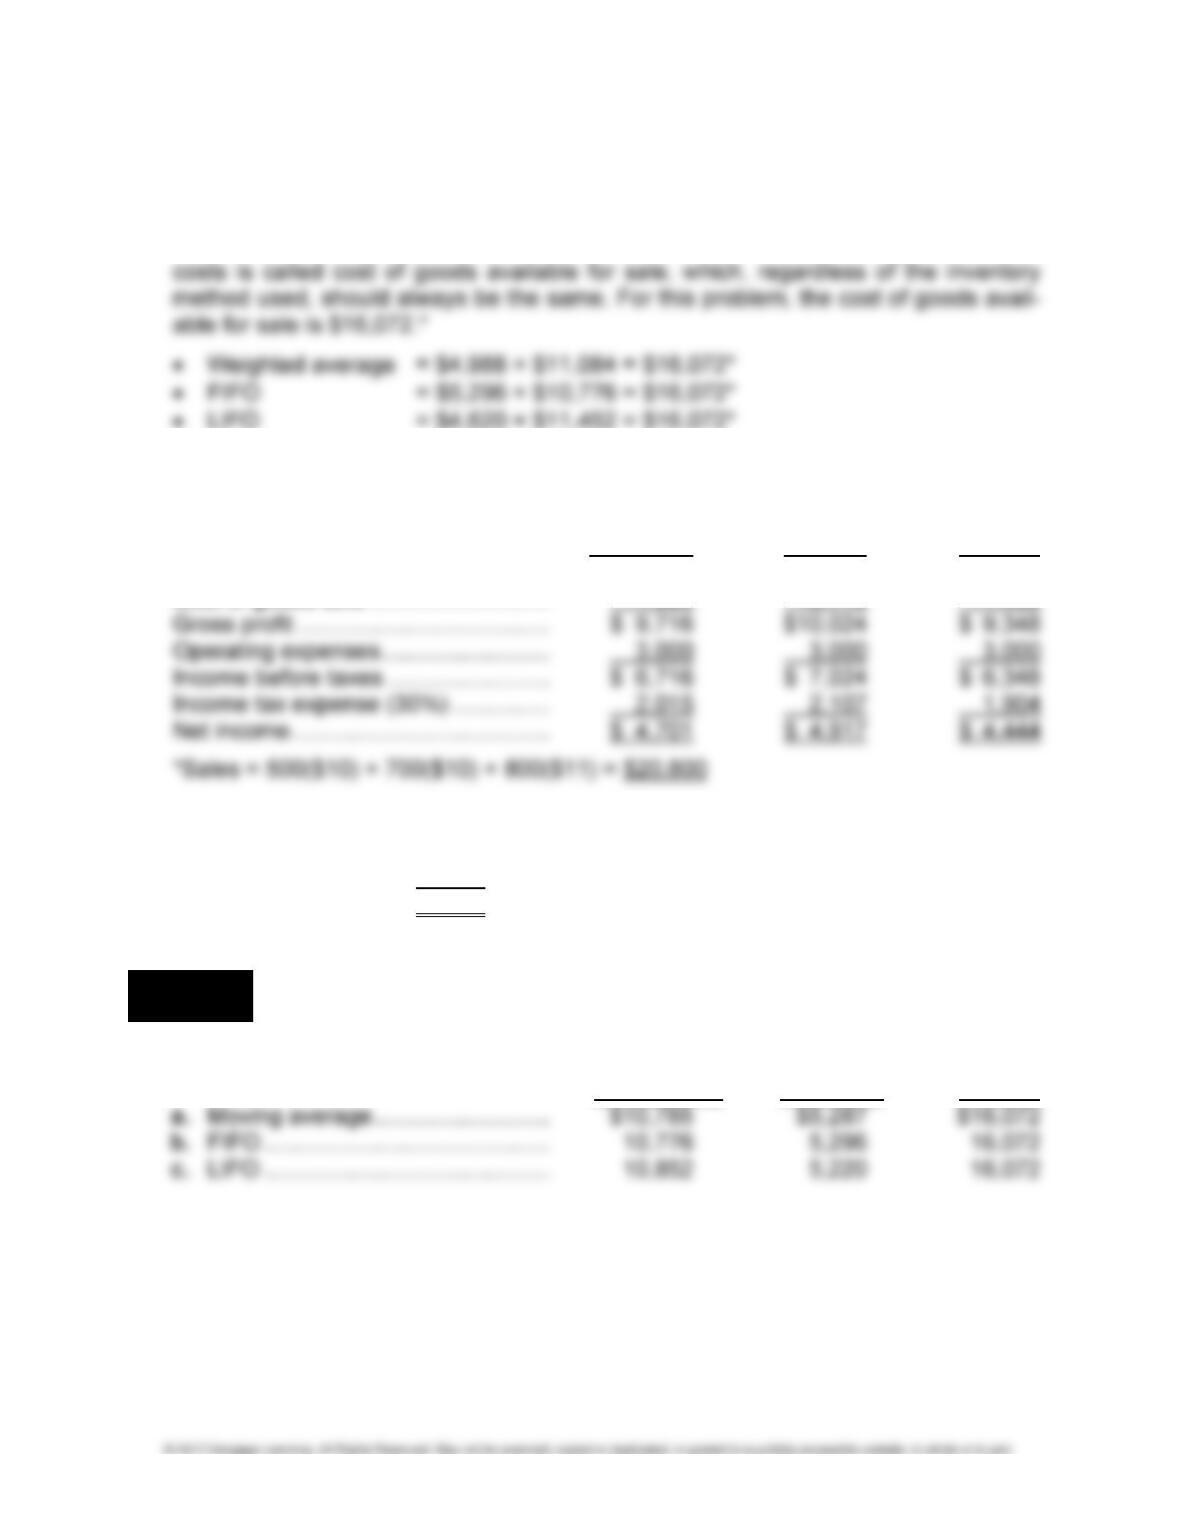
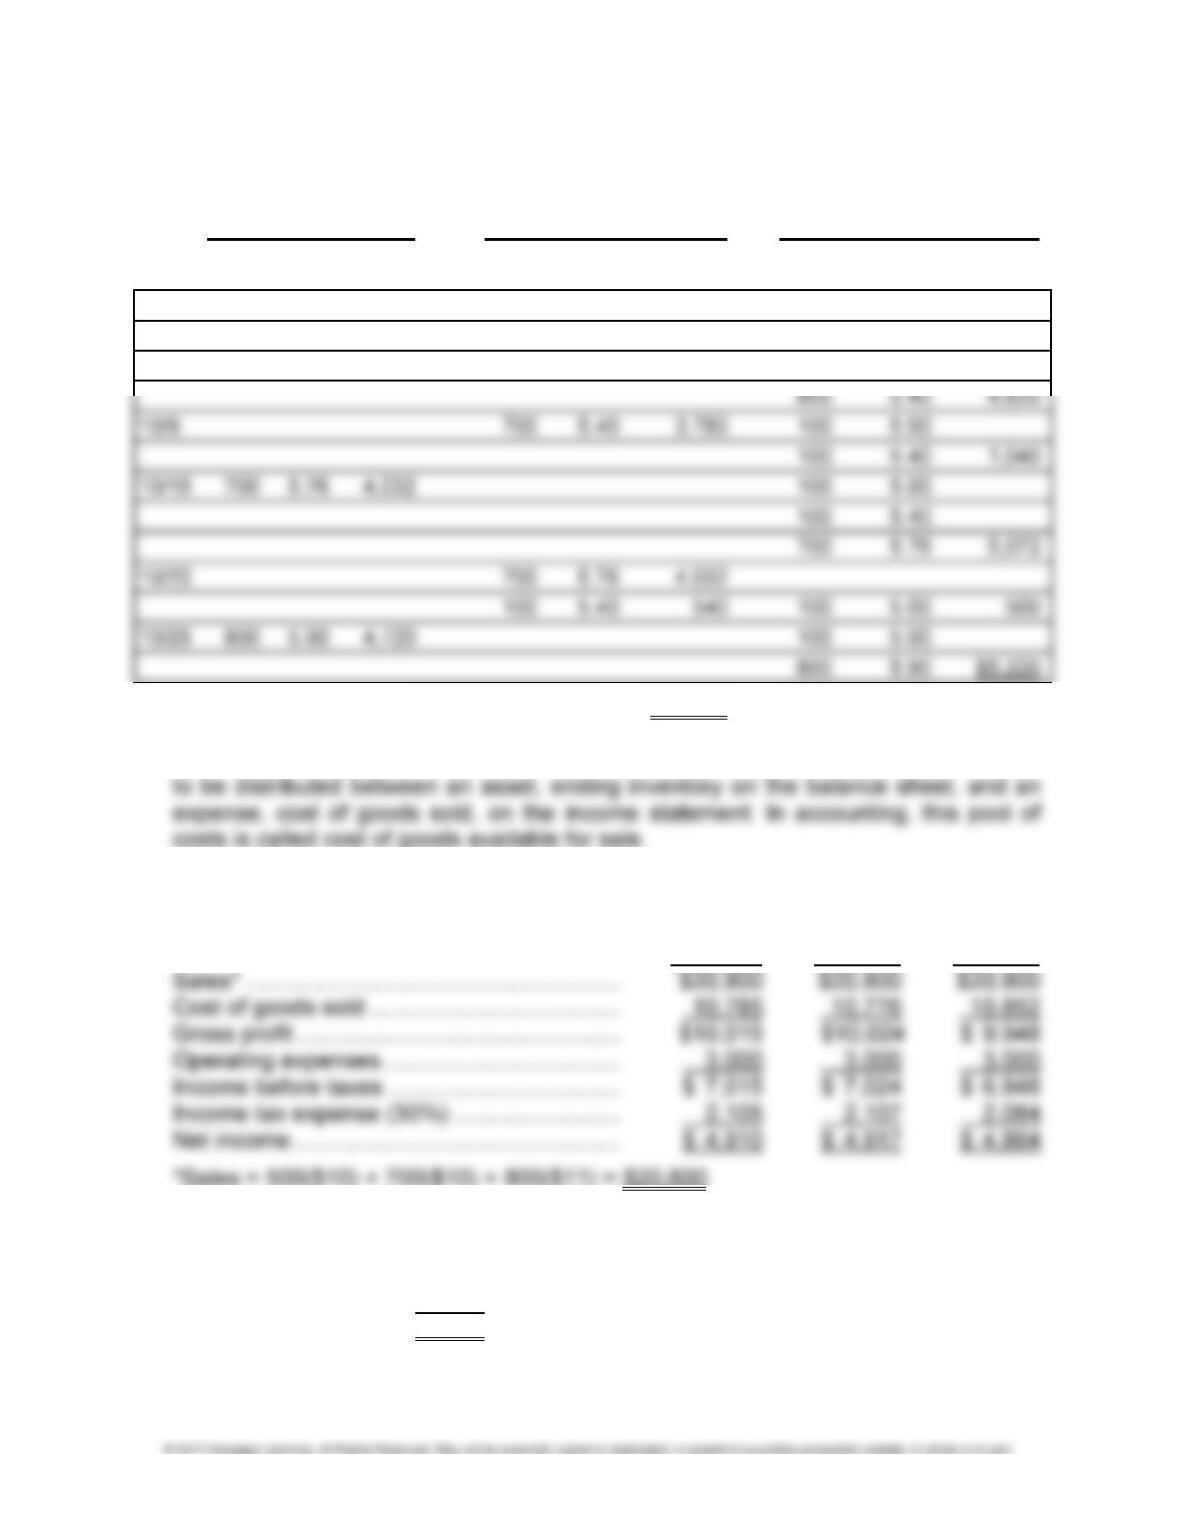
2. The Total column represents the pool of costs (beginning inventory plus purchases)
to be distributed between an asset, ending inventory on the balance sheet, and an
expense, cost of goods sold on the income statement. In accounting, this pool of
3. Income statements for the month of October:
Weighted
Average
FIFO LIFO
Sales* ............................................... $20,800 $20,800 $20,800
Cost of goods sold ............................ 11,084 10,776 11,452
4. The company will pay $203 more in taxes if it uses FIFO:
FIFO tax ................. $2,107
LIFO tax ................. 1,904
Difference .............. $ 203
LO 5,7,12 PROBLEM 5-11 COMPARISON OF INVENTORY COSTING METHODS—
PERPETUAL SYSTEM (Appendix)
1. Cost of Ending
Goods Sold Inventory Total
CHAPTER 5 • INVENTORIES AND COST OF GOODS SOLD 5-37
PROBLEM 5-11 (Continued)
a. Moving average:
Purchases
Sales Balance
Unit Total Unit Total Unit
Date Units Cost Cost Units Cost Cost Units Cost Balance
10/1 600 $5.00 $3,000
Cost of goods sold $10,785 Ending inventory
1 100 × $5.00 = $ 500
800 × 5.40 = 4,320
900 $4,820; $4,820/900 = $5.356
2 200 × $5.356 = $1,071
700 × 5.76 = 4,032
900 $ 5,103; $5,103/900 = $5.67
b. FIFO:
Purchases
Sales Balance
Unit Total Unit Total Unit
Date Units Cost Cost Units Cost Cost Units Cost Balance
10/1 600 $5.00 $3,000
10/4 500 $5.00 $ 2,500 100 5.00 500
5-38 FINANCIAL ACCOUNTING SOLUTIONS MANUAL
PROBLEM 5-11 (Concluded)
c. LIFO:
Purchases
Sales Balance
Unit Total Unit Total Unit
Date Units Cost Cost Units Cost Cost Units Cost Balance
10/1 600 $5.00 $3,000
10/4 500 $5.00 $ 2,500 100 5.00 500
10/8 800 $5.40 $4,320 100 5.00
Cost of goods sold $10,852 Ending inventory
2. The Total column represents the pool of costs (beginning inventory plus purchases)
3. Income statements for the month of October:
Moving
Average FIFO LIFO
4. The company will pay $23 more in taxes if it uses FIFO:
FIFO tax ................. $2,107
LIFO tax ................. 2,084
Difference .............. $ 23
CHAPTER 5 • INVENTORIES AND COST OF GOODS SOLD 5-39
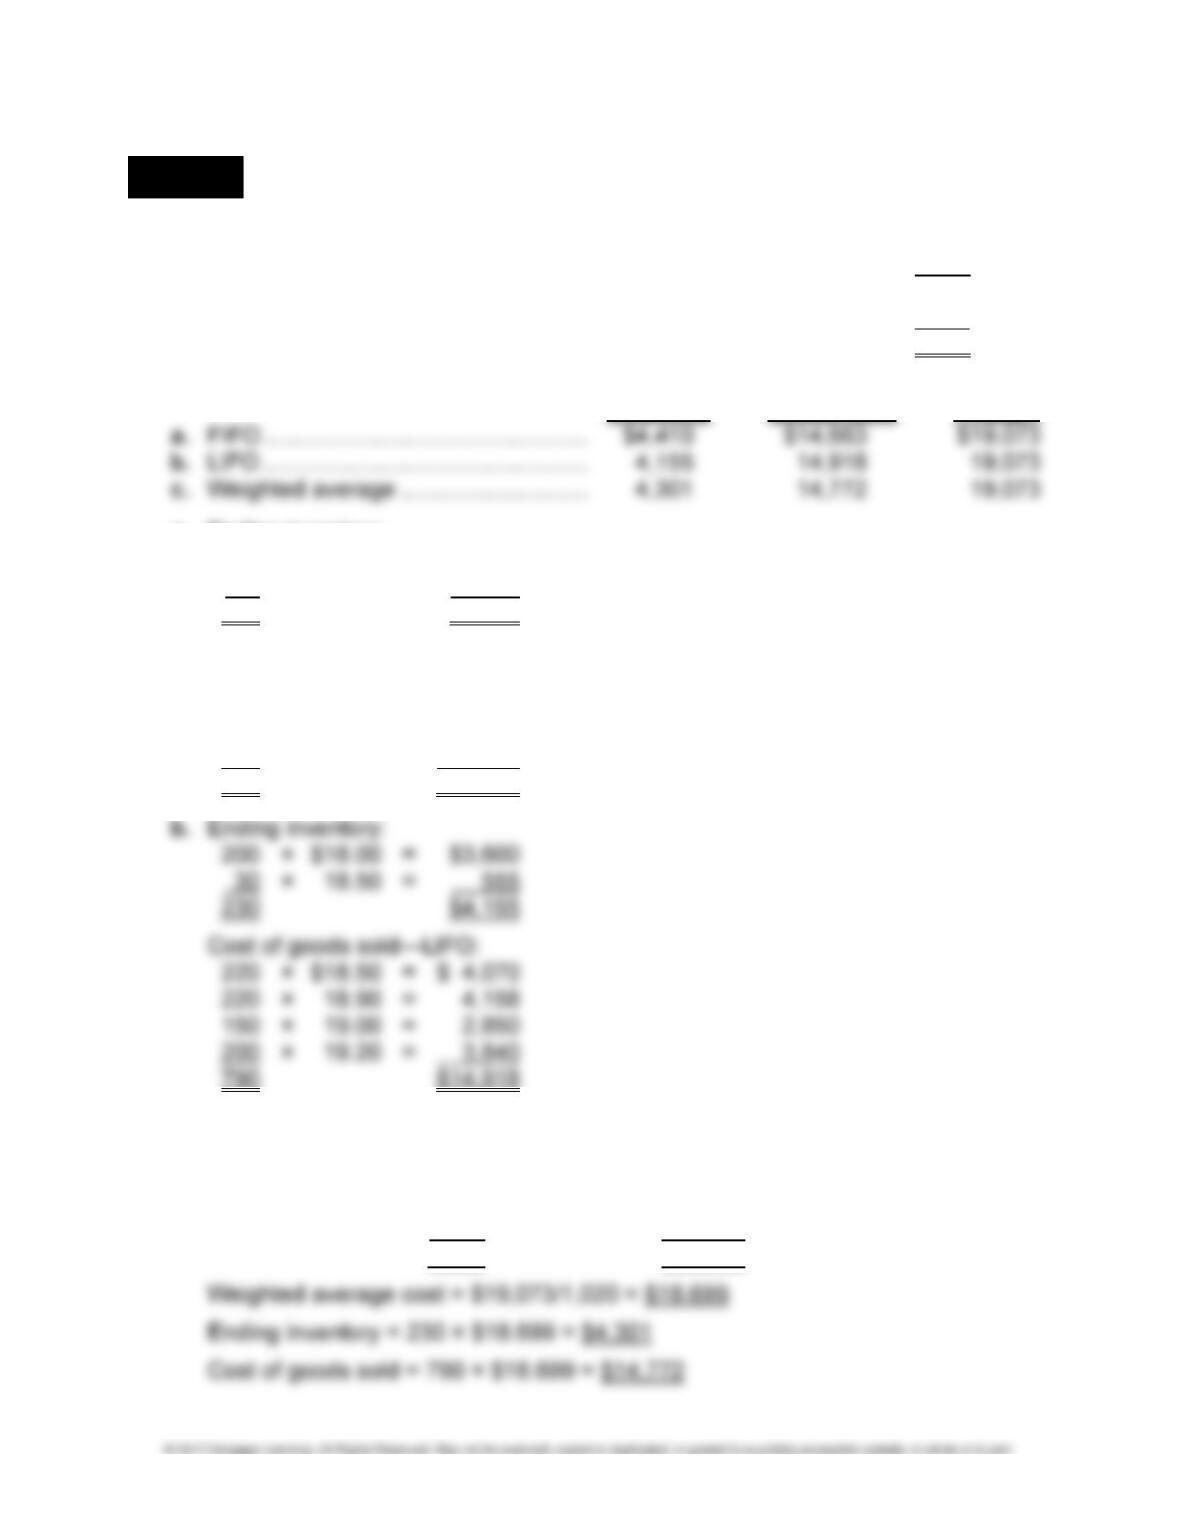
LO 5,6,7 PROBLEM 5-12 INVENTORY COSTING METHODS—PERIODIC SYSTEM
1. Units in beginning inventory ......................................................... 200
Units purchased (250 + 220 + 150 + 200) .................................... 820
Units available ............................................................................. 1,020
Units sold (300 + 380 + 110) ........................................................ (790)
Units in ending inventory .............................................................. 230
Ending Cost of
Inventory Goods Sold Total
a. Ending inventory:
200 × $19.20 = $3,840
30
× 19.00 = 570
230 $4,410
Cost of goods sold:
200 × $18.00 = $ 3,600
250 × 18.50 = 4,625
220 × 18.90 = 4,158
120 × 19.00 = 2,280
790 $14,663
c. Beginning inventory 200 × $18.00 = $ 3,600
Nov. 4 250 × 18.50 = 4,625
Nov. 13 220 × 18.90 = 4,158
Nov. 18 150 × 19.00 = 2,850
Nov. 24 200 × 19.20 = 3,840
1,020 $19,073
5-40 FINANCIAL ACCOUNTING SOLUTIONS MANUAL
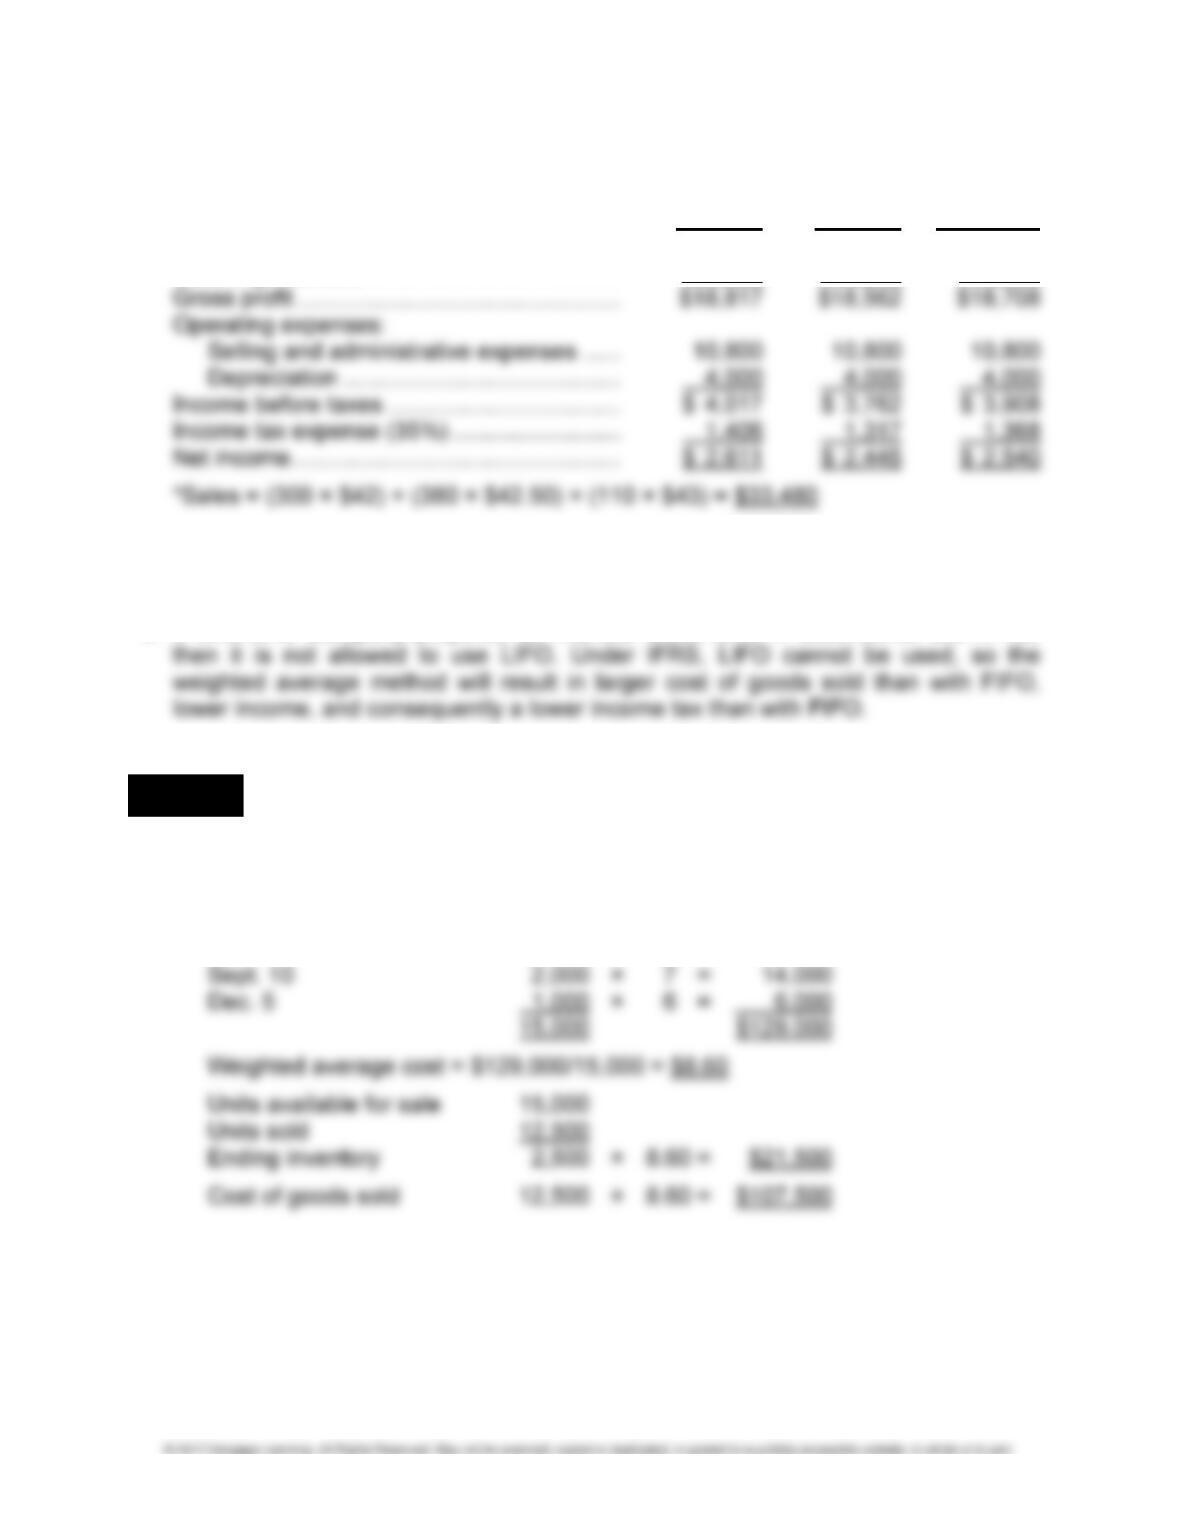
PROBLEM 5-12 (Concluded)
2. Weighted
FIFO
LIFO Average
Sales* .......................................................... $33,480 $33,480 $33,480
Cost of goods sold ....................................... 14,663 14,918 14,772
3. Oxendine pays the least taxes under the last-in, first-out method since it has the
highest cost of goods sold.
4. If Oxendine Company prepares its financial statements in accordance with IFRS,
LO 5,6,7 PROBLEM 5-13 INVENTORY COSTING METHODS—PERIODIC SYSTEM
1. a. Weighted average:
Beginning inventory 5,000 × $10 = $ 50,000
Feb. 4 3,000 × 9 = 27,000
Apr. 12 4,000 × 8 = 32,000


