Exercise 5-13 (30 minutes)
1. The contribution margin per person would be:
Price per ticket …………………………………………..
$30
Variable expenses:
Dinner ……………………………………………………
$7
Favors and program ………………………………….
3
10
Contribution margin per person ……………………..
$20
= Unit CM × Q − Fixed expenses
= $8,000
= $8,000 ÷ $20
= 400 persons; or, at $30 per person, $12,000
Alternative solution:
Fixed expenses
Unit sales =
to break even Unit contribution margin
$8,000
= = 400 persons
$20 per person
Variable cost per person ($7 + $3) …………………..
$10
Fixed cost per person ($8,000 ÷ 250 persons) ……
Ticket price per person to break even ……………….
$42
Exercise 5-13 (continued)
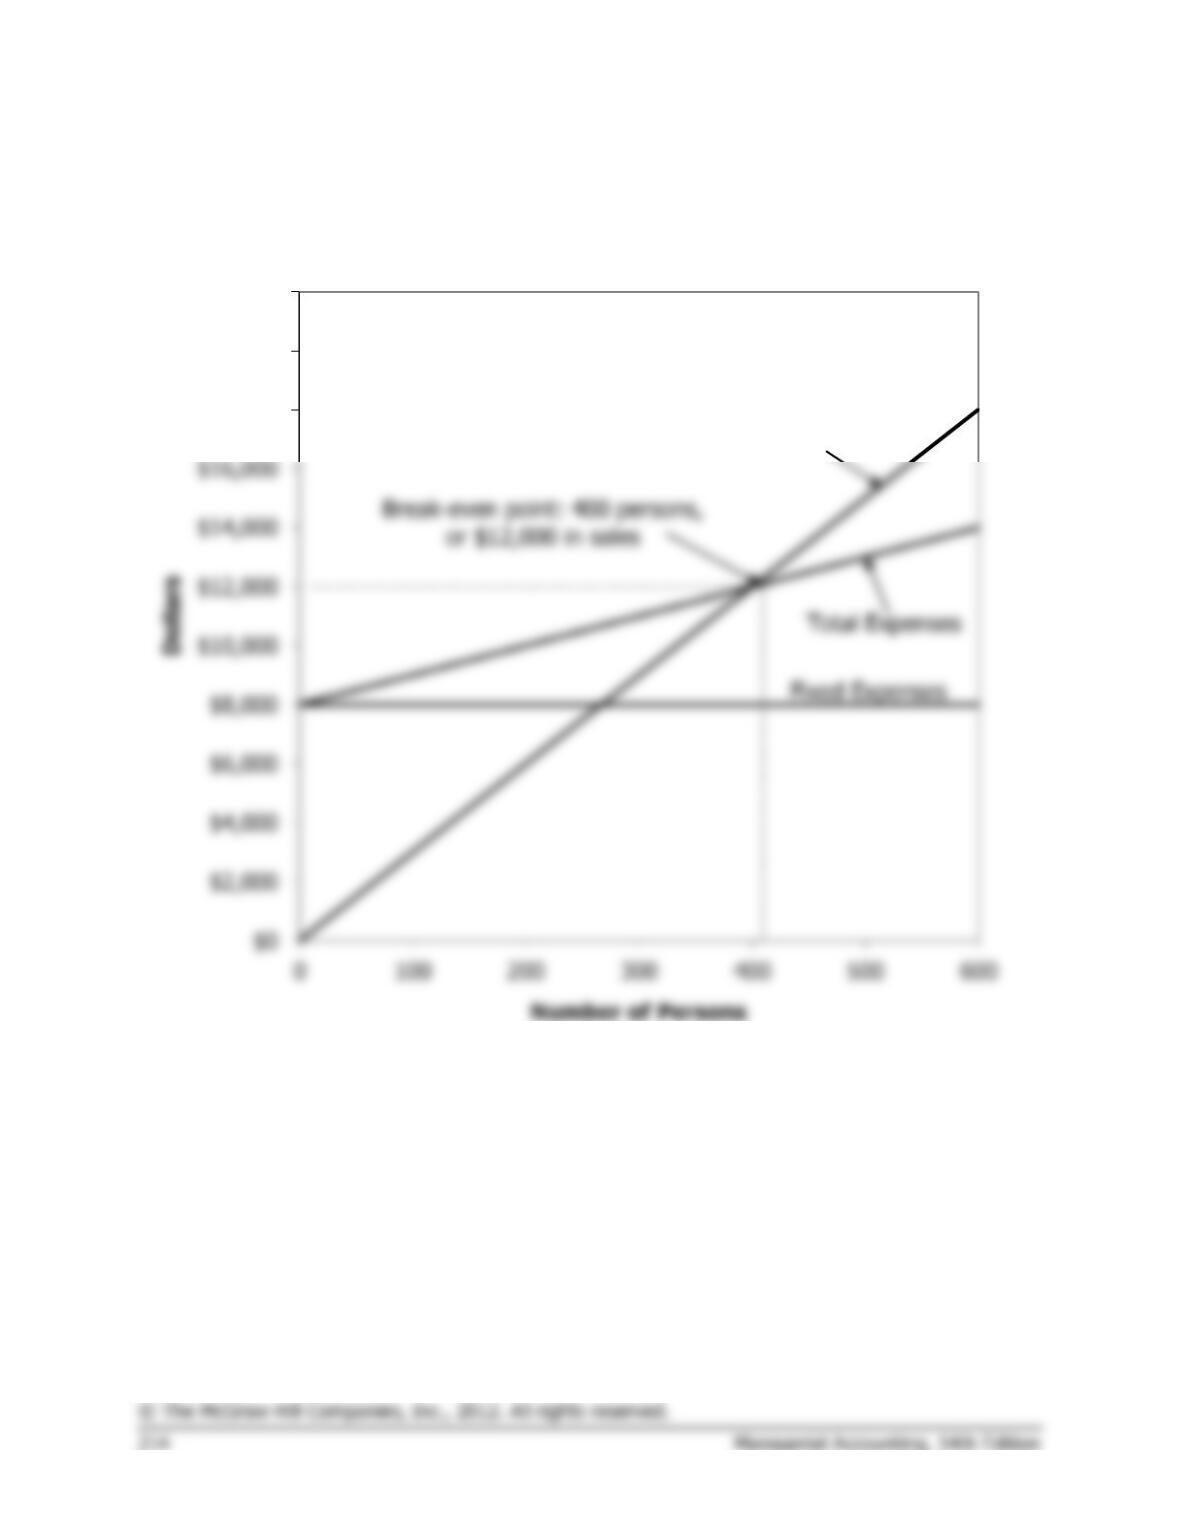
3. Cost-volume-profit graph:
Fixed Expenses
Total Expenses
$18,000
$20,000
$22,000
Total Sales
Exercise 5-14 (30 minutes)
1.
Model A100
Model B900
Total Company
Amount
%
Amount
%
Amount
%
Sales ……………
$700,000
100
$300,000
100
$1,000,000
100
Variable
expenses …….
280,000
40
90,000
30
370,000
37
$420,000
60
$210,000
70
63
$ 31,500
2. The break-even point for the company as a whole is:
Fixed expenses
Break-even point in =
total dollar sales Overall CM ratio
3. The additional contribution margin from the additional sales is computed
as follows:
$50,000 × 63% CM ratio = $31,500
Exercise 5-15 (15 minutes)
1.
Sales (30,000 doors) ………..
$1,800,000
$60
Variable expenses ……………
1,260,000
42
Contribution margin ………….
540,000
$18
Fixed expenses ……………….
450,000
Net operating income ……….
$ 90,000
2. a. Sales of 37,500 doors represent an increase of 7,500 doors, or 25%,
over present sales of 30,000 doors. Because the degree of operating
leverage is 6, net operating income should increase by 6 times as
much, or by 150% (6 × 25%).
Present net operating income ………………………..
Total expected net operating income ………………
Exercise 5-16 (30 minutes)
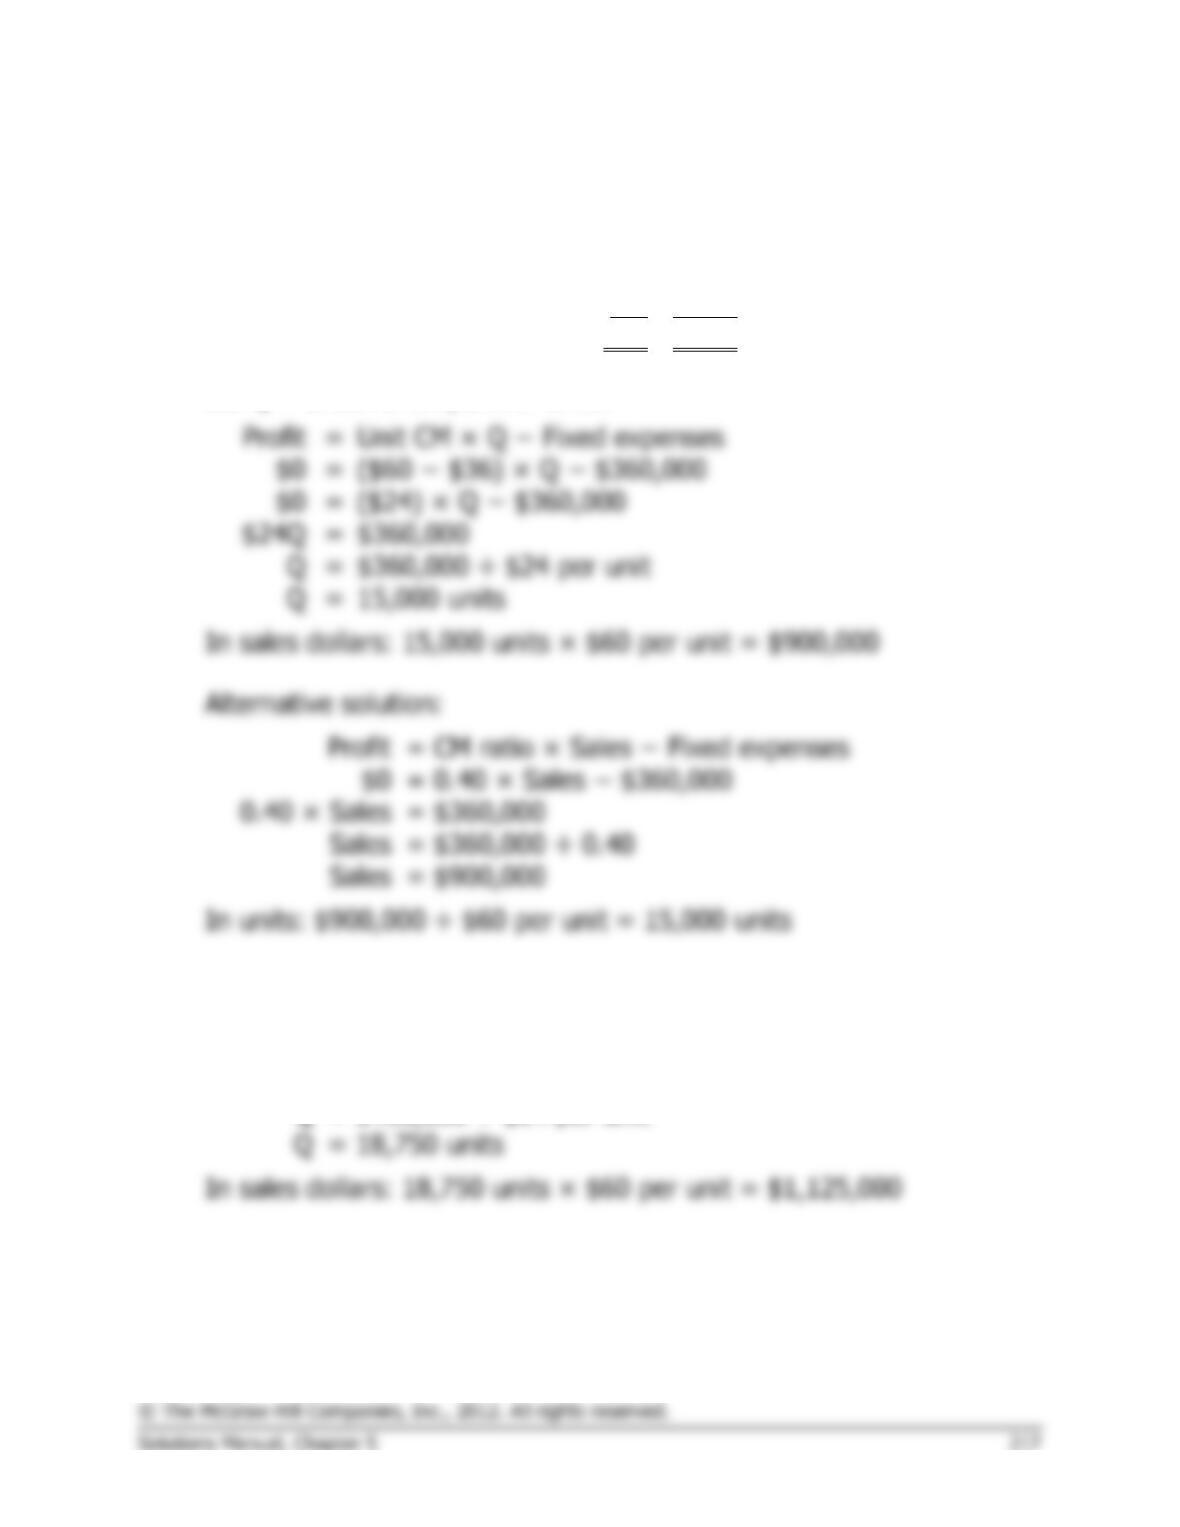
1. Variable expenses: $60 × (100% – 40%) = $36.
2.
a.
Selling price ……………………..
$60
100%
Variable expenses ……………..
36
60%
Contribution margin …………..
$24
40%
Let Q = Break-even point in units.
Unit CM × Q − Fixed expenses
($24) × Q − $360,000
$360,000
$360,000 ÷ $24 per unit
15,000 units
=
CM ratio × Sales − Fixed expenses
=
0.40 × Sales − $360,000
=
$360,000
=
$360,000 ÷ 0.40
=
$900,000
b.
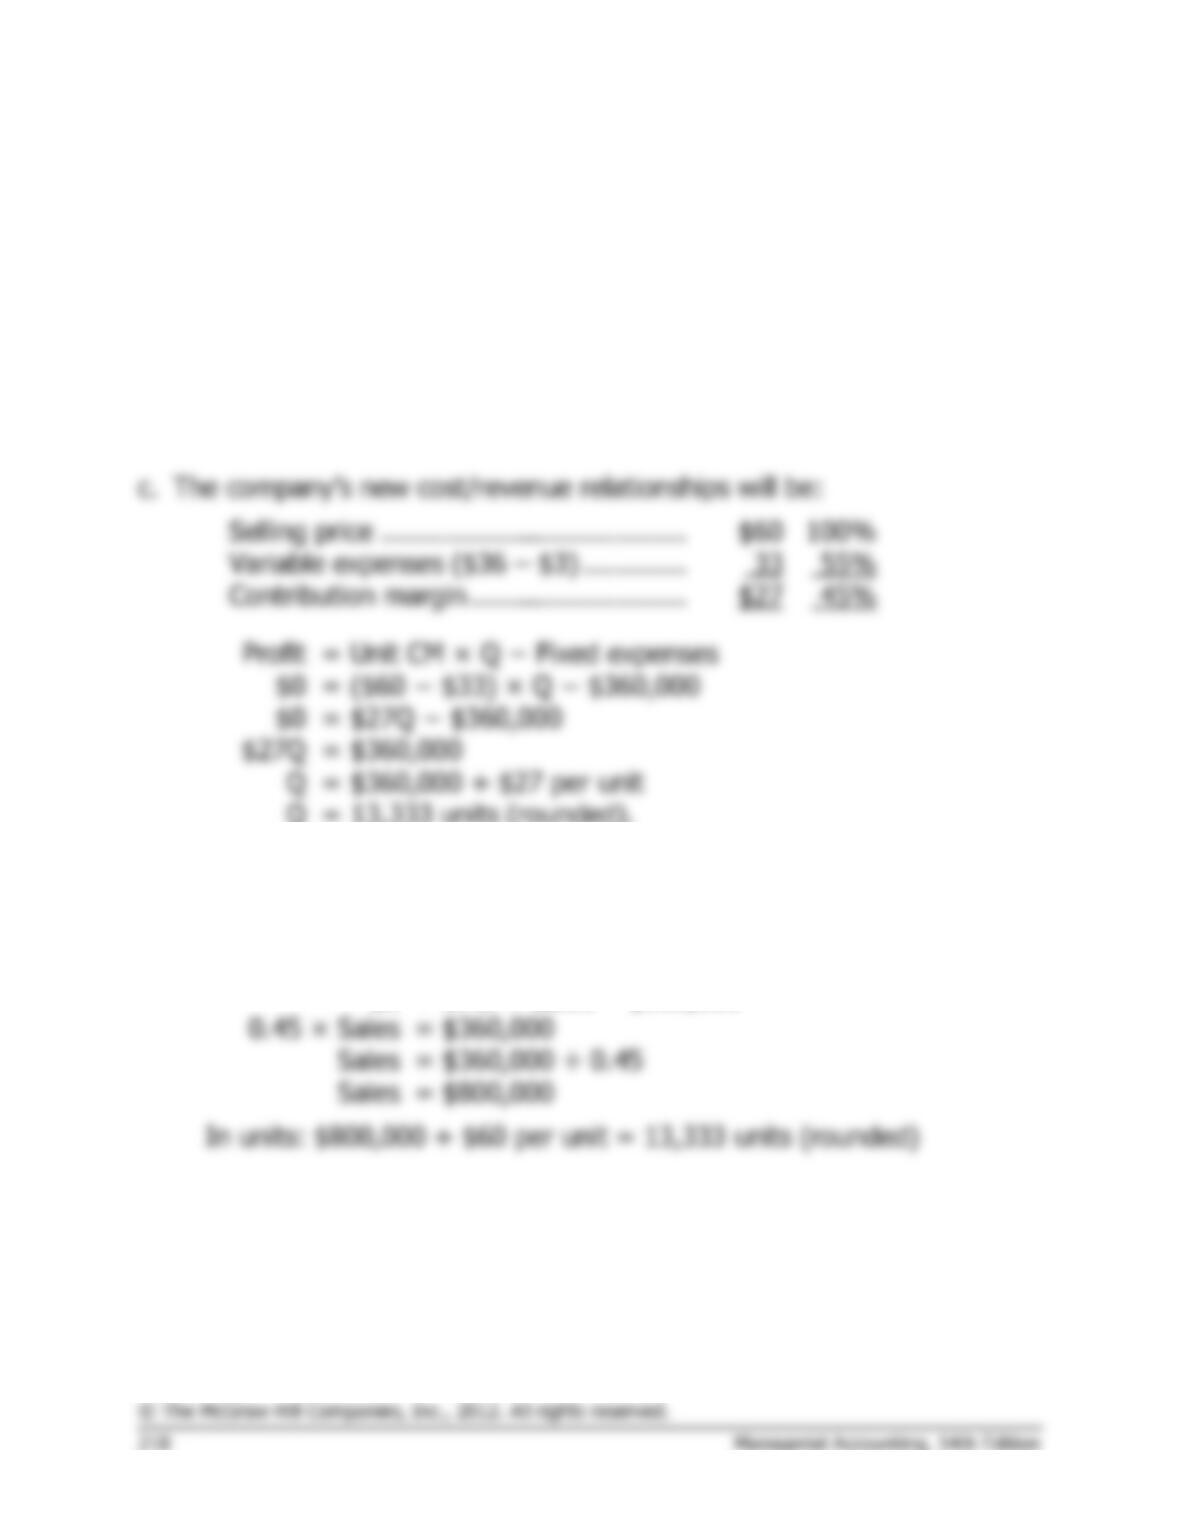
Profit
=
Unit CM × Q − Fixed expenses
$90,000
=
($60 − $36) × Q − $360,000
$90,000
=
($24) × Q − $360,000
$24Q
=
$450,000
Q
=
$450,000 ÷ $24 per unit
Q
=
18,750 units
Exercise 5-16 (continued)
Alternative solution:
Profit
=
CM ratio × Sales − Fixed expenses
$90,000
=
0.40 × Sales − $360,000
0.40 × Sales
=
$450,000
Sales
=
$450,000 ÷ 0.40
Sales
=
$1,125,000
In units: $1,125,000 ÷ $60 per unit = 18,750 units
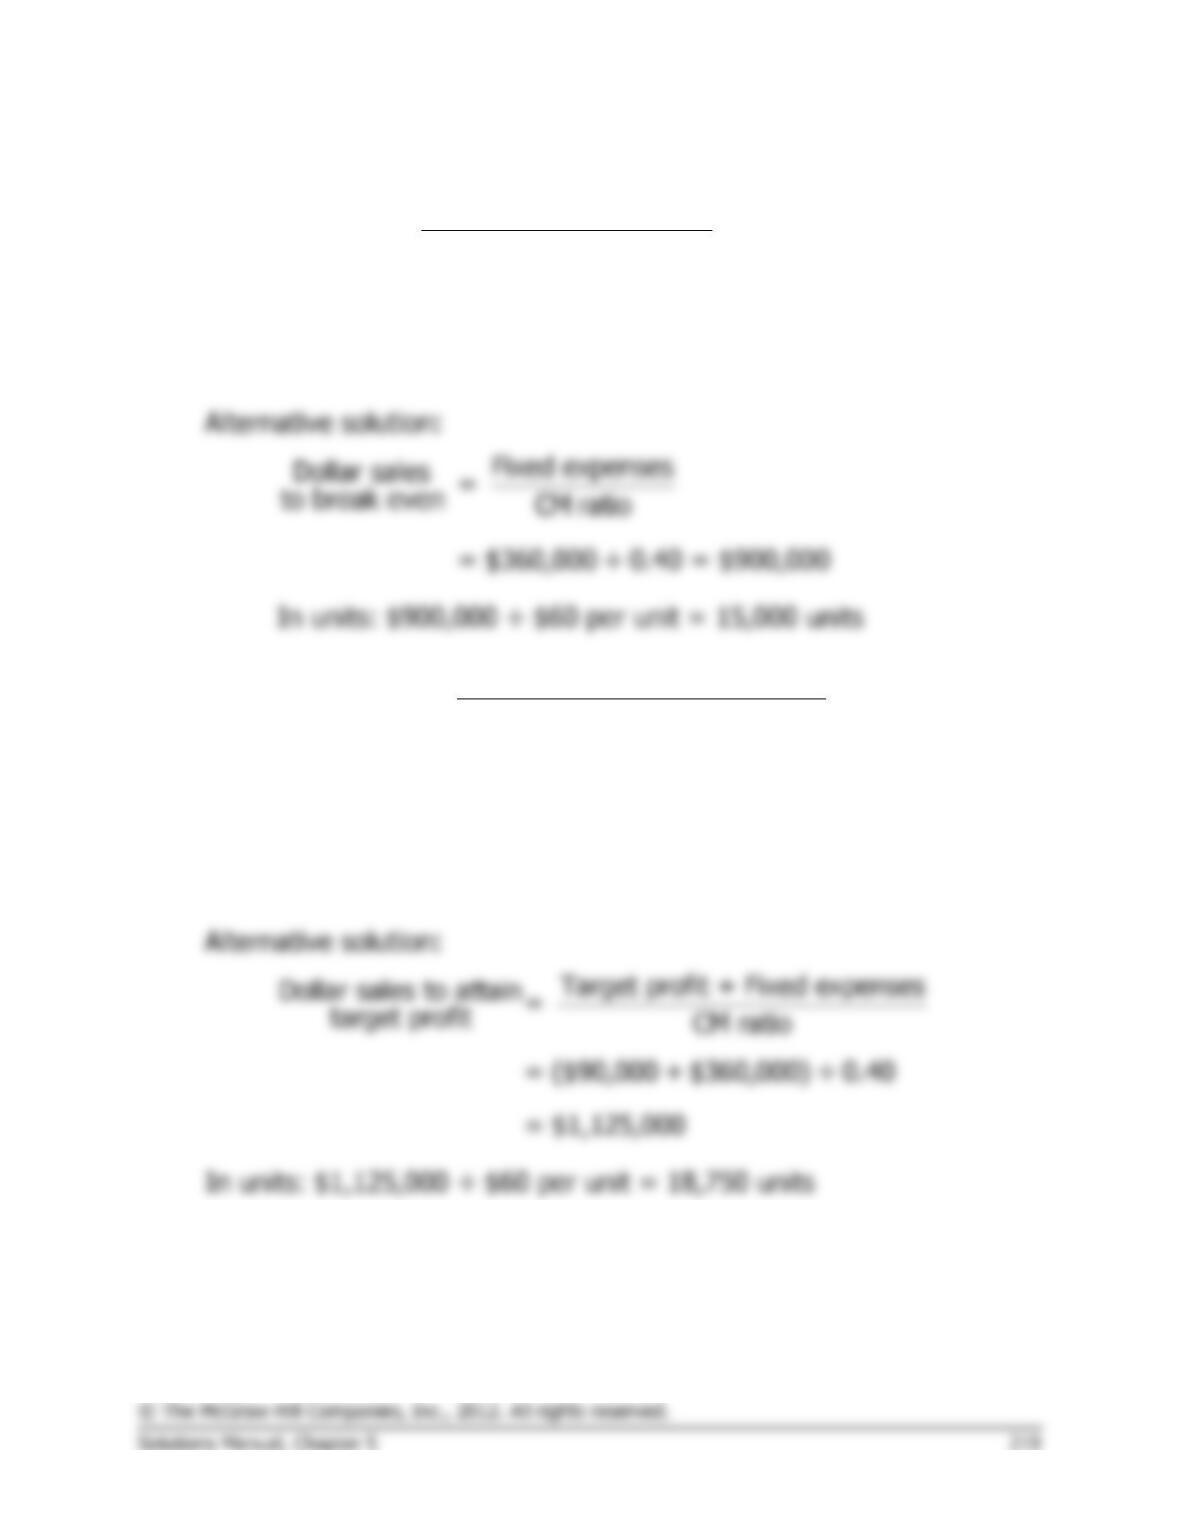
Selling price ………………………………..
Variable expenses ($36 – $3) ………….
Contribution margin ………………………
=
Unit CM × Q − Fixed expenses
=
($60 − $33) × Q − $360,000
=
$27Q − $360,000
=
$360,000
Q
=
$360,000 ÷ $27 per unit
Q
=
13,333 units (rounded).
In sales dollars: 13,333 units × $60 per unit = $800,000 (rounded)
Alternative solution:
Profit
=
CM ratio × Sales − Fixed expenses
$0
=
0.45 × Sales − $360,000
=
$360,000
=
$360,000 ÷ 0.45
=
$800,000
Exercise 5-16 (continued)
3.
a.
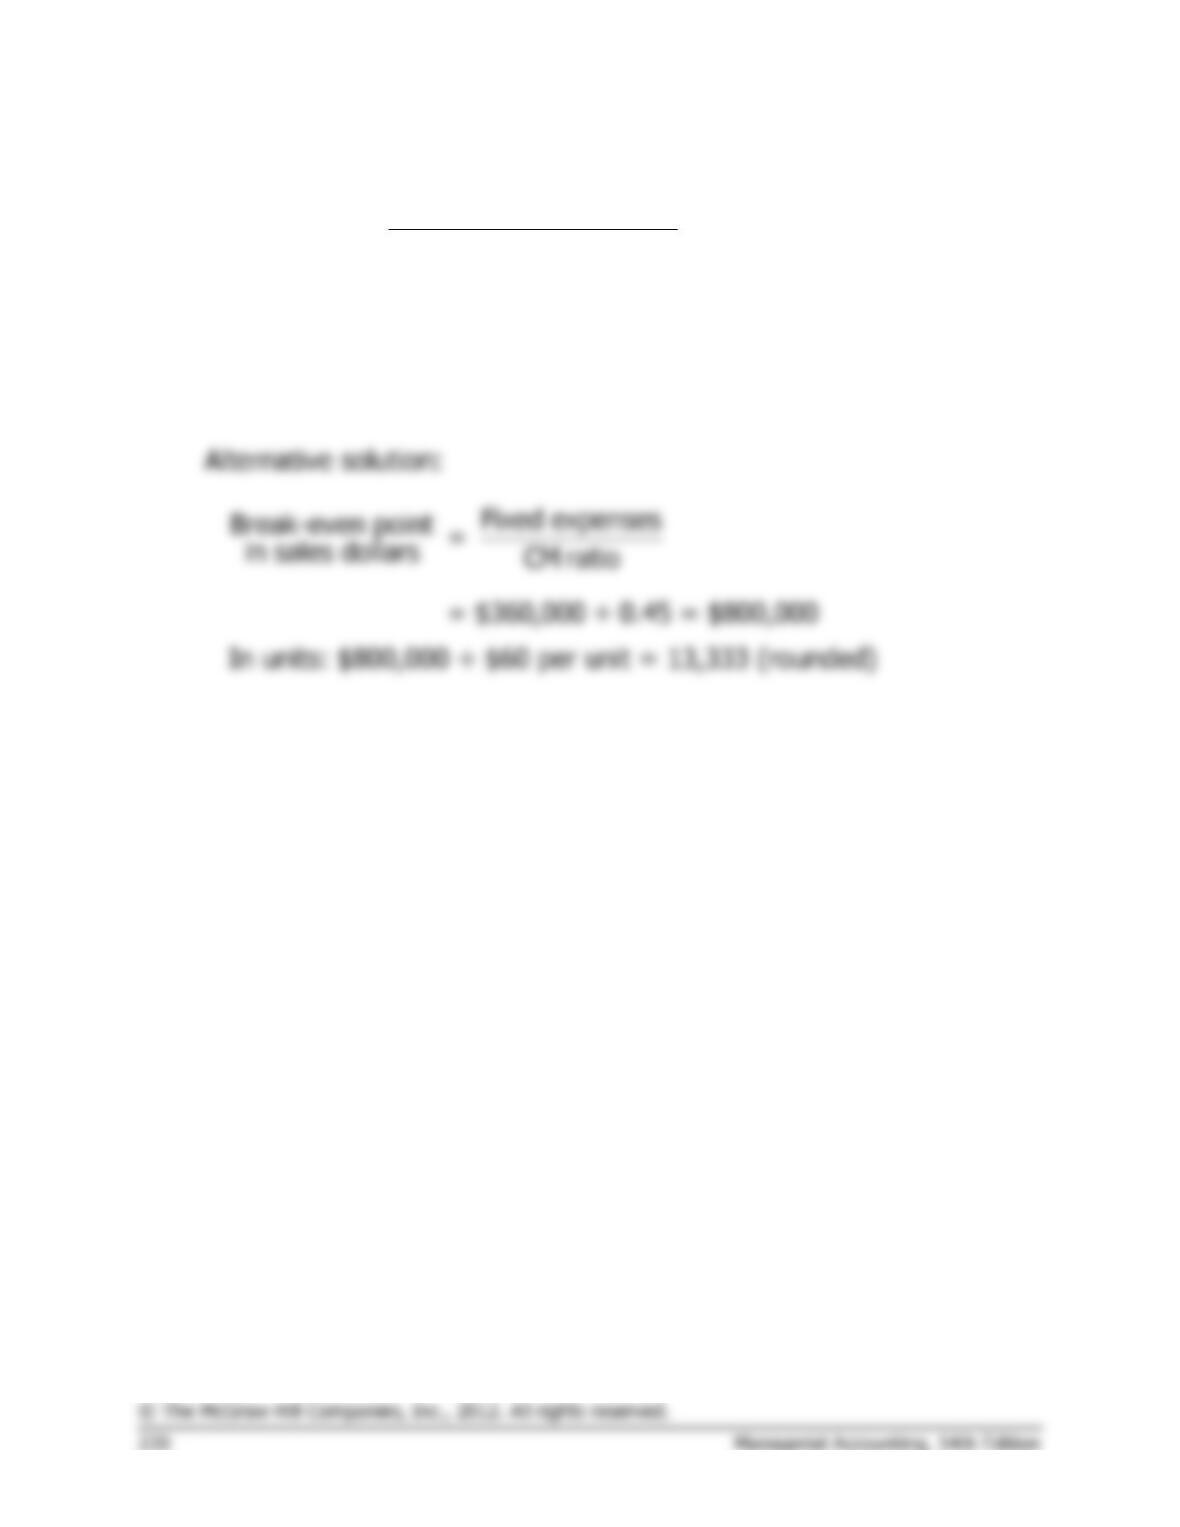
Fixed expenses
Unit sales =
to break even Unit contribution margin
= $360,000 ÷ $24 per unit = 15,000 units
In sales dollars: 15,000 units × $60 per unit = $900,000
b.
Target profit + Fixed expenses
Unit sales to attain=
target profit Unit contribution margin
= ($90,000 + $360,000) ÷ $24 per unit
= 18,750 units
In sales dollars: 18,750 units × $60 per unit = $1,125,000
Exercise 5-16 (continued)
c.
Fixed expenses
Unit sales =
to break even Unit contribution margin
= $360,000 ÷ $27 per unit
= 13,333 units (rounded)
In sales dollars: 13,333 units × $60 per unit = $800,000 (rounded)
Exercise 5-17 (20 minutes)
Total
Per Unit
1.
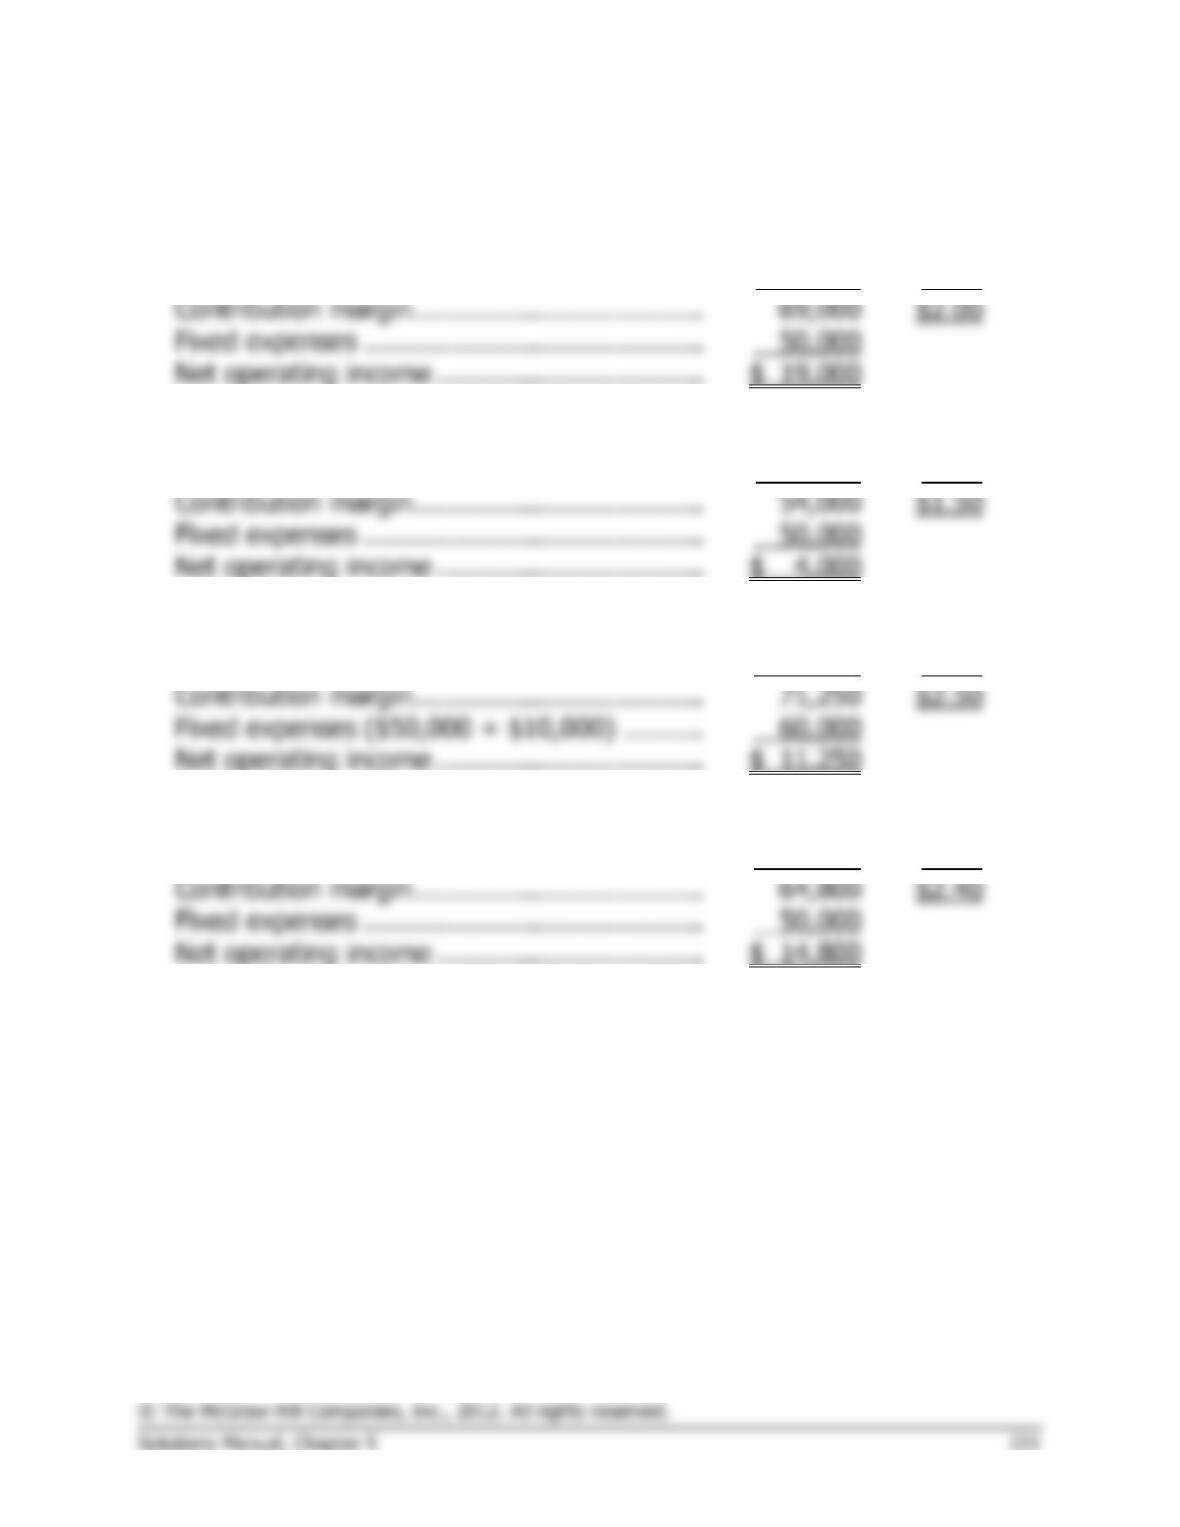
Sales (30,000 units × 1.15 = 34,500 units) ..
$172,500
$5.00
Variable expenses ………………………………..
103,500
3.00
Contribution margin ………………………………
Fixed expenses ……………………………………
50,000
Net operating income …………………………...
2.
Sales (30,000 units × 1.20 = 36,000 units) ..
$162,000
$4.50
Variable expenses ………………………………..
108,000
3.00
Contribution margin ………………………………
Fixed expenses ……………………………………
50,000
Net operating income …………………………...
3.
Sales (30,000 units × 0.95 = 28,500 units) ..
$156,750
$5.50
Variable expenses ………………………………..
85,500
3.00
Contribution margin ………………………………
Fixed expenses ($50,000 + $10,000) ……….
60,000
Net operating income …………………………...
4.
Sales (30,000 units × 0.90 = 27,000 units) ..
$151,200
$5.60
Variable expenses ………………………………..
86,400
3.20
Contribution margin ………………………………
Fixed expenses ……………………………………
50,000
Net operating income …………………………...
Exercise 5-18 (20 minutes)
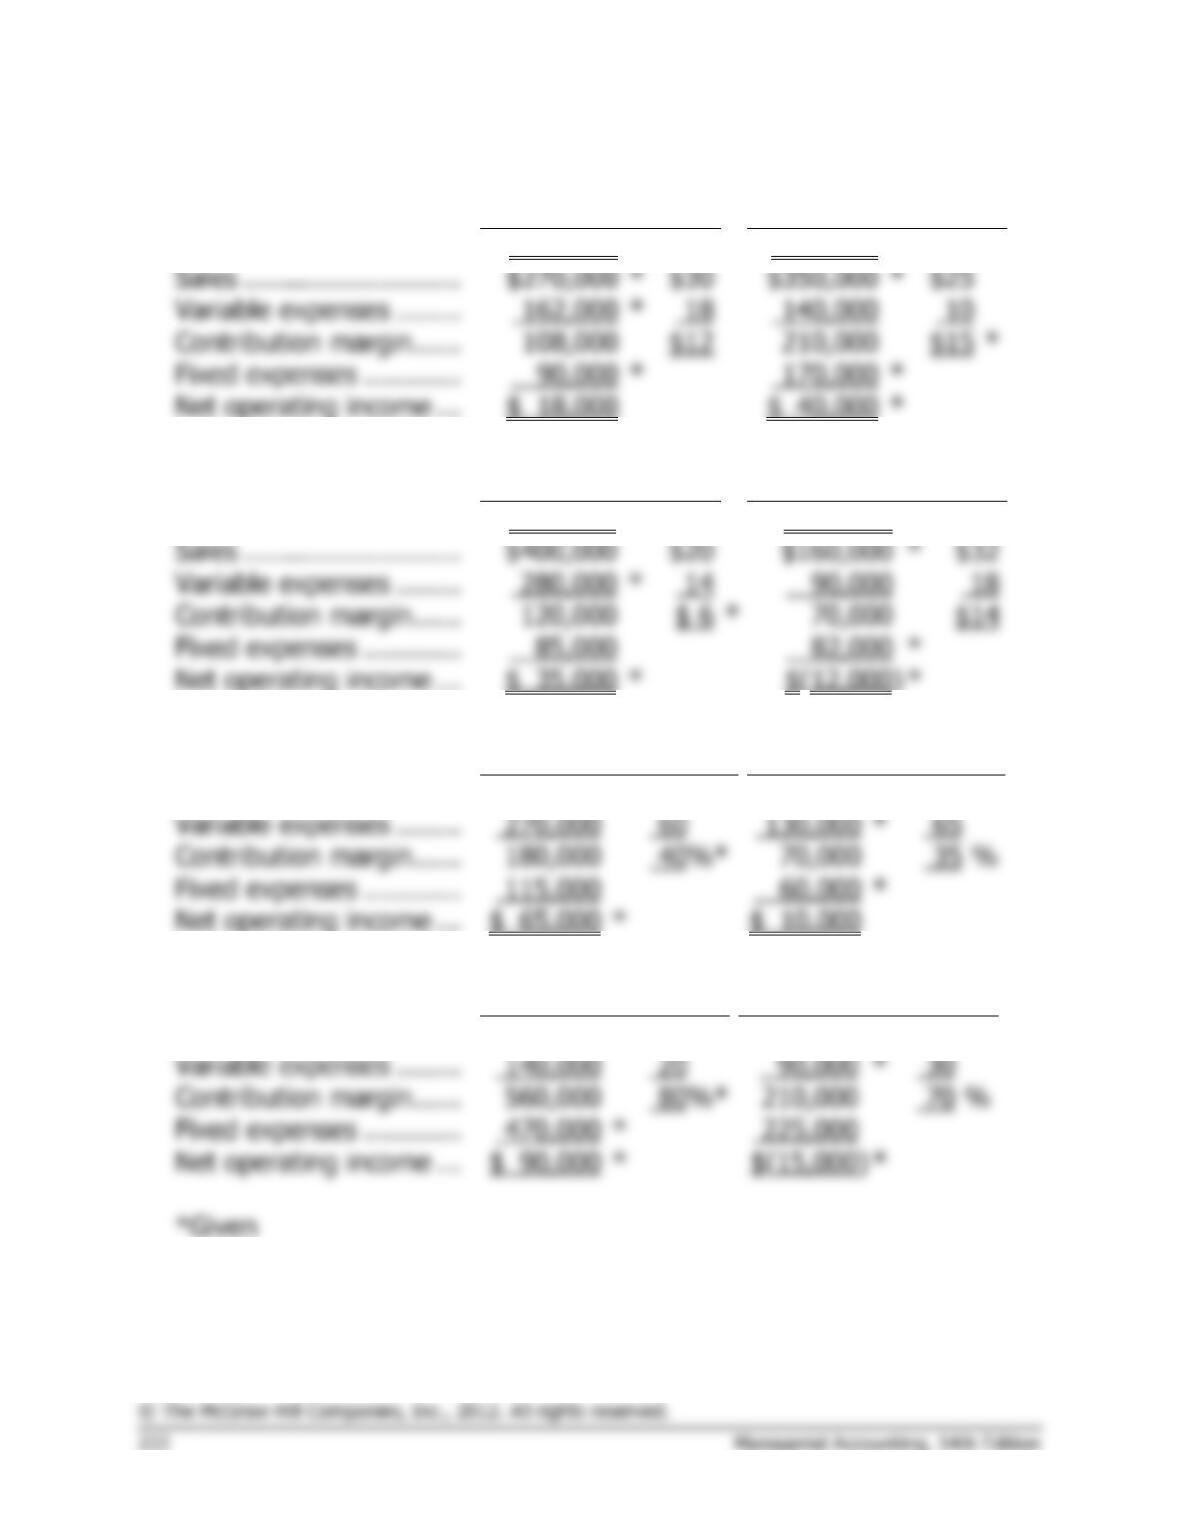
a.
Case #1
Case #2
Number of units sold ….
9,000
*
14,000
Sales ………………………
*
*
Variable expenses ……..
*
Contribution margin ……
*
Fixed expenses …………
*
*
Net operating income …
*
Case #3
Case #4
Number of units sold ….
20,000
*
5,000
*
Sales ………………………
*
Variable expenses ……..
*
Contribution margin ……
*
Fixed expenses …………
*
Net operating income …
*
*
b.
Case #1
Case #2
Sales ………………………
$450,000
*
100
%
$200,000
*
100
%
Variable expenses ……..
130,000
*
Contribution margin ……
180,000
Fixed expenses …………
*
Net operating income …
$ 65,000
*
Case #3
Case #4
Sales ………………………
$700,000
100
%
$300,000
*
100
%
Variable expenses ……..
*
Contribution margin ……
%
Fixed expenses …………
*
Net operating income …
*
*
*Given
Problem 5-19 (60 minutes)
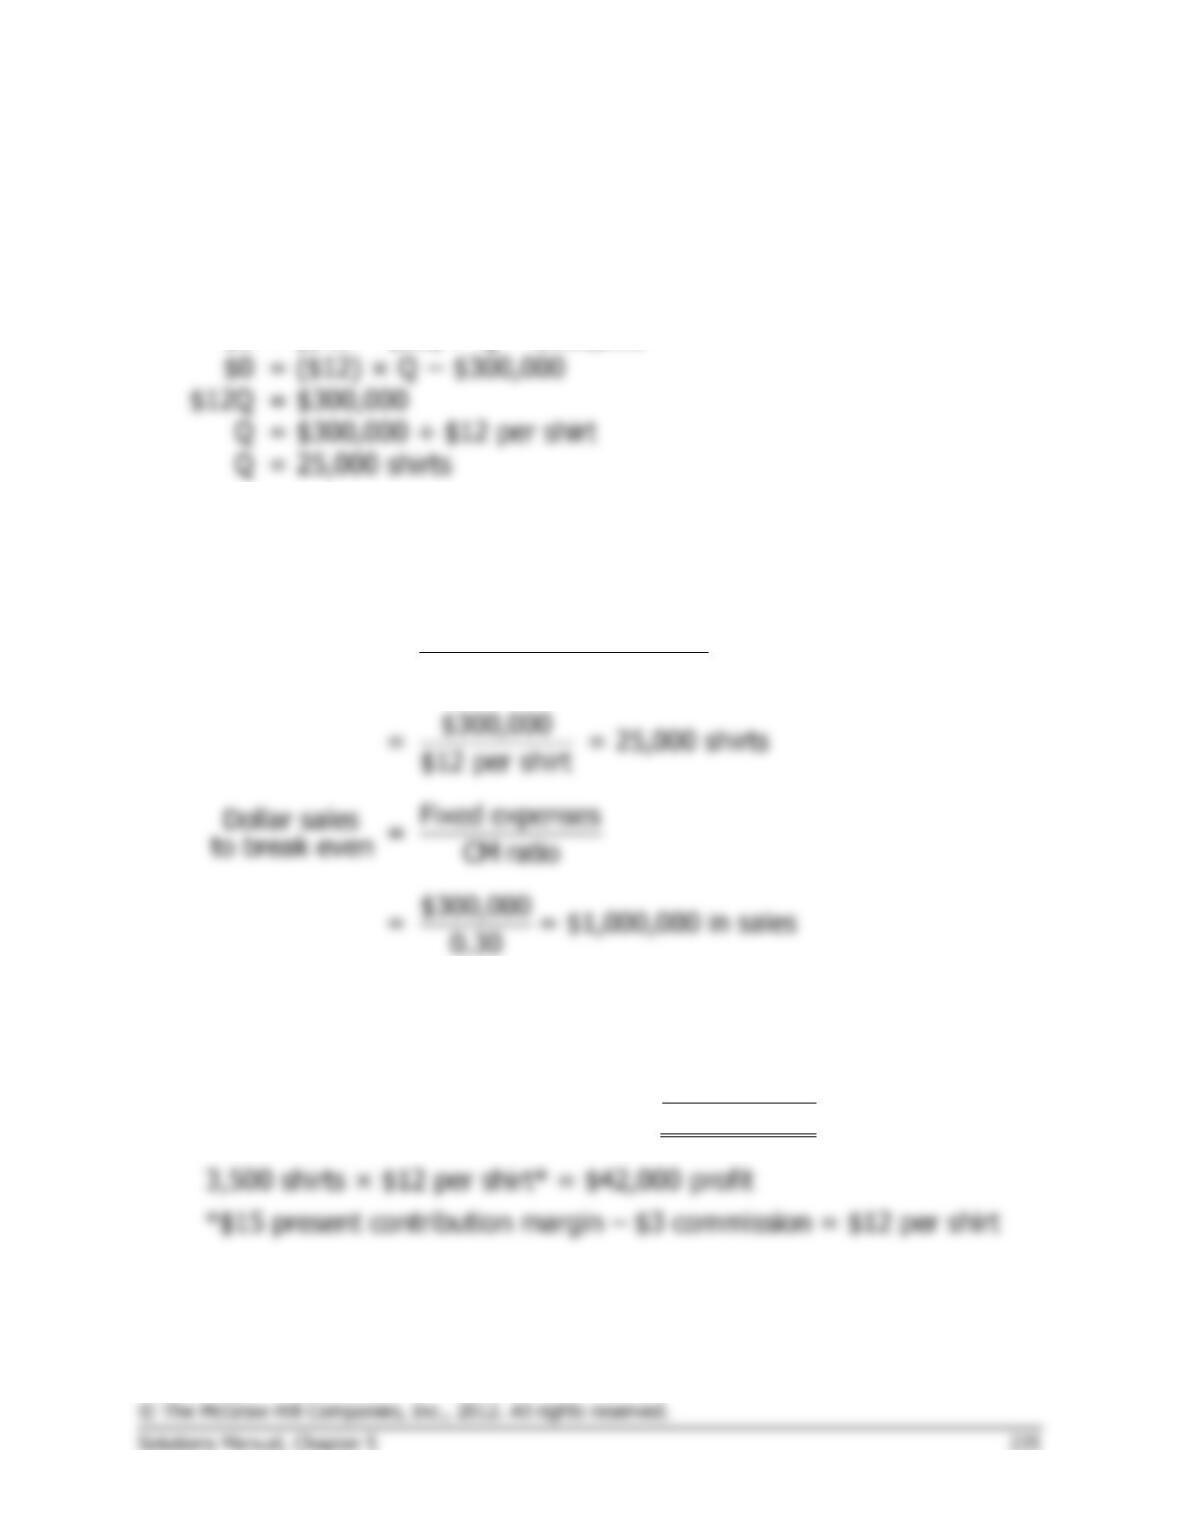
1.
Profit
=
Unit CM × Q − Fixed expenses
$0
=
($40 − $25) × Q − $300,000
$0
=
($15) × Q − $300,000
$15Q
=
$300,000
Q
=
$300,000 ÷ $15 per shirt
Q
=
20,000 shirts
20,000 shirts × $40 per shirt = $800,000
2. See the graph on the following page.
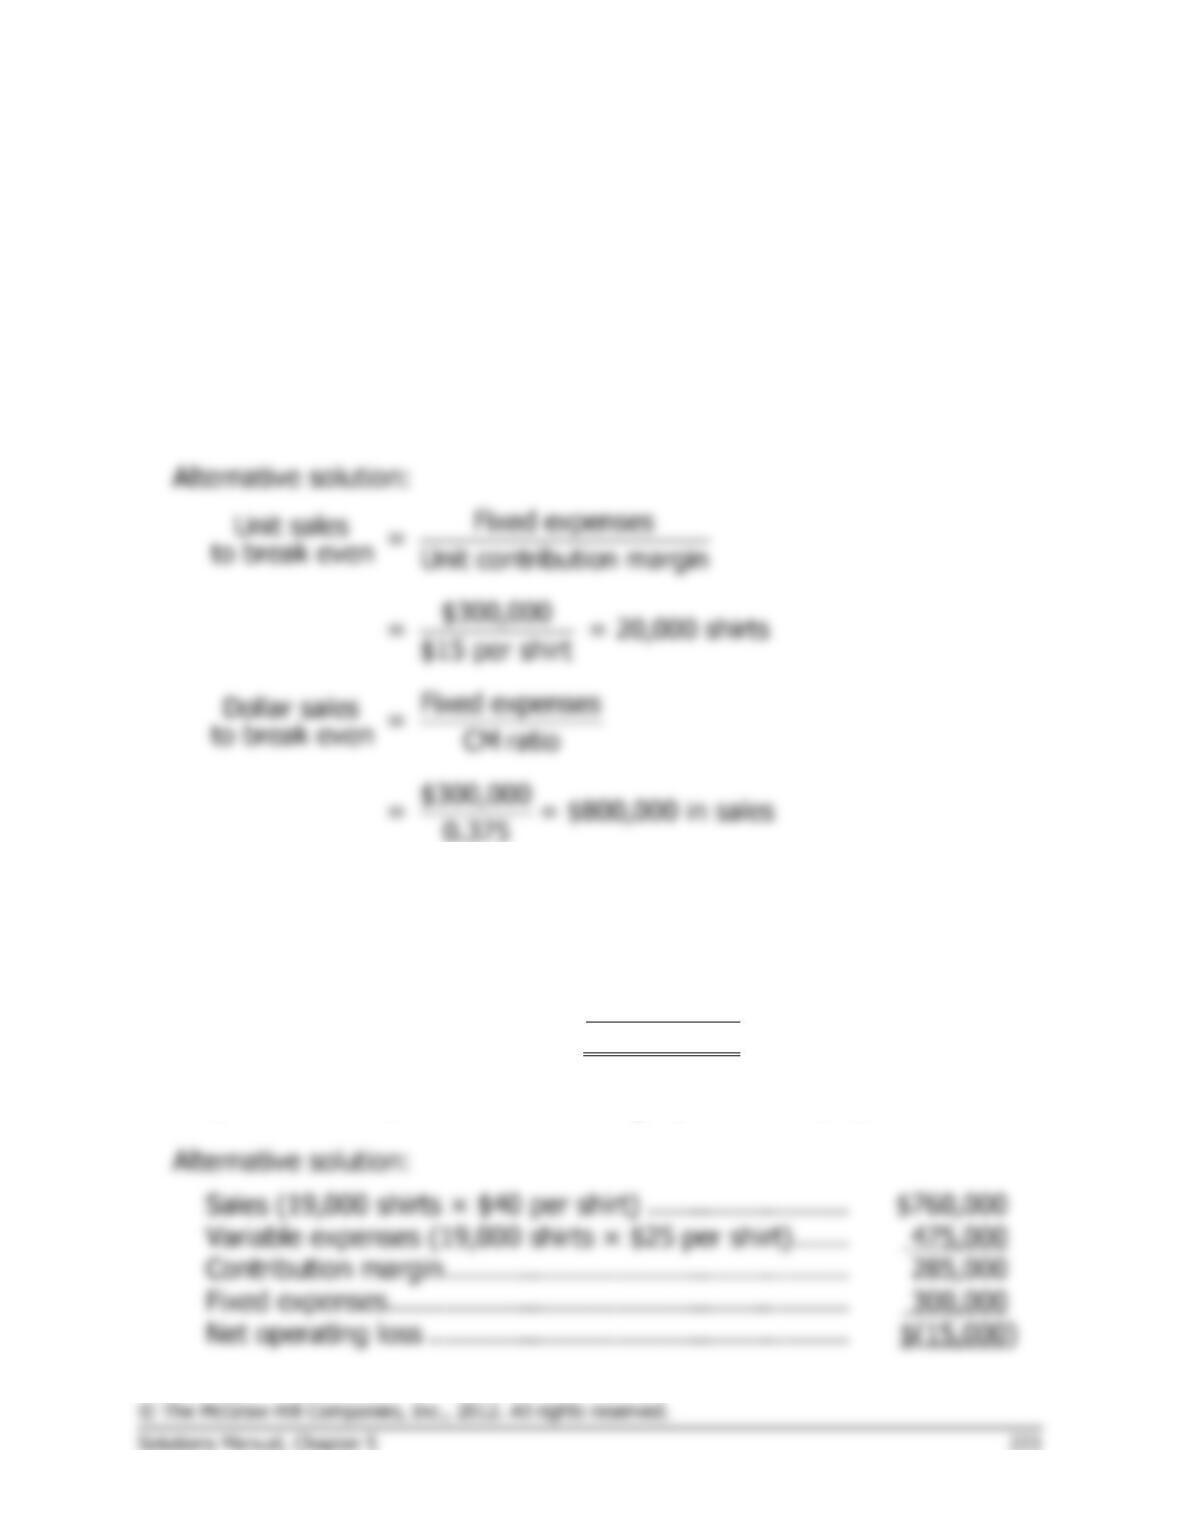
3. The simplest approach is:
Break-even sales ……………..
20,000 shirts
Actual sales …………………….
19,000 shirts
Sales short of break-even ….
1,000 shirts
1,000 shirts × $15 contribution margin per shirt = $15,000 loss
Sales (19,000 shirts × $40 per shirt) …………………….
Variable expenses (19,000 shirts × $25 per shirt) …….
Contribution margin …………………………………………..
Fixed expenses …………………………………………………
Problem 5-19 (continued)
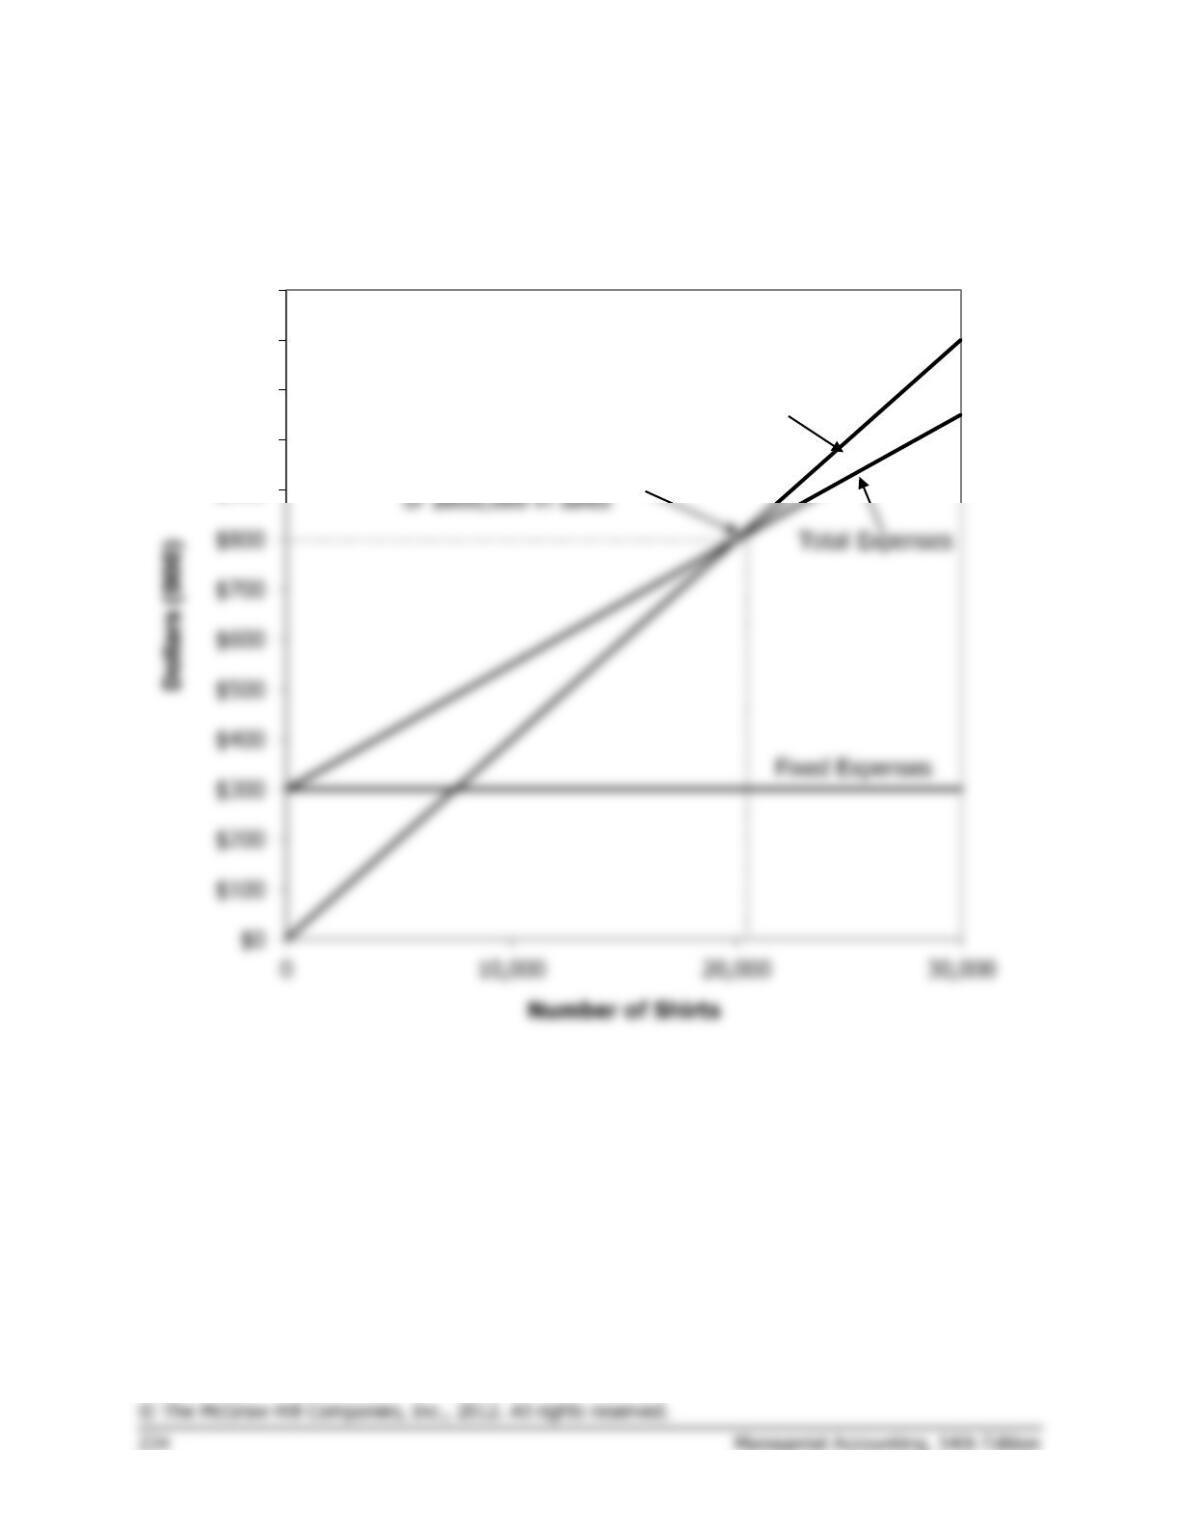
2. Cost-volume-profit graph:
Fixed Expenses
Total Expenses
$900
$1,000
$1,100
$1,200
$1,300
Break-even point: 20,000 shirts,
Total Sales
Problem 5-19 (continued)
4. The variable expenses will now be $28 ($25 + $3) per shirt, and the
contribution margin will be $12 ($40 – $28) per shirt.
Profit
=
Unit CM × Q − Fixed expenses
$0
=
($40 − $28) × Q − $300,000
$0
=
($12) × Q − $300,000
=
$300,000
25,000 shirts × $40 per shirt = $1,000,000 in sales
Alternative solution:
Fixed expenses
Unit sales =
to break even Unit contribution margin
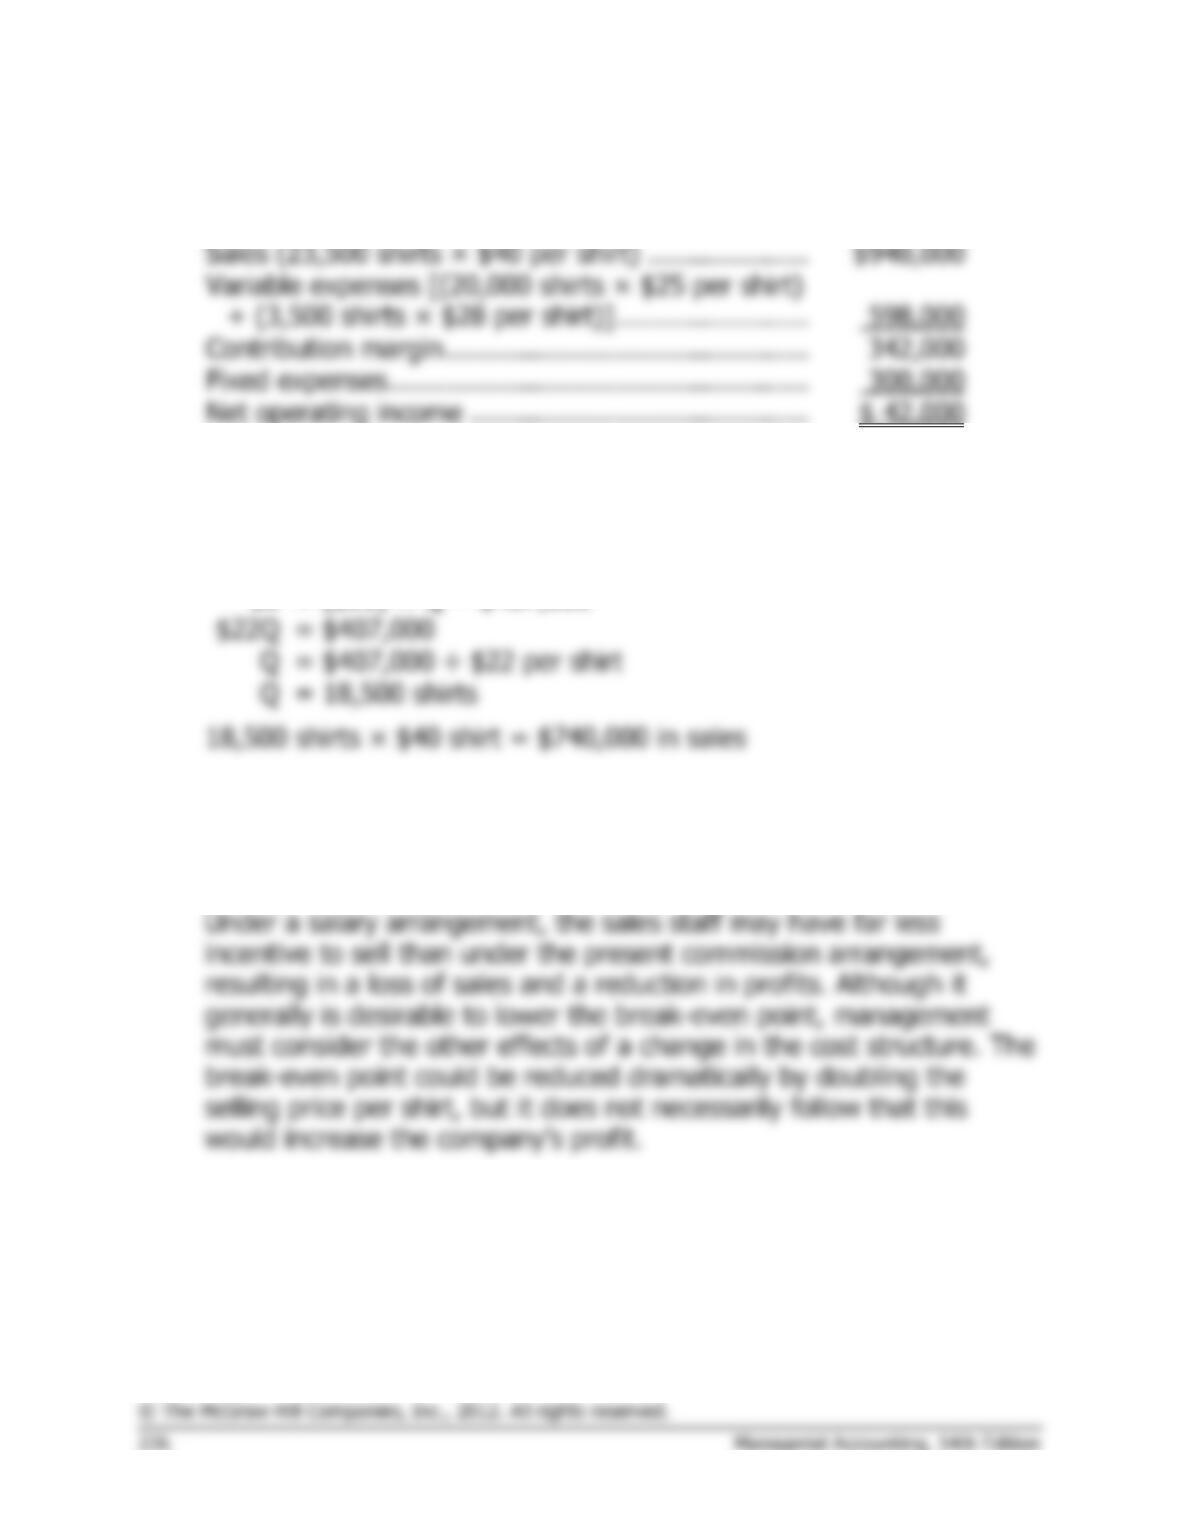
5. The simplest approach is:
Actual sales …………………………….
23,500 shirts
Break-even sales ……………………..
20,000 shirts
Excess over break-even sales ……..
3,500 shirts
Problem 5-19 (continued)
Alternative solution:
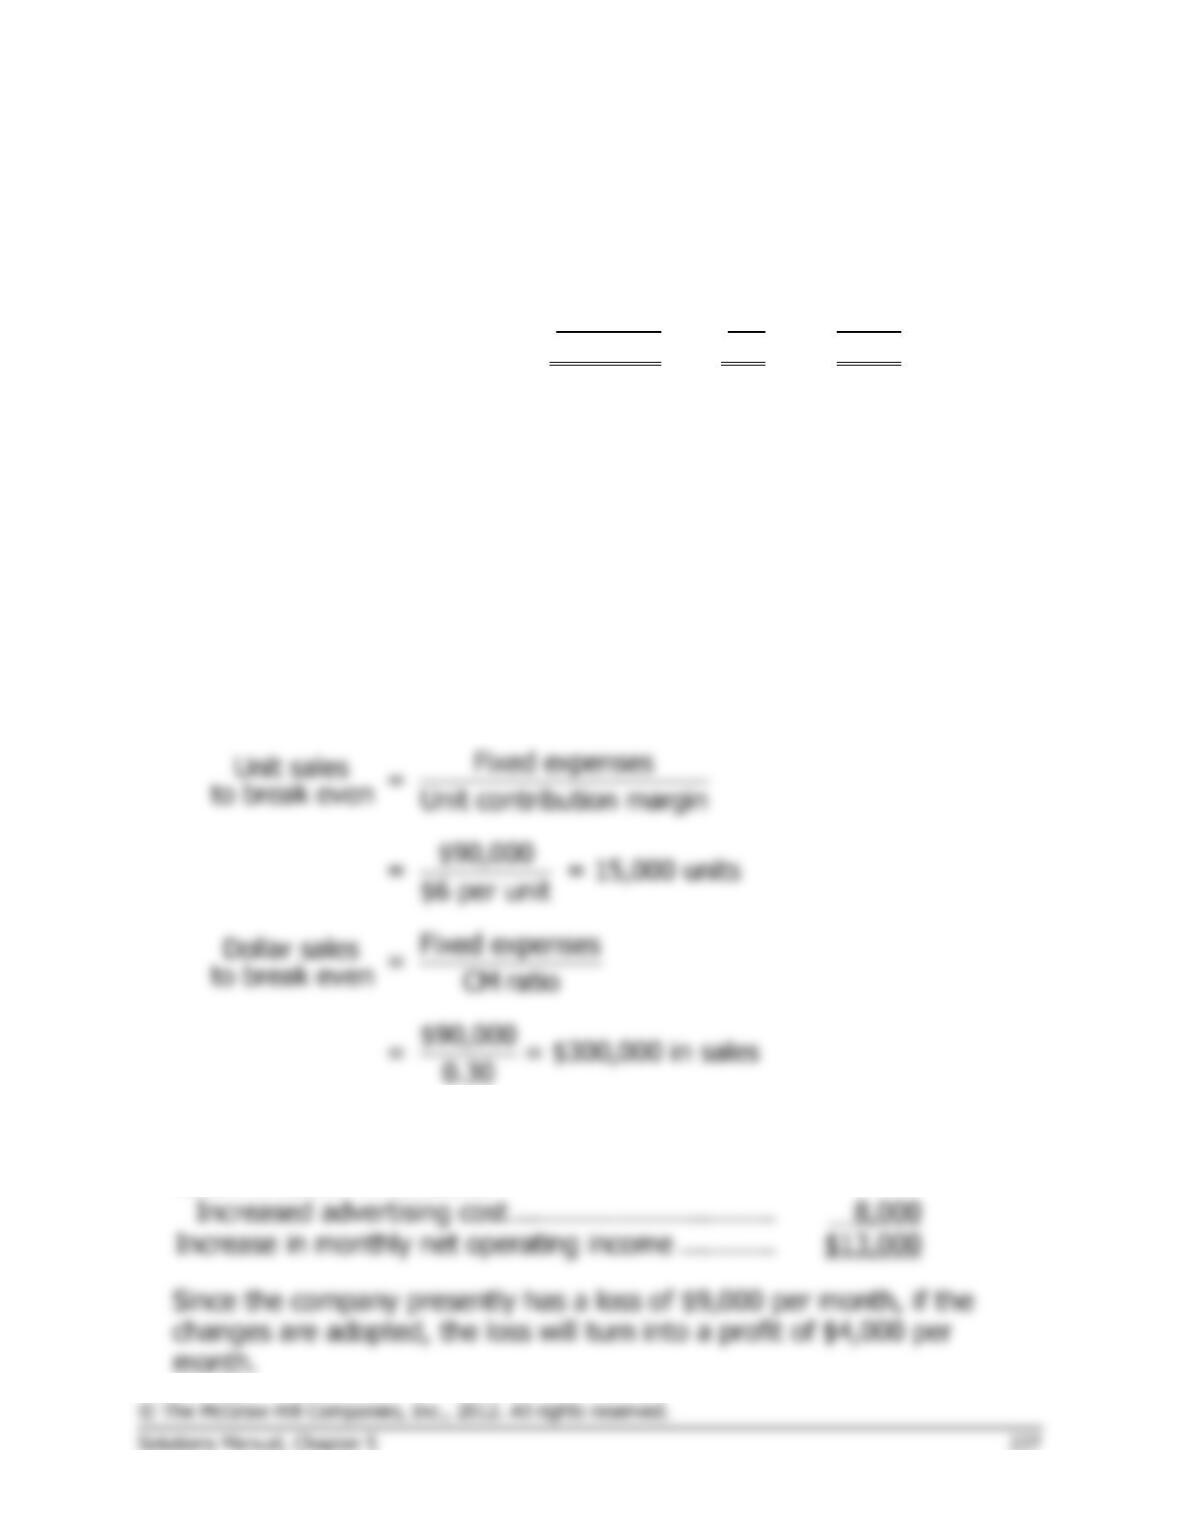
6. a. The new variable expense will be $18 per shirt (the invoice price).
Profit
=
Unit CM × Q − Fixed expenses
$0
=
($40 − $18) × Q − $407,000
$0
=
($22) × Q − $407,000
=
=
=
b. Although the change will lower the break-even point from 20,000
shirts to 18,500 shirts, the company must consider whether this
reduction in the break-even point is more than offset by the possible
loss in sales arising from having the sales staff on a salaried basis.
Problem 5-20 (60 minutes)
1. The CM ratio is 30%.
Total
Per Unit
Percentage
Sales (13,500 units) ………
$270,000
$20
100%
Variable expenses …………
189,000
14
70%
Contribution margin ………
$ 81,000
$ 6
30%
The break-even point is:
Profit
=
Unit CM × Q − Fixed expenses
$0
=
($20 − $14) × Q − $90,000
$0
=
($6) × Q − $90,000
$6Q
=
$90,000
Q
=
$90,000 ÷ $6 per unit
Q
=
15,000 units
15,000 units × $20 per unit = $300,000 in sales
Alternative solution:
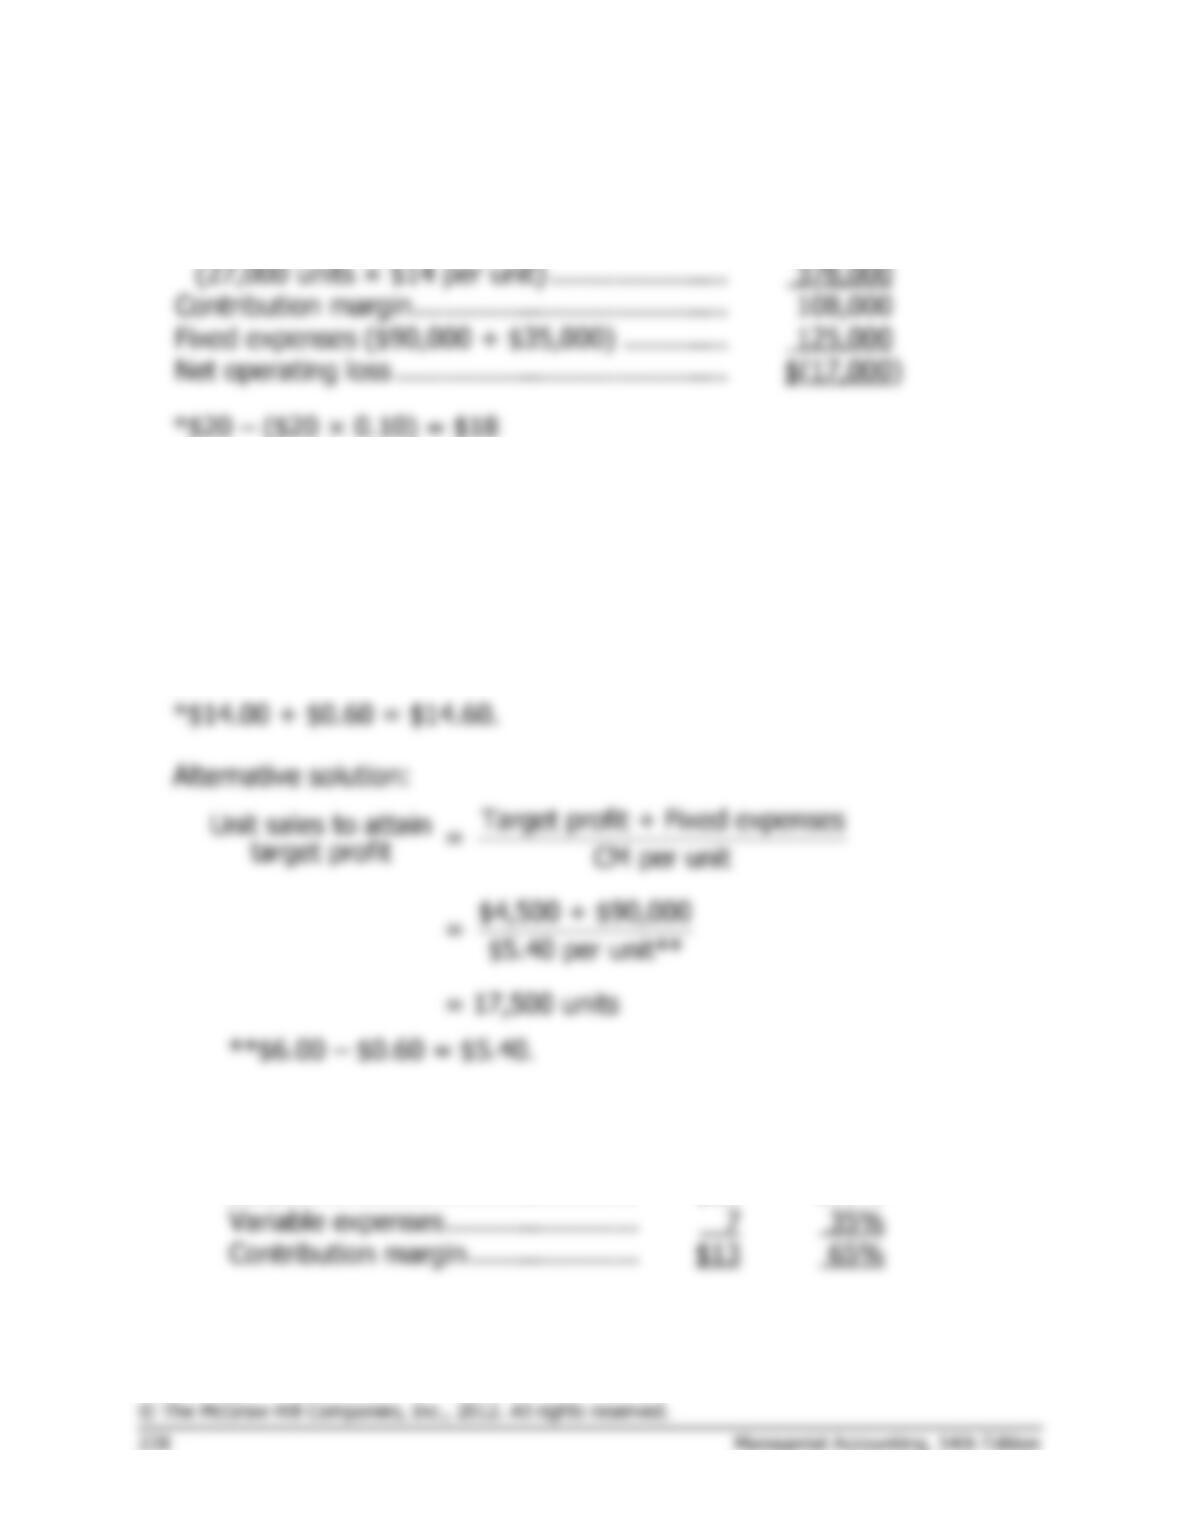
2.
Incremental contribution margin:
$70,000 increased sales × 30% CM ratio ………..
$21,000
Less increased fixed costs:
Increased advertising cost …………………………...
Increase in monthly net operating income …………
Problem 5-20 (continued)
3.
Sales (27,000 units × $18 per unit*) …………..
$486,000
Contribution margin …………………………………
Fixed expenses ($90,000 + $35,000) ………….
Net operating loss …………………………………..
Variable expenses
4.
Profit
=
Unit CM × Q − Fixed expenses
$4,500
=
($20.00 − $14.60*) × Q − $90,000
$4,500
=
($5.40) × Q − $90,000
$5.40Q
=
$94,500
Q
=
$94,500 ÷ $5.40 per unit
Q
=
17,500 units
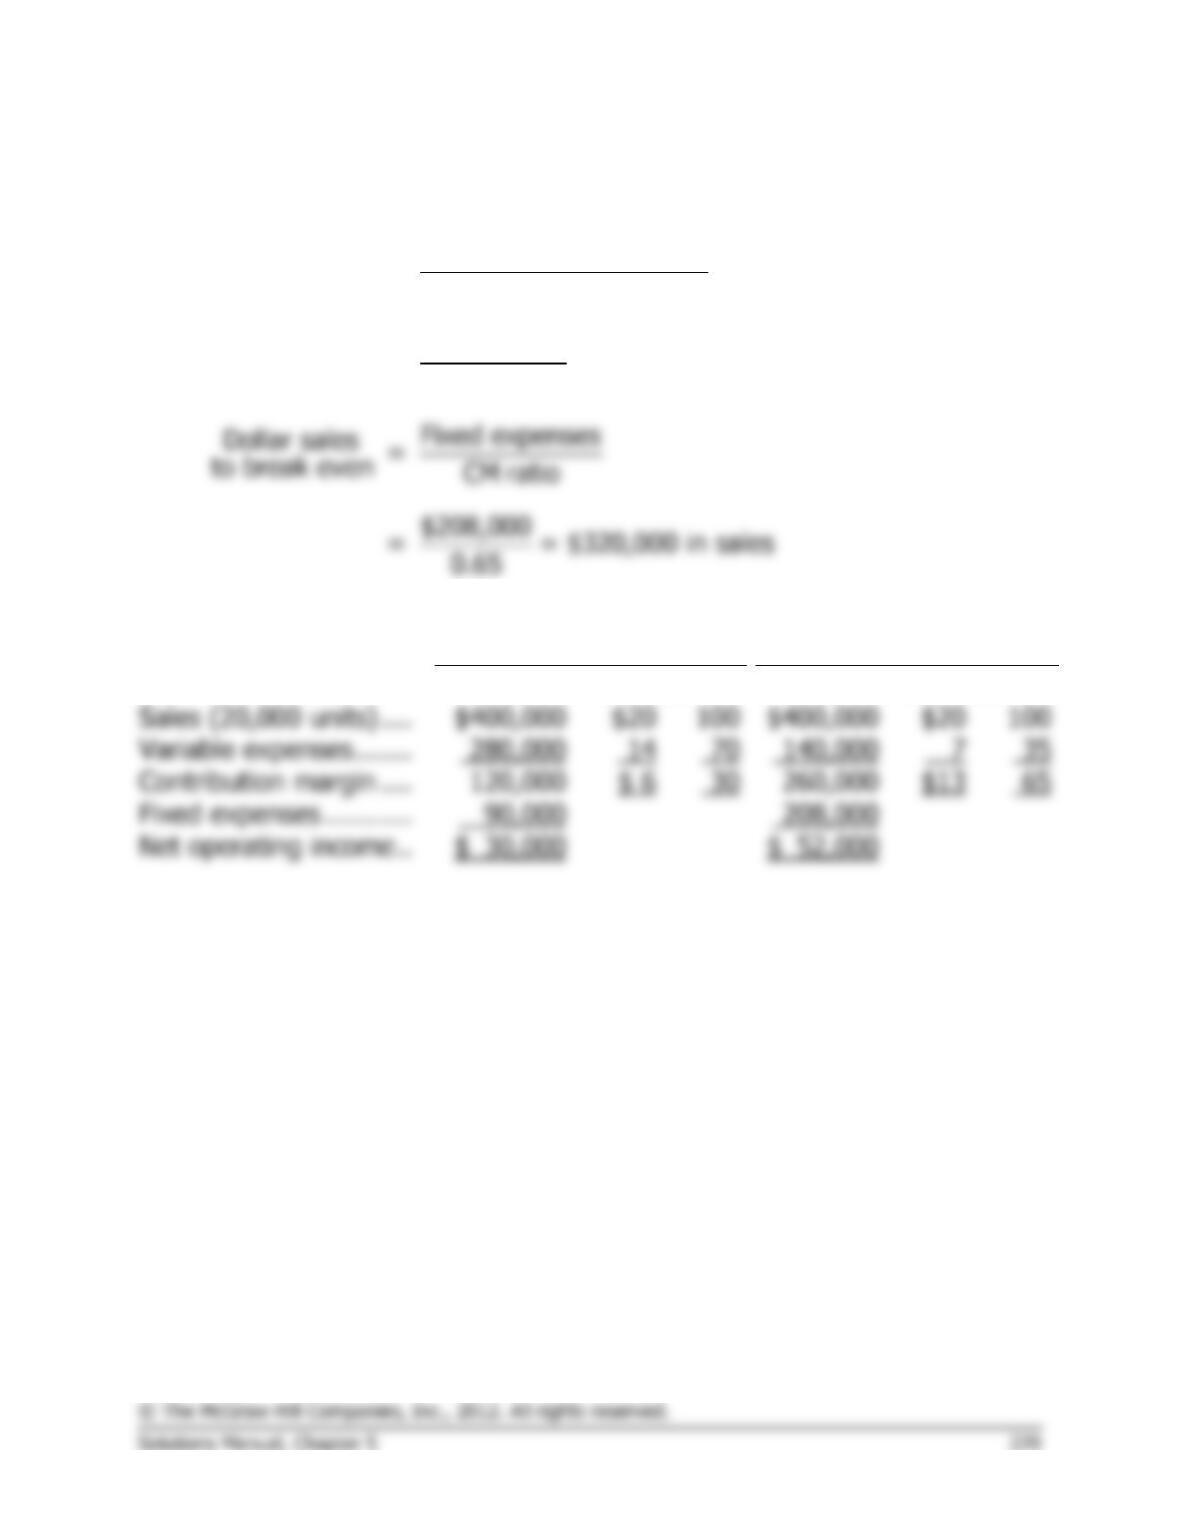
5. a. The new CM ratio would be:
Per Unit
Percentage
Sales …………………………………….
$20
100%
Variable expenses ……………………
Contribution margin …………………
Problem 5-20 (continued)
The new break-even point would be:
Fixed expenses
Unit sales =
to break even Unit contribution margin
$208,000
= = 16,000 units
$13 per unit
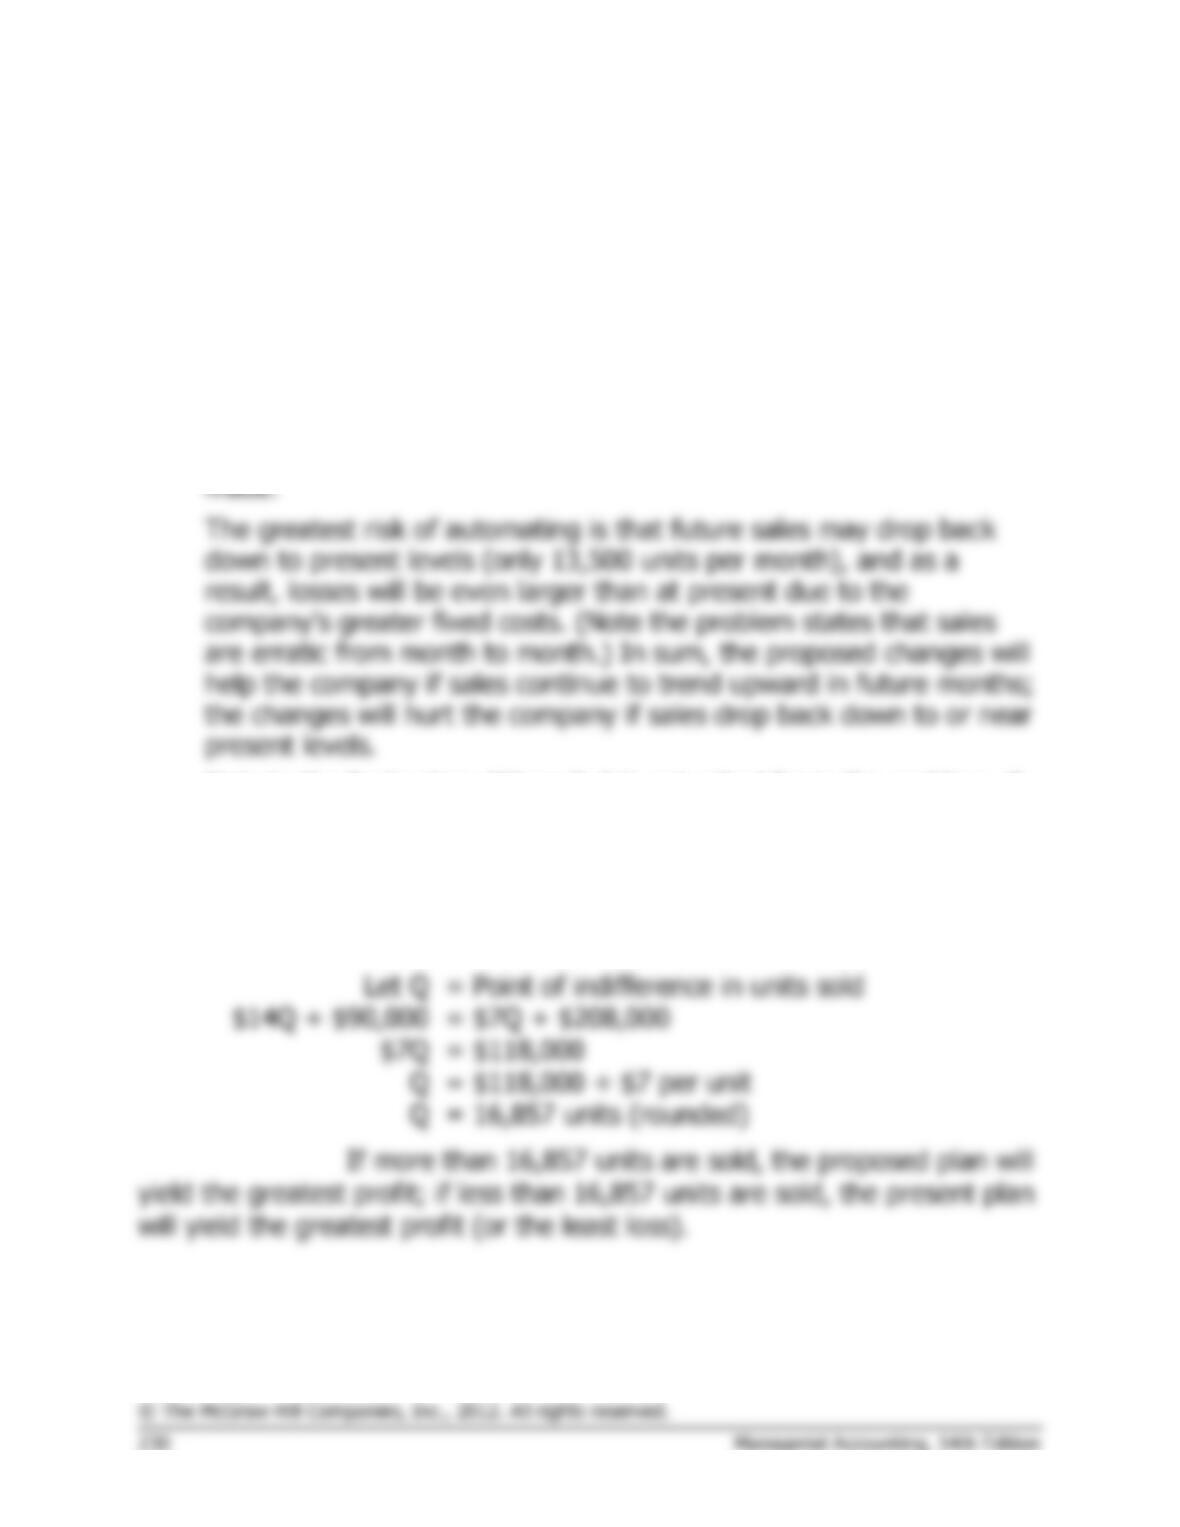
b. Comparative income statements follow:
Not Automated
Automated
Total
Per Unit
%
Total
Per Unit
%
Sales (20,000 units) ….
Fixed expenses ………..
Net operating income ..
Problem 5-20 (continued)
c. Whether or not one would recommend that the company automate
its operations depends on how much risk he or she is willing to take,
and depends heavily on prospects for future sales. The proposed
changes would increase the company’s fixed costs and its break-even
point. However, the changes would also increase the company’s CM
ratio (from 30% to 65%). The higher CM ratio means that once the
break-even point is reached, profits will increase more rapidly than at
present. If 20,000 units are sold next month, for example, the higher
CM ratio will generate $22,000 more in profits than if no changes are
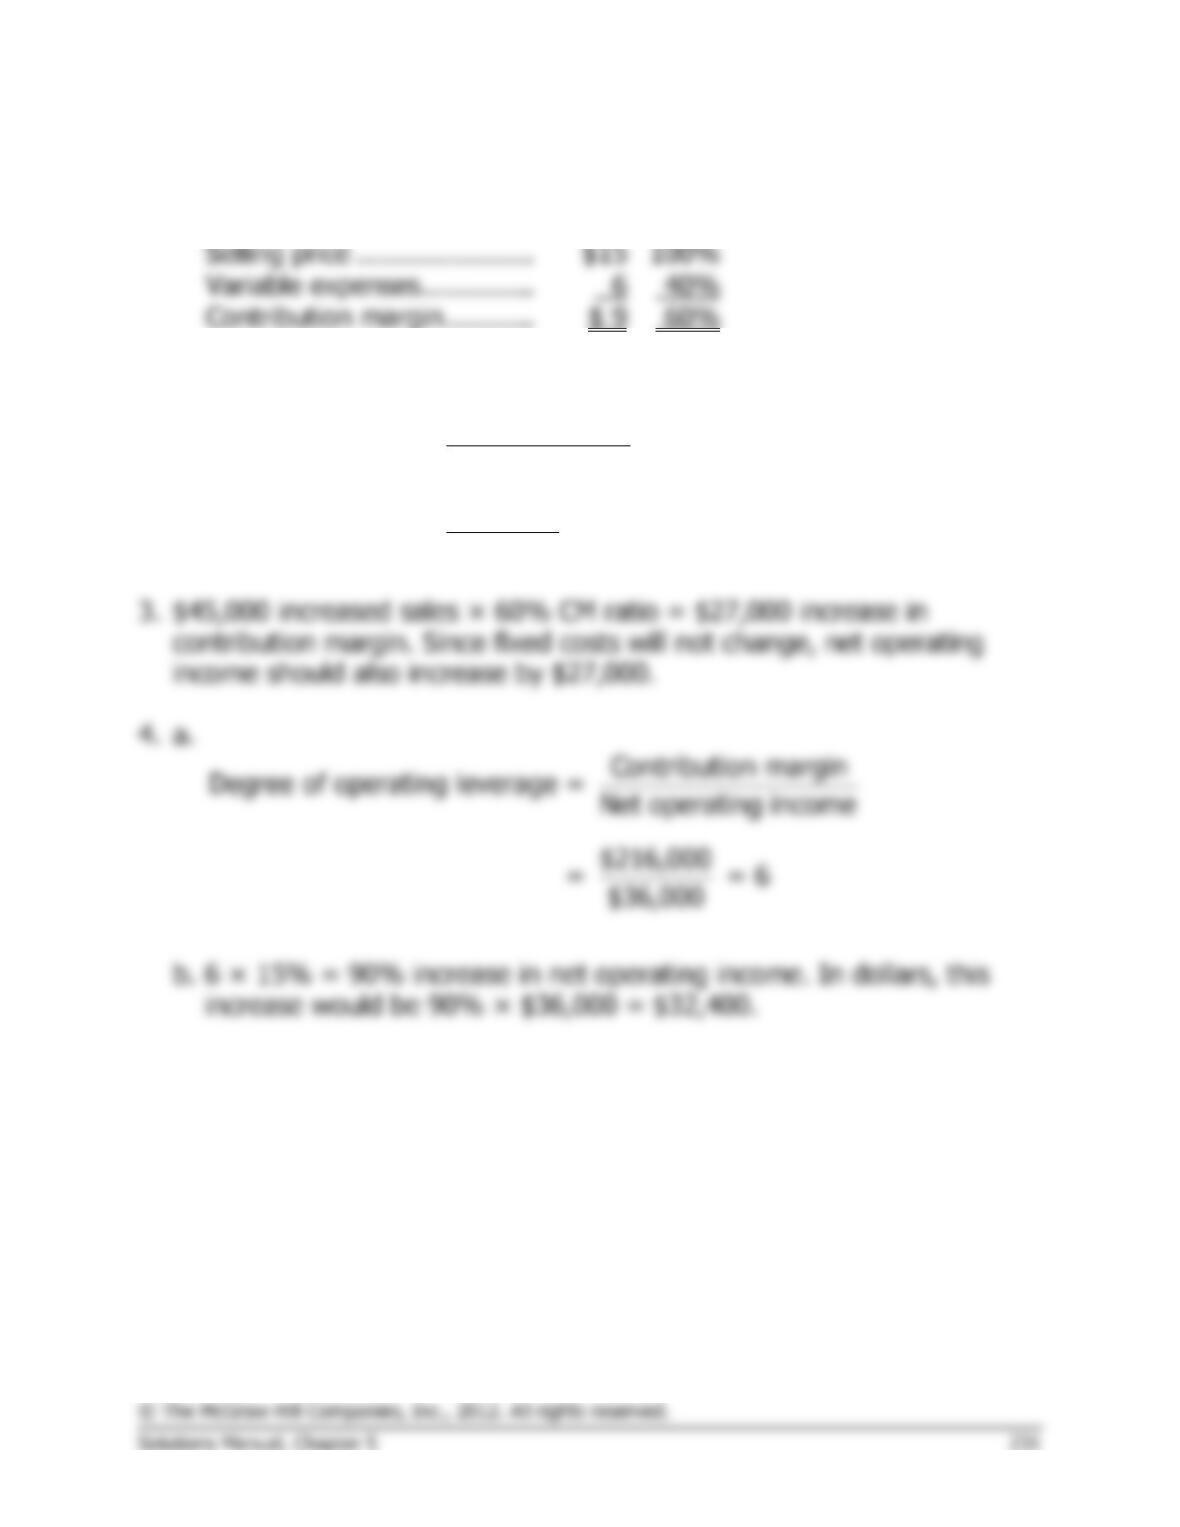
Note to the Instructor: Although it is not asked for in the problem, if
time permits you may want to compute the point of indifference
between the two alternatives in terms of units sold; i.e., the point
where profits will be the same under either alternative. At this point,
total revenue will be the same; hence, we include only costs in our
equation:
Problem 5-21 (60 minutes)
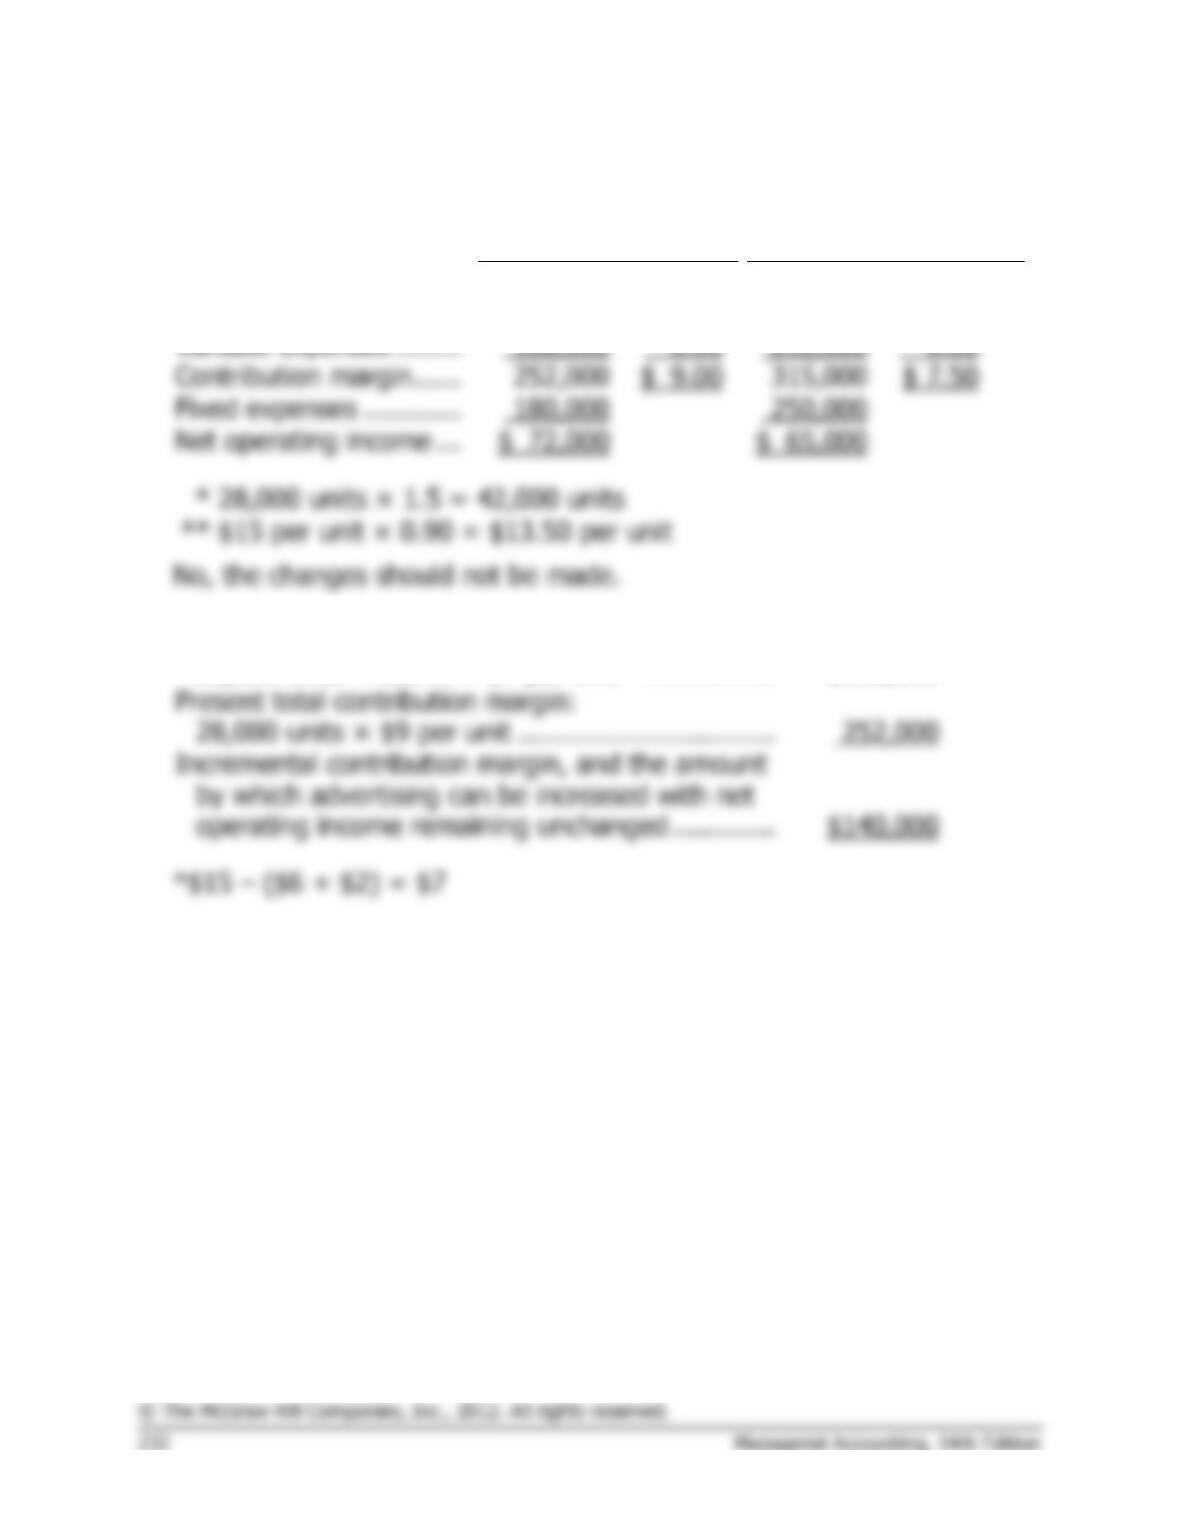
1. The CM ratio is 60%:
2.
Fixed expenses
Break-even point in=
total sales dollars CM ratio
$180,000
= =$300,000 sales
0.60
Problem 5-21 (continued)
5.
Last Year:
28,000 units
Proposed:
42,000 units*
Total
Per Unit
Total
Per Unit
Sales ………………………
$420,000
$15.00
$567,000
$13.50
**
Variable expenses ……..
Net operating income …
$ 72,000
$ 65,000
$15 per unit × 0.90 = $13.50 per unit
6.
Expected total contribution margin:
28,000 units × 200% × $7 per unit* ……………..
$392,000
$140,000