Problem 5-22 (30 minutes)
1.
Product
Sinks
Mirrors
Vanities
Total
Percentage of total
sales …………………….
32%
40%
28%
100%
Sales ………………………
$160,000
100
%
$200,000
100
%
$140,000
100
%
$500,000
100
%
Variable expenses ……..
48,000
%
%
%
%
Contribution margin ……
$112,000
%
%
%
Net operating income
(loss) ……………………
Problem 5-22 (continued)
2. Break-even sales:
0.43
3. Memo to the president:
Although the company met its sales budget of $500,000 for the month,
the mix of products sold changed substantially from that budgeted. This
is the reason the budgeted net operating income was not met, and the
reason the break-even sales were greater than budgeted. The
company’s sales mix was planned at 48% Sinks, 20% Mirrors, and 32%
Vanities. The actual sales mix was 32% Sinks, 40% Mirrors, and 28%
Vanities.
Problem 5-23 (45 minutes)
1.
a.
Alvaro
Bazan
Total
%
%
%
Sales ……………………..
€800
100
€480
100
€1,280
100
Variable expenses
480
60
96
20
576
45
Contribution margin ….
€320
40
€384
80
704
55
Fixed expenses ………..
660
Net operating income ..
€ 44
Problem 5-23 (continued)
2.
a.
Alvaro
Bazan
Cano
Total
%
%
%
%
Sales …………………………
€800
100
€480
100
€320
100
€1,600
100
Variable expenses ………..
480
60
96
20
240
75
816
51
Contribution margin ……..
40
80
25
49
Fixed expenses ……………
Net operating income ……
Problem 5-23 (continued)
b.
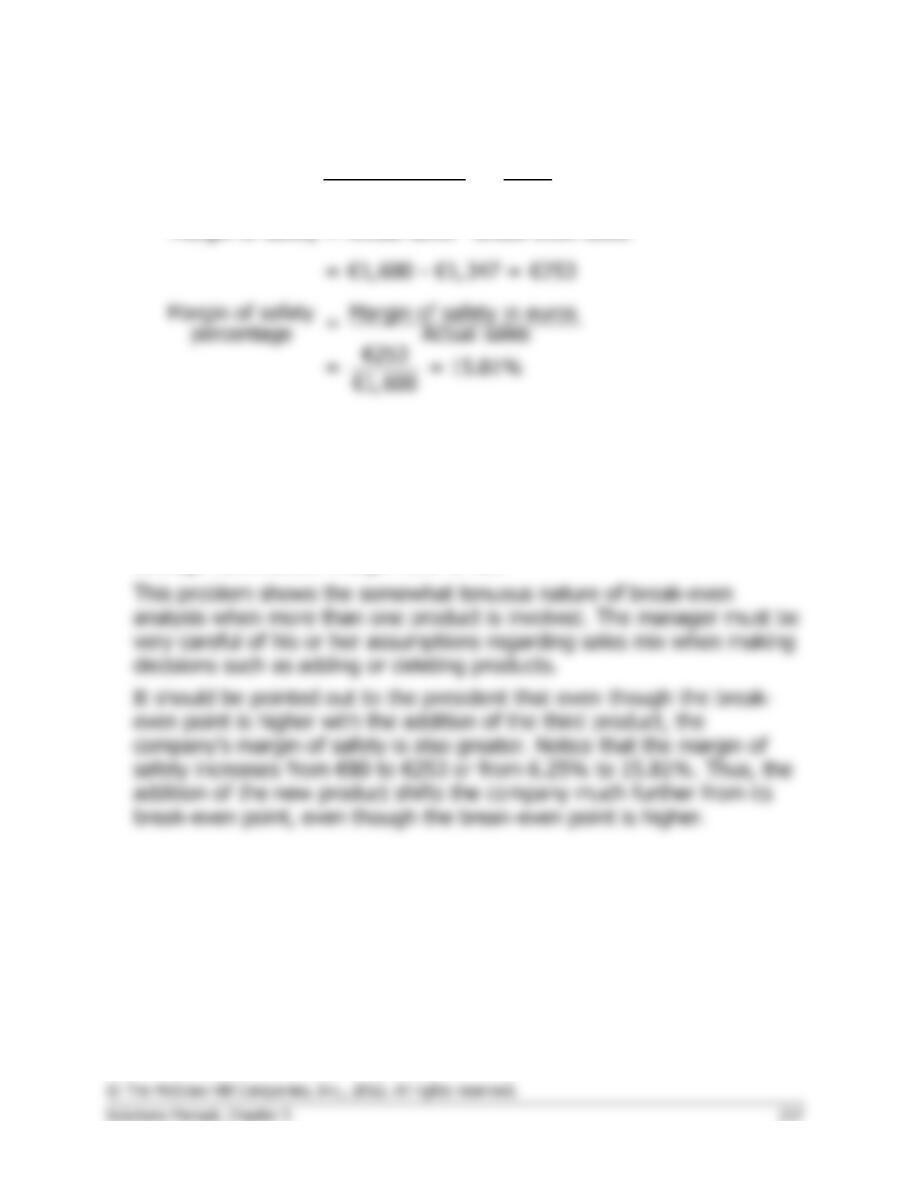
Fixed expenses €660
Euro sales to = = = €1,347(rounded)
break even CM ratio 0.49
Margin of safety = Actual sales – Break-even sales
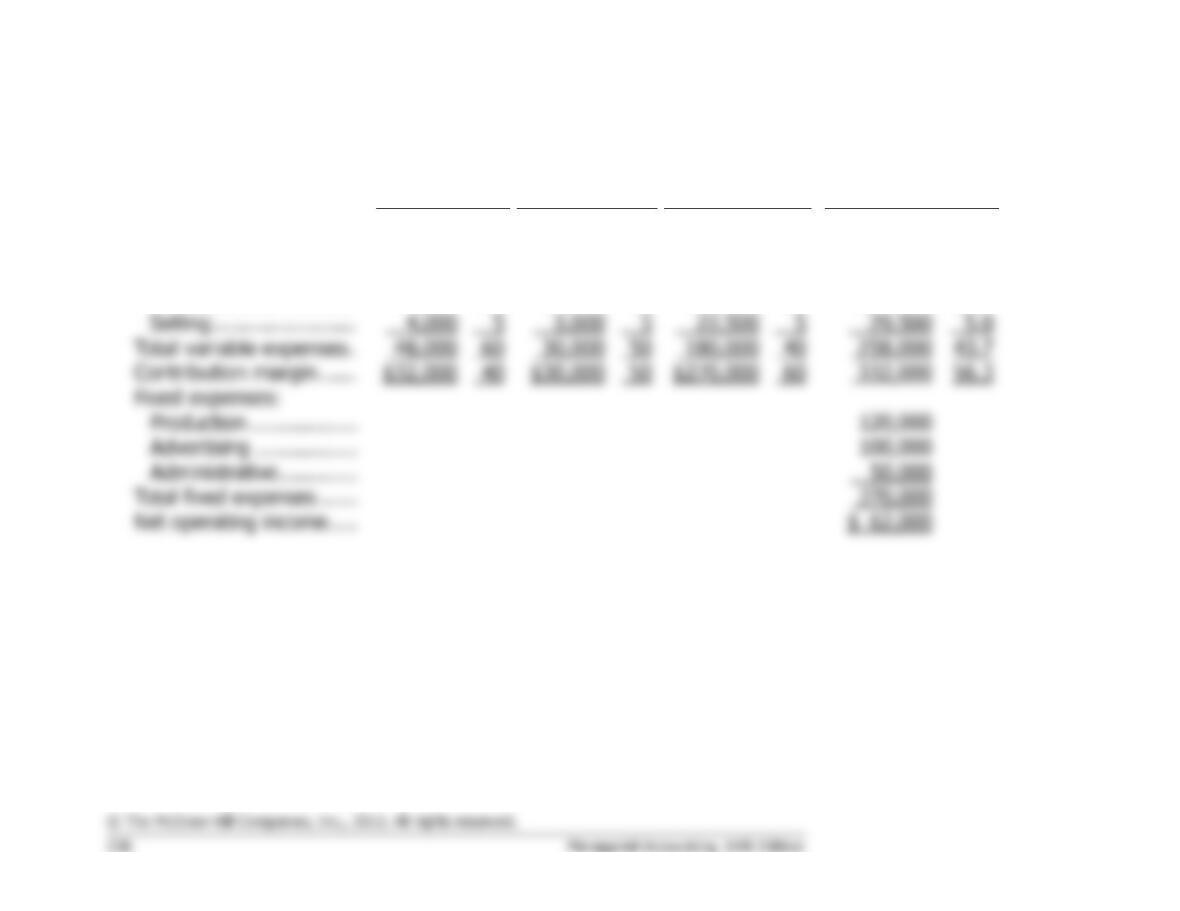
3. The reason for the increase in the break-even point can be traced to the
decrease in the company’s average contribution margin ratio when the
third product is added. Note from the income statements above that this
ratio drops from 55% to 49% with the addition of the third product.
This product, called Cano, has a CM ratio of only 25%, which causes the
average contribution margin ratio to fall.
Problem 5-24 (60 minutes)
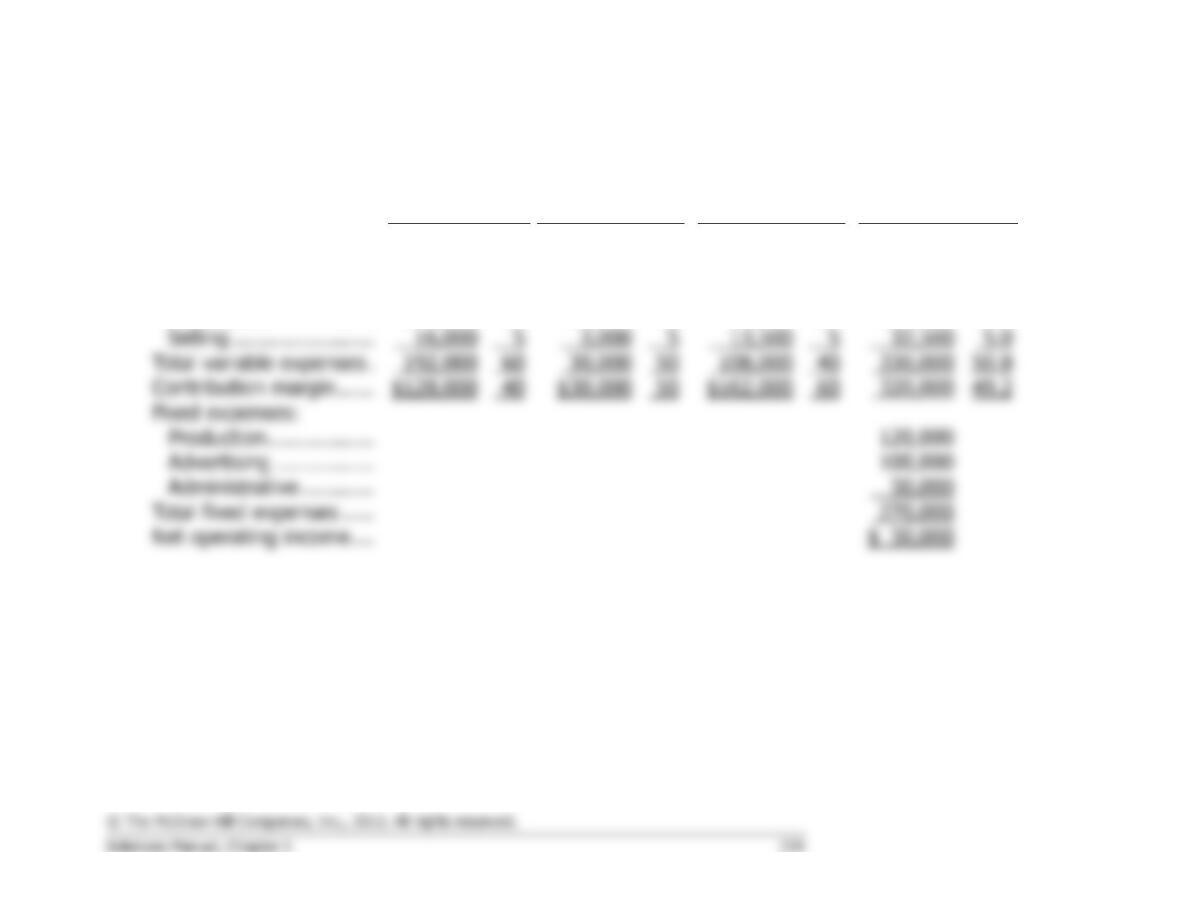
1. April’s Income Statement:
Standard
Deluxe
Pro
Total
Amount
%
Amount
%
Amount
%
Amount
%
Sales ………………………
$80,000
100
$60,000
100
$450,000
100
$590,000
100
Variable expenses:
Production ……………..
44,000
55
27,000
45
157,500
35
228,500
38.7
Selling …………………..
3,000
Total variable expenses .
30,000
43.7
Contribution margin ……
$32,000
$30,000
$270,000
56.3
Fixed expenses:
Production ………………
Advertising ……………..
Total fixed expenses ……
270,000
Net operating income …..
Problem 5-24 (continued)
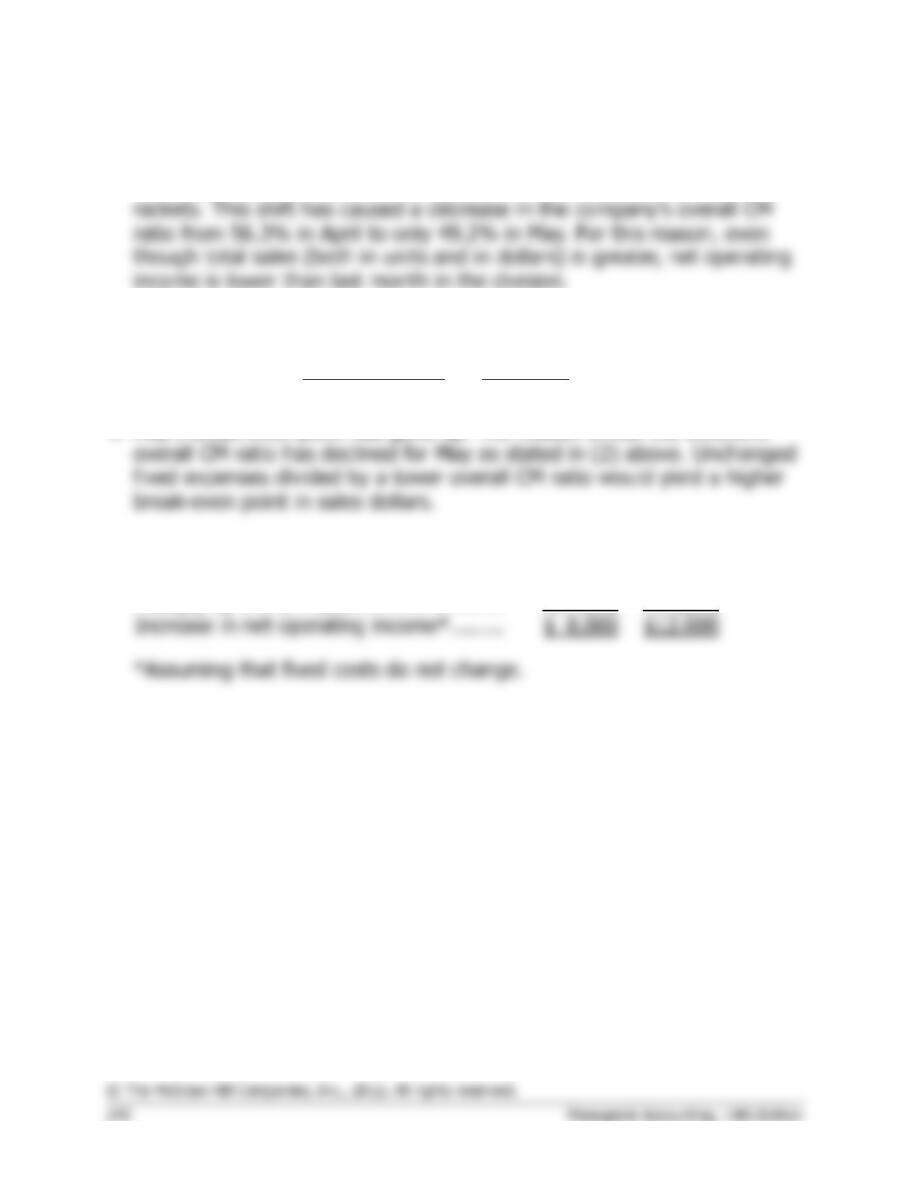
May’s Income Statement:
Standard
Deluxe
Pro
Total
Amount
%
Amount
%
Amount
%
Amount
%
Sales ……………………….
$320,000
100
$60,000
100
$270,000
100
$650,000
100.0
Variable expenses:
Production ……………..
176,000
55
27,000
45
94,500
35
297,500
45.8
Contribution margin ……
$128,000
$30,000
$162,000
49.2
Fixed expenses:
Production ……………..
120,000
Advertising …………….
100,000
Net operating income ….
$ 50,000
Problem 5-24 (continued)
2. The sales mix has shifted over the last month from a greater
concentration of Pro rackets to a greater concentration of Standard
3. The break-even in dollar sales can be computed as follows:
Fixed expenses $270,000
Dollar sales to = = = $479,574 (rounded)
break even CM ratio 0.563
4. May’s break-even point has gone up. The reason is that the division’s
5.
Standard
Pro
Increase in sales …………………………….
$20,000
$20,000
Multiply by the CM ratio ……………………
× 40%
× 60%
Increase in net operating income* ………
$ 8,000
$12,000
Problem 5-25 (45 minutes)
1.
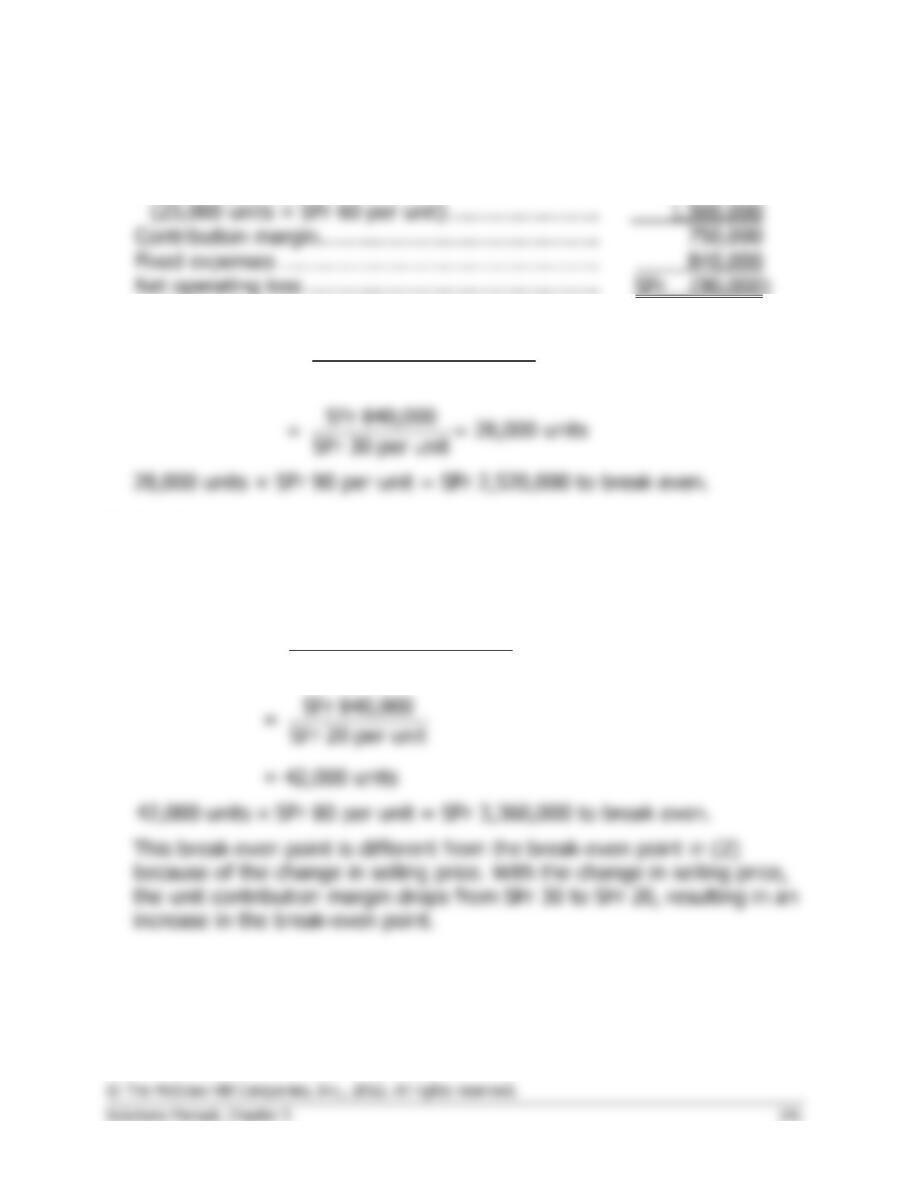
Sales (25,000 units × SFr 90 per unit) ………………
SFr 2,250,000
Net operating loss ………………………………………..
SFr (90,000)
Variable expenses
2.
Fixed expenses
Unit sales =
to break even Unit contribution margin
3. See the next page.
4. At a selling price of SFr 80 per unit, the contribution margin is SFr 20
per unit. Therefore:
Fixed expenses
Unit sales =
to break even Unit contribution margin
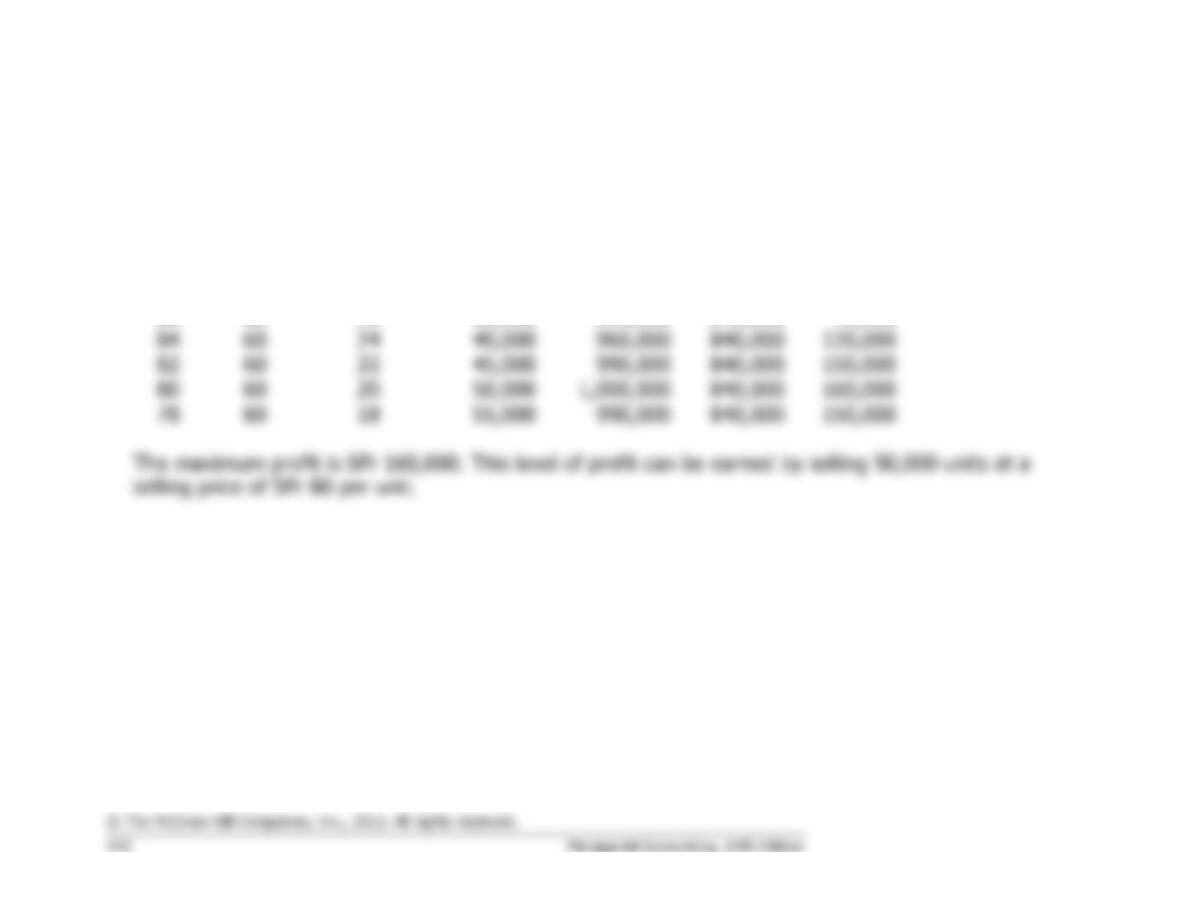
Problem 5-25 (continued)
3.
Unit
Selling
Price
Unit
Variable
Expense
Unit
Contribution
Margin
Volume
Total
Contribution
Margin
Fixed
Expenses
Net
Operating
Income
(SFrs)
(SFrs)
(SFrs)
(Units)
(SFrs)
(SFrs)
(SFrs)
90
60
30
25,000
750,000
840,000
(90,000)
88
60
28
30,000
840,000
840,000
0
86
60
26
35,000
910,000
840,000
70,000
84
60
24
40,000
960,000
840,000
78
60
18
55,000
990,000
840,000
Problem 5-26 (60 minutes)
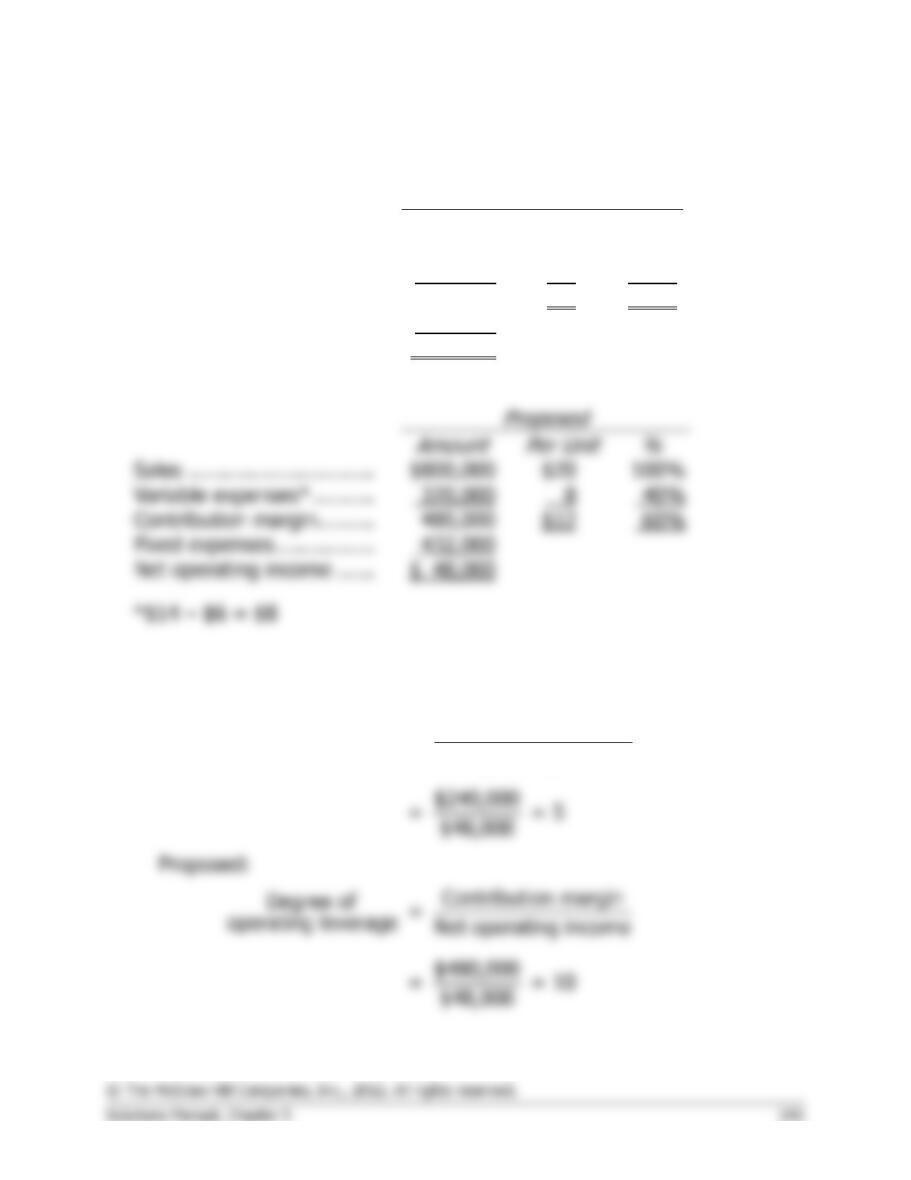
1. The income statements would be:
Present
Amount
Per Unit
%
Sales …………………………
$800,000
$20
100%
Variable expenses …………
560,000
14
70%
Contribution margin ………
240,000
$6
30%
Fixed expenses …………….
192,000
Net operating income ……
$ 48,000
Amount
Sales …………………………
$800,000
Variable expenses* ……….
320,000
Contribution margin ………
Fixed expenses …………….
Net operating income ……
$ 48,000
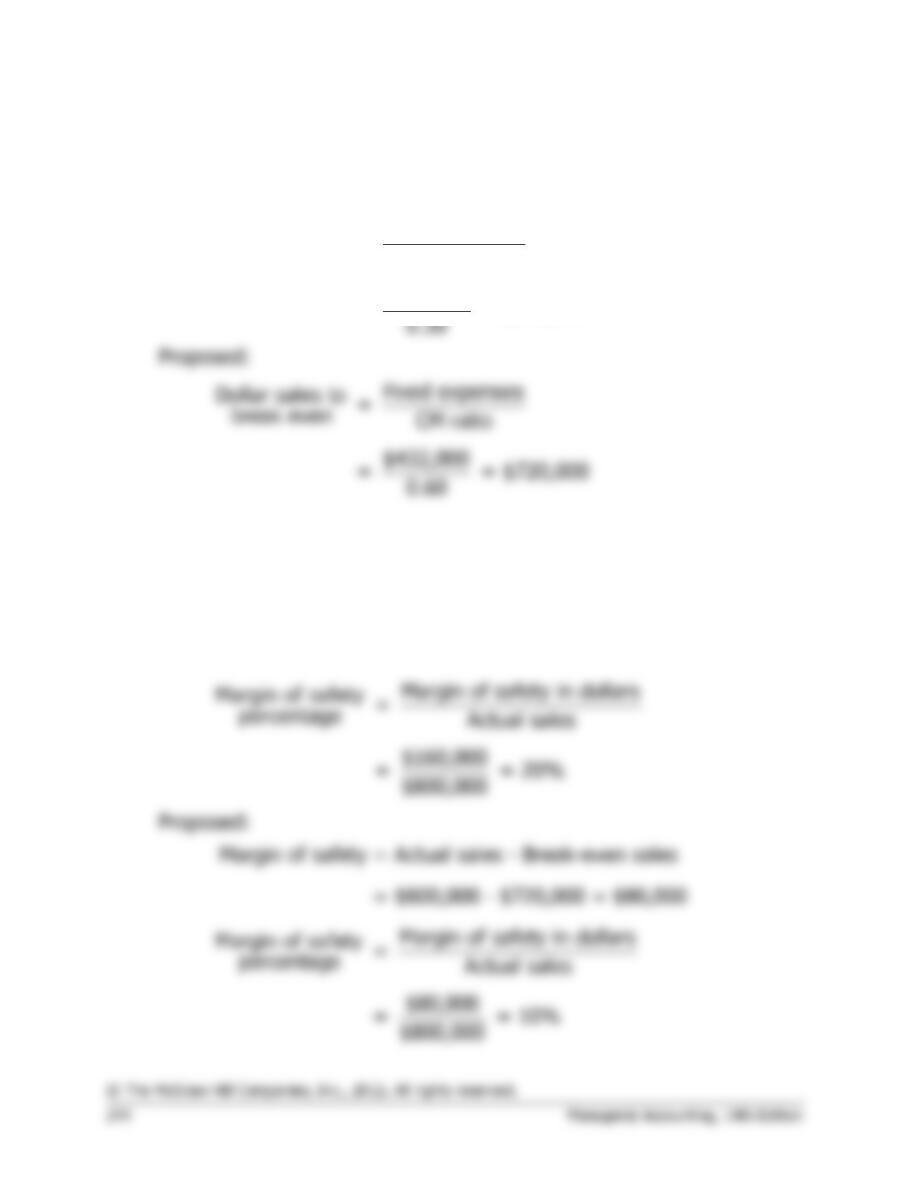
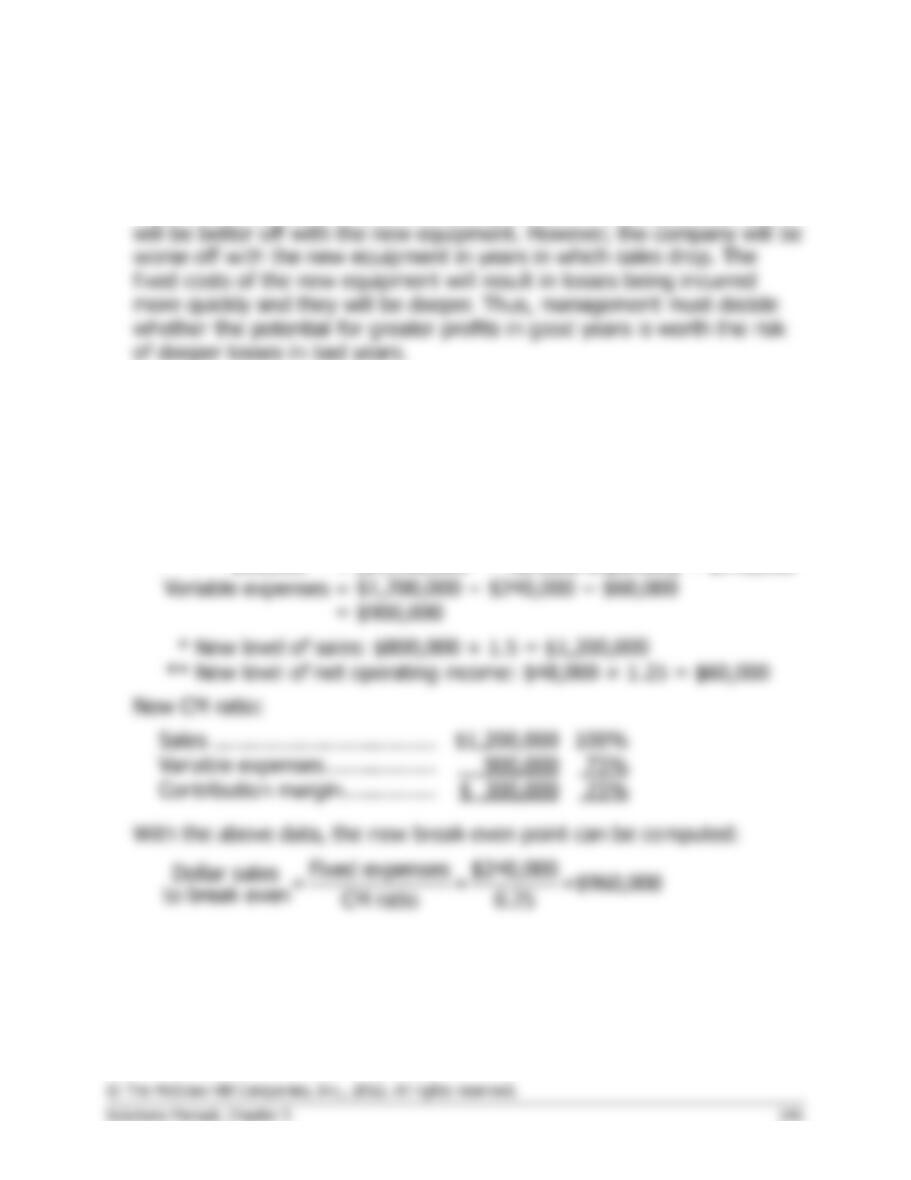
2. a. Degree of operating leverage:
Present:
Contribution margin
Degree of
=
operating leverage Net operating income
Problem 5-26 (continued)
b. Dollar sales to break even:
Present:
Fixed expenses
Dollar sales to =
break even CM ratio
Fixed expenses
Dollar sales to =
break even CM ratio
$192,000
= = $640,000
c. Margin of safety:
Present:
Margin of safety = Actual sales – Break-even sales
= $800,000 – $640,000 = $160,000
Problem 5-26 (continued)
3. The major factor would be the sensitivity of the company’s operations to
cyclical movements in the economy. Because the new equipment will
increase the CM ratio, in years of strong economic activity, the company
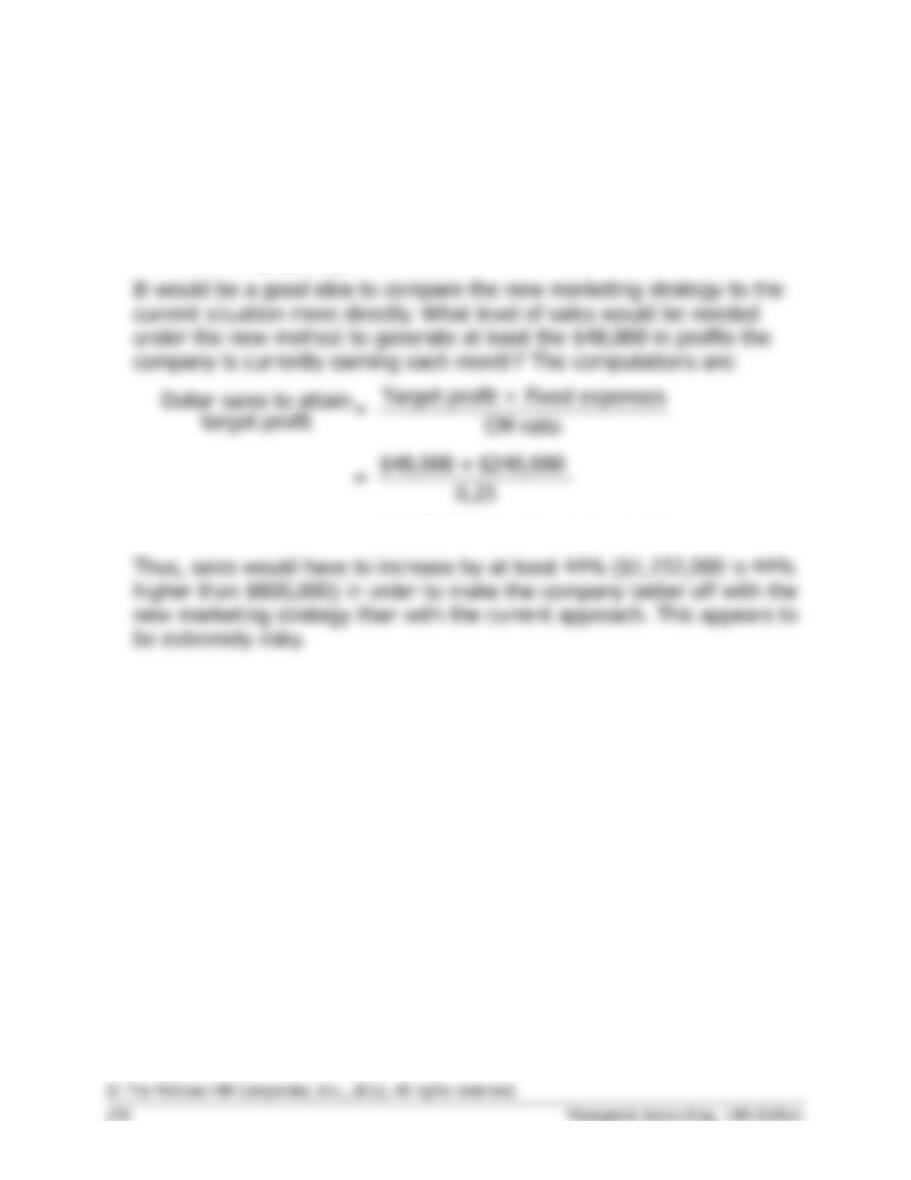
4. No information is given in the problem concerning the new variable
expenses or the new contribution margin ratio. Both of these items must
be determined before the new break-even point can be computed. The
computations are:
New variable expenses:
Profit
= (Sales − Variable expenses) − Fixed expenses
$60,000**
= ($1,200,000* − Variable expenses) − $240,000
= $1,200,000 − $240,000 − $60,000
New level of sales: $800,000 × 1.5 = $1,200,000
Sales ………………………………
Variable expenses ………………
Contribution margin ……………
Problem 5-26 (continued)
The greatest risk is that the increases in sales and net operating income
predicted by the marketing manager will not happen and that sales will
remain at their present level. Note that the present level of sales is
$800,000, which is well below the break-even level of sales under the
new marketing strategy.
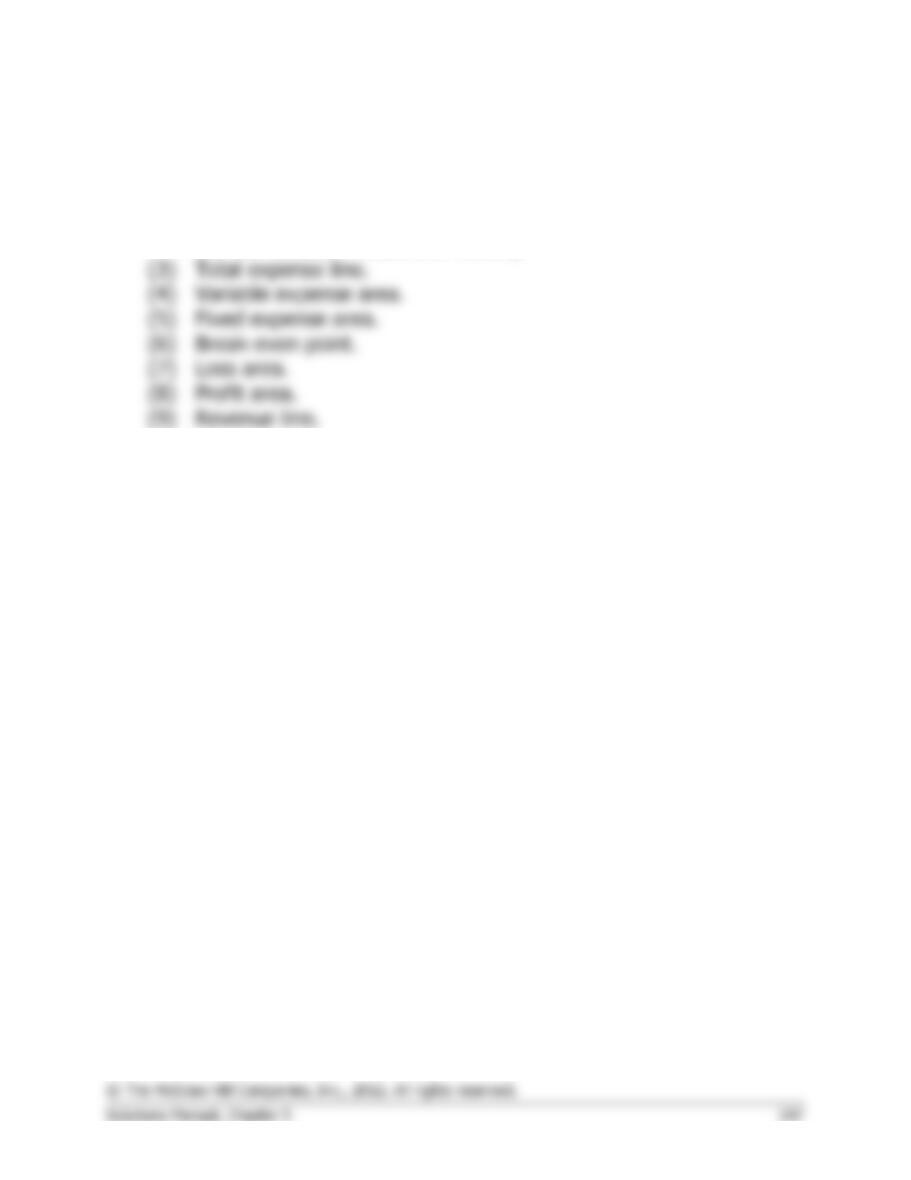
= $1,152,000 in sales each month
Problem 5-27 (30 minutes)
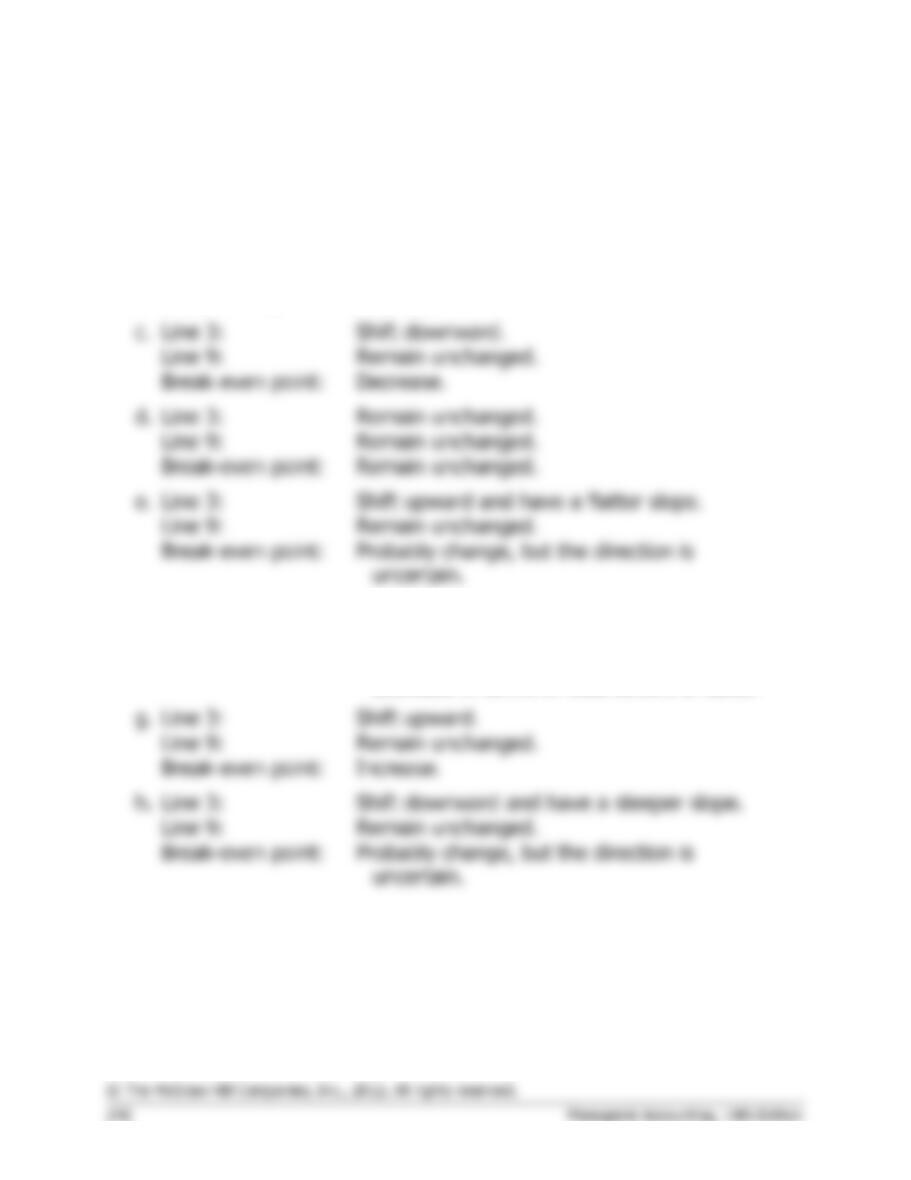
1. The numbered components are as follows:
(1)
Dollars of revenue and costs.
(2)
Volume of output, expressed in units, % of capacity, sales,
or some other measure of activity.
(3)
Total expense line.
(4)
Variable expense area.
(5)
Fixed expense area.
(6)
Break-even point.
(9)
Revenue line.
Problem 5-27 (continued)
2.
a.
Line 3:
Remain unchanged.
Line 9:
Have a flatter slope.
Break-even point:
Increase.
b.
Line 3:
Have a steeper slope.
Line 9:
Remain unchanged.
Break-even point:
Increase.
Line 3:
Shift downward.
Line 9:
Remain unchanged.
Break-even point:
Decrease.
d.
Line 3:
Remain unchanged.
Line 9:
Remain unchanged.
Break-even point:
Remain unchanged.
Line 3:
Shift upward and have a flatter slope.
Line 9:
Remain unchanged.
Break-even point:
Probably change, but the direction is
f.
Line 3:
Have a flatter slope.
Line 9:
Have a flatter slope.
Break-even point:
Remain unchanged in terms of units;
decrease in terms of total dollars of sales.
Line 3:
Shift upward.
Line 9:
Remain unchanged.
Break-even point:
Increase.
Line 3:
Shift downward and have a steeper slope.
Line 9:
Remain unchanged.
uncertain.
Problem 5-28 (60 minutes)
1.
Profit
= Unit CM × Q − Fixed expenses
$0
= ($2.00 − $0.80) × Q − $60,000
$0
= ($1.20) × Q − $60,000
$1.20Q
= $60,000
Q
= $60,000 ÷ $1.20 per pair
Q
= 50,000 pairs
50,000 pairs × $2 per pair = $100,000 in sales.
2. See the graph on the following page.
3.
Profit
= Unit CM × Q − Fixed expenses
$9,000
= $1.20 × Q − $60,000
$1.20Q
= $9,000 + $60,000
Q
= $69,000 ÷ $1.20 per pair
Q
= 57,500 pairs
Problem 5-28 (continued)
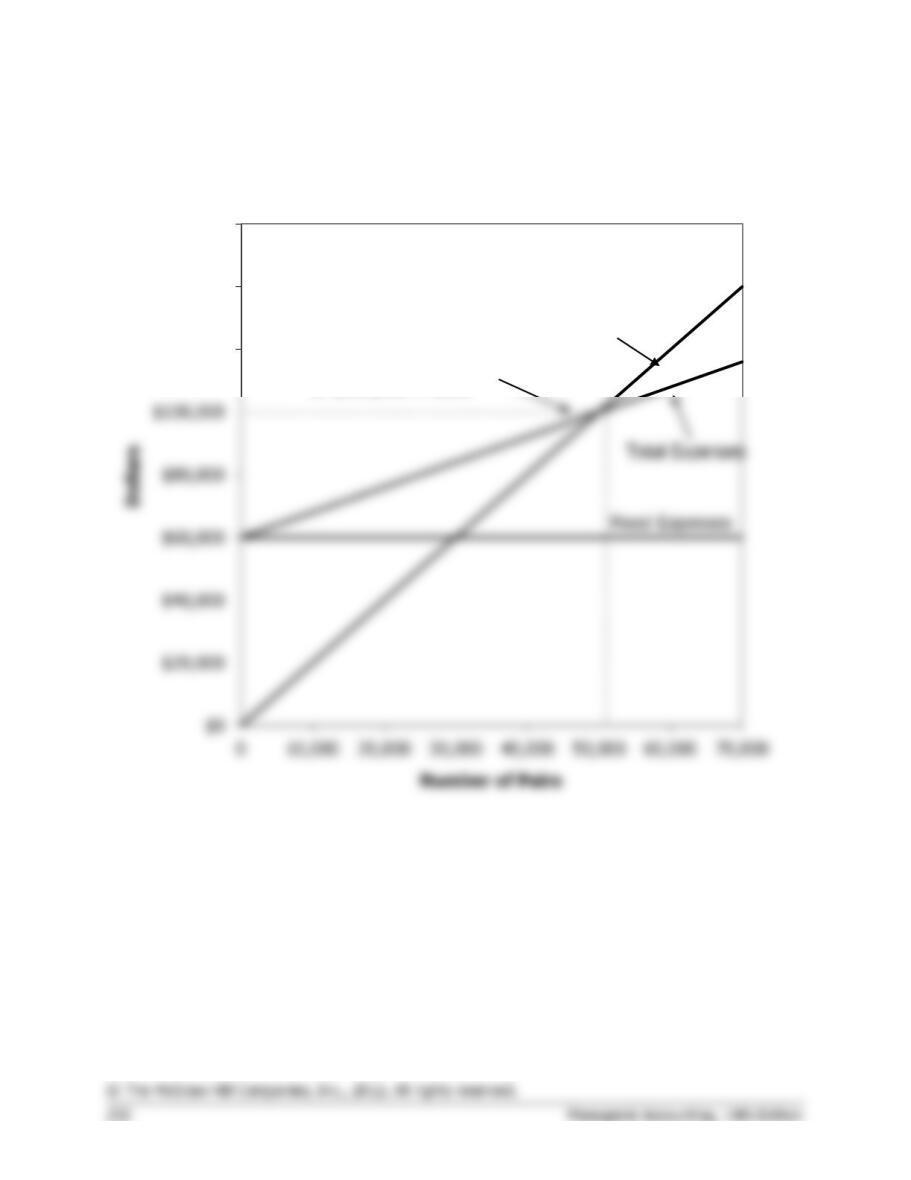
2. Cost-volume-profit graph:
Total Expenses
$120,000
$140,000
$160,000
Break-even point: 50,000 pairs,
or $100,000 in sales
Total Sales
Problem 5-28 (continued)
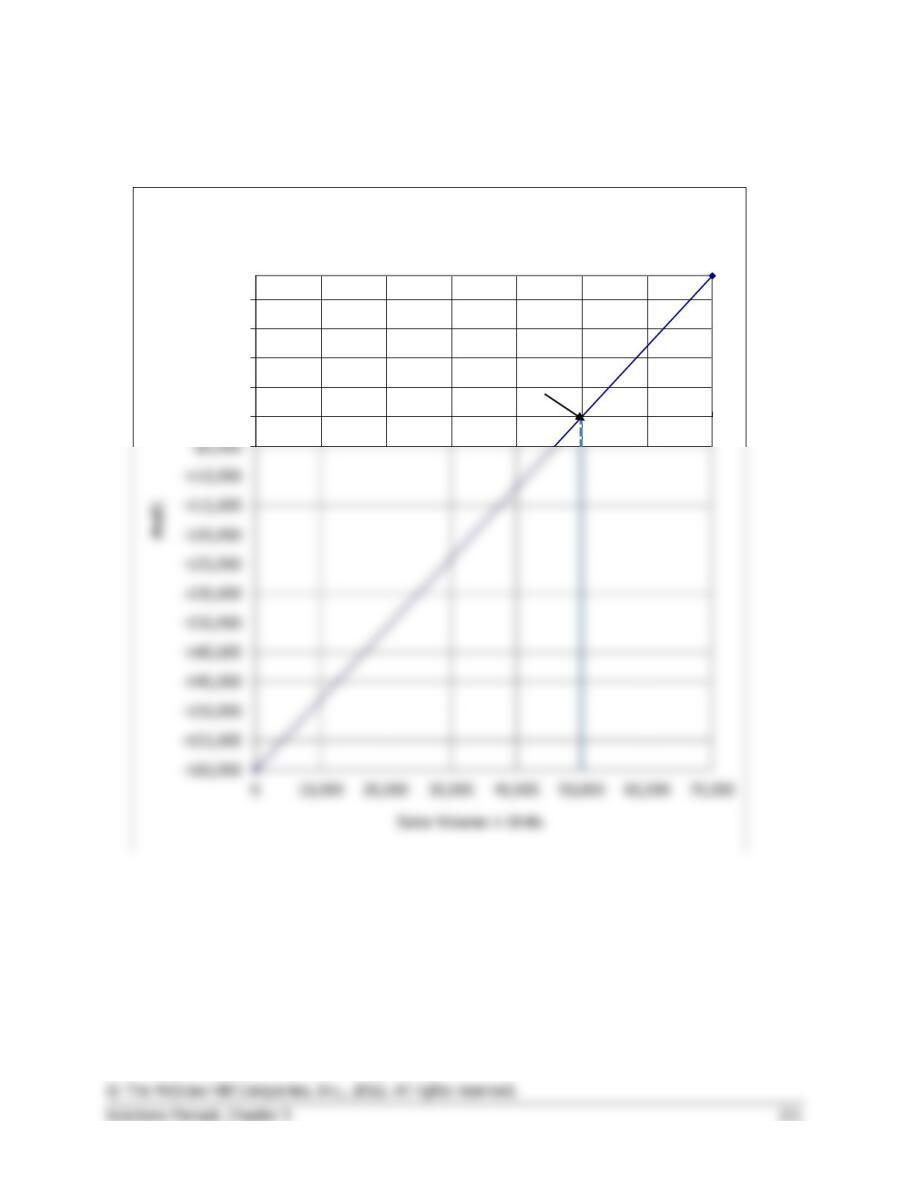
Profit graph:
Break-even point:
50,000 pairs of
stockings
$0
$5,000
$10,000
$15,000
$20,000
Profit Graph