Continuing Case Solution
Chapter 5
Part I: Analysis of Balance Sheet and Cash Flows
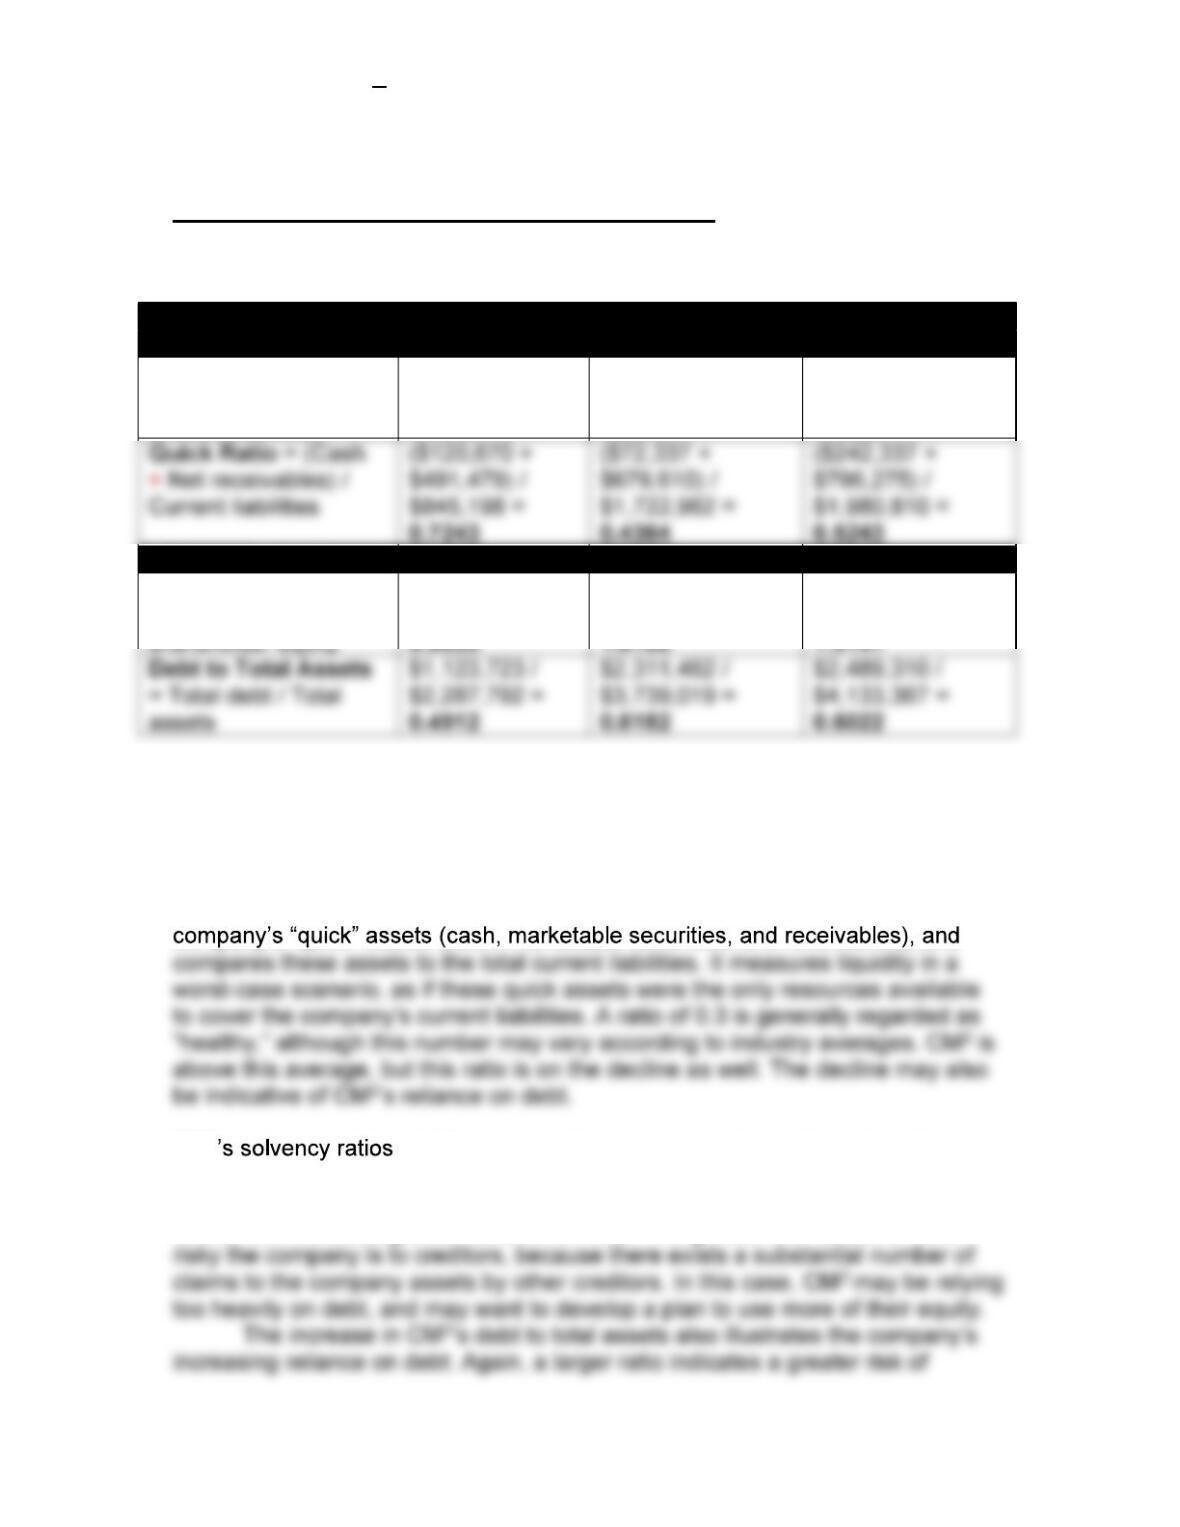
(a) Liquidity and Solvency Ratios
2011 2012 2013
Liquidity Ratios:
Current Ratio =
Current assets /
Current liabilities
$1,483,062 /
$845,198 =
1.7547
$2,126,086 /
$1,722,962 =
1.2340
$2,817,434 /
$1,980,810 =
1.4224
Solvency Ratios:
Debt to Equity
= Total
debt / Total
$1,123,723 /
$1,164,069 =
$2,311,462 /
$1,427,557 =
$2,489,310 /
$1,644,057 =
The liquidity ratios for CM2 are declining from 2011 to 2013. The current ratio for
all three years is healthy because it is greater than 1.0, meaning that CM2 has
enough current assets to cover its current liabilities. The decline in this number
may be attributed to the fact that while CM2 is increasing both its current assets
and current liabilities, it is incurring a greater percentage of liabilities to assets.
The quick ratio, or acid-test ratio as it is often called, examines a
CM2, which measure debt as a percentage of equity and as a
percentage of total assets, are increasing from 2011 to 2013. The total debt to
equity ratio measures the risk to creditors in the event of insolvency. An increase
in this ratio indicates greater reliance on debt. The greater the ratio, the more
Continuing Case Solution
default. However, in the event of insolvency, CM2could liquidate all of its assets
and still manage to cover its debt.
(b) Free Cash Flow
2011 2012 2013
Free Cash Flow =
Cash flow from
$553,985
$274,300
$645,015
$460,087
$190,500 $0
$110,000=
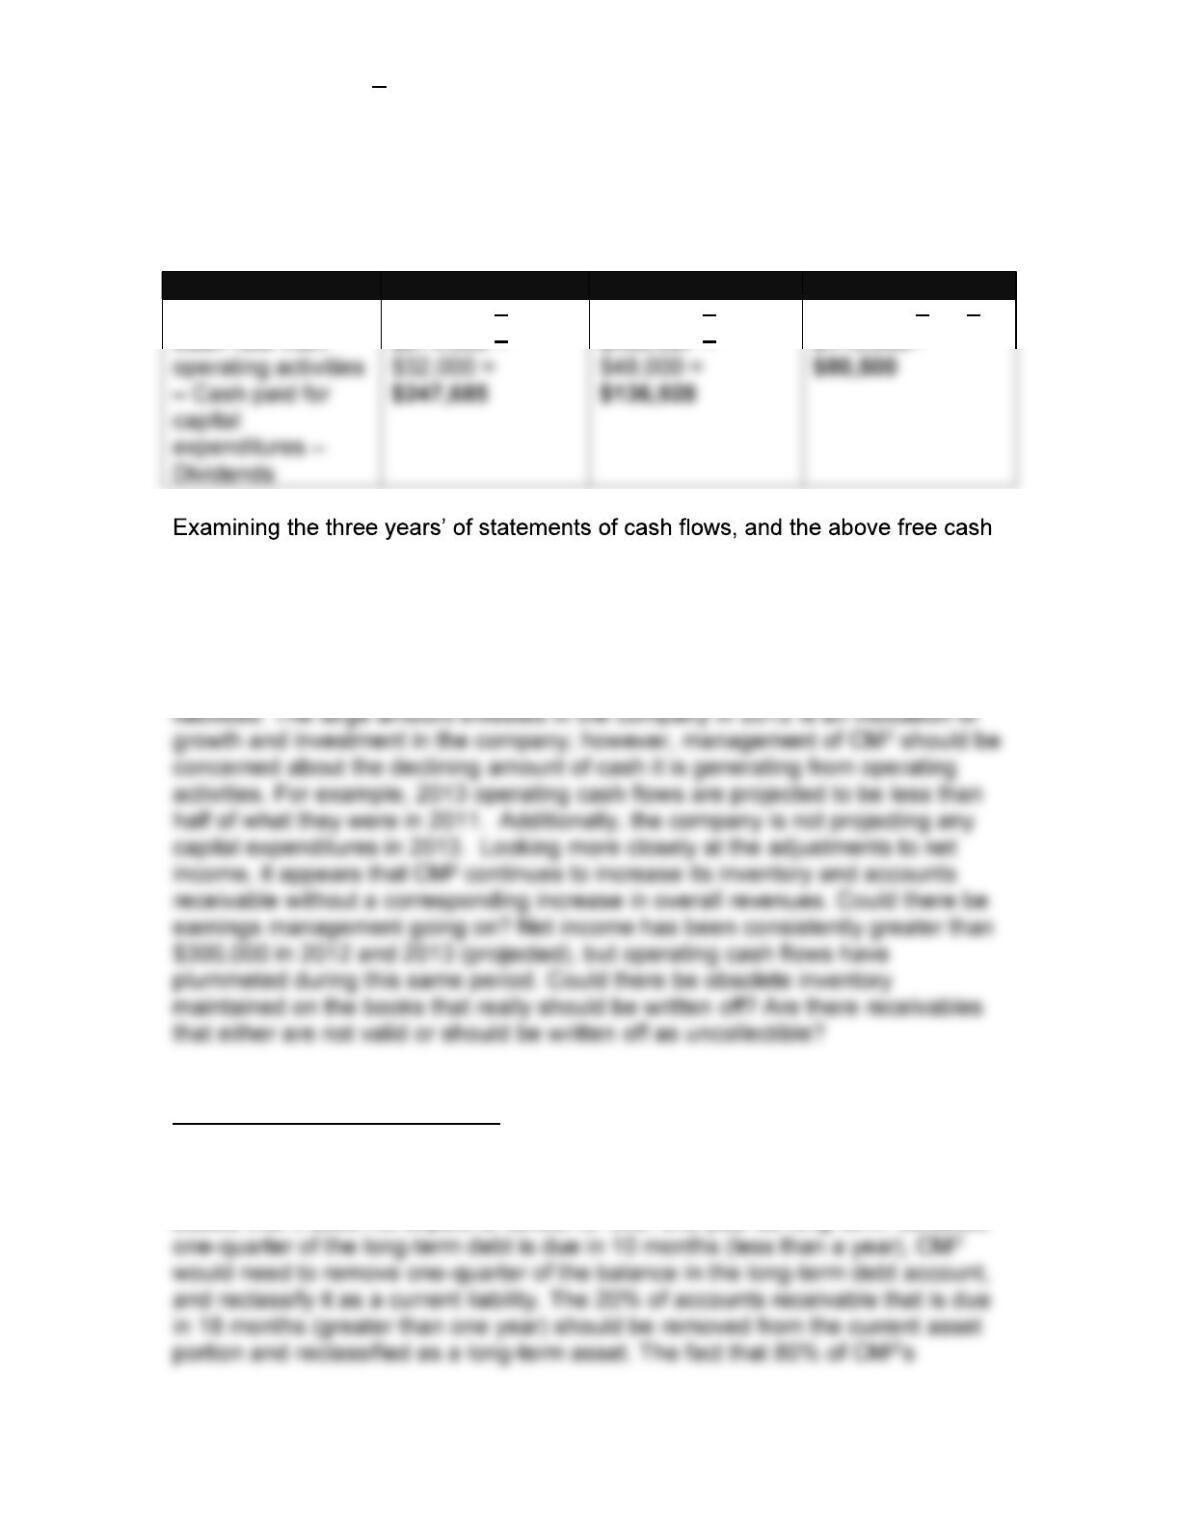
flow amounts, we see that CM2 could improve on its investment decisions and
cash management strategies. The company had healthy figures in 2011, as cash
from operating activities was strong and more than sufficient to cover their
investing and financing activities, and other unexpected payments requiring cash.
In 2012, CM2 had more cash outflow in investing activities than it generated from
operations but supplemented its cash using proceeds obtained from long-term
Part II: Transparent Reporting
(a) CM2 is required to reclassify as current the portion of any long-term liability
required to be paid within one year and to reclassify the portion of short-term
assets that it does not expect to collect for over one year as long-term. Because
Continuing Case Solution
suppliers want faster payment requires no adjustment, but it may be a source of
strain on CM2
2011 2012 2013
Liquidity Ratios:
Current Ratio =
Current assets /
Current liabilities
($1,483,062
$98,296) /
($845,198 +
$69,631)
= 1.5137
($2,126086
$135,922) /
($1,722,962 +
$147,125)
= 1.0642
($2,817,434
$159,255) /
($1,980,810 +
$127,125)
= 1.2610
Solvency Ratios:
Debt to Equity =
Total liabilities / Total
$1,123,723 /
$1,164,069 =
$2,311,462 /
$1,427,557 =
$2,489,310 /
$1,644,057 =
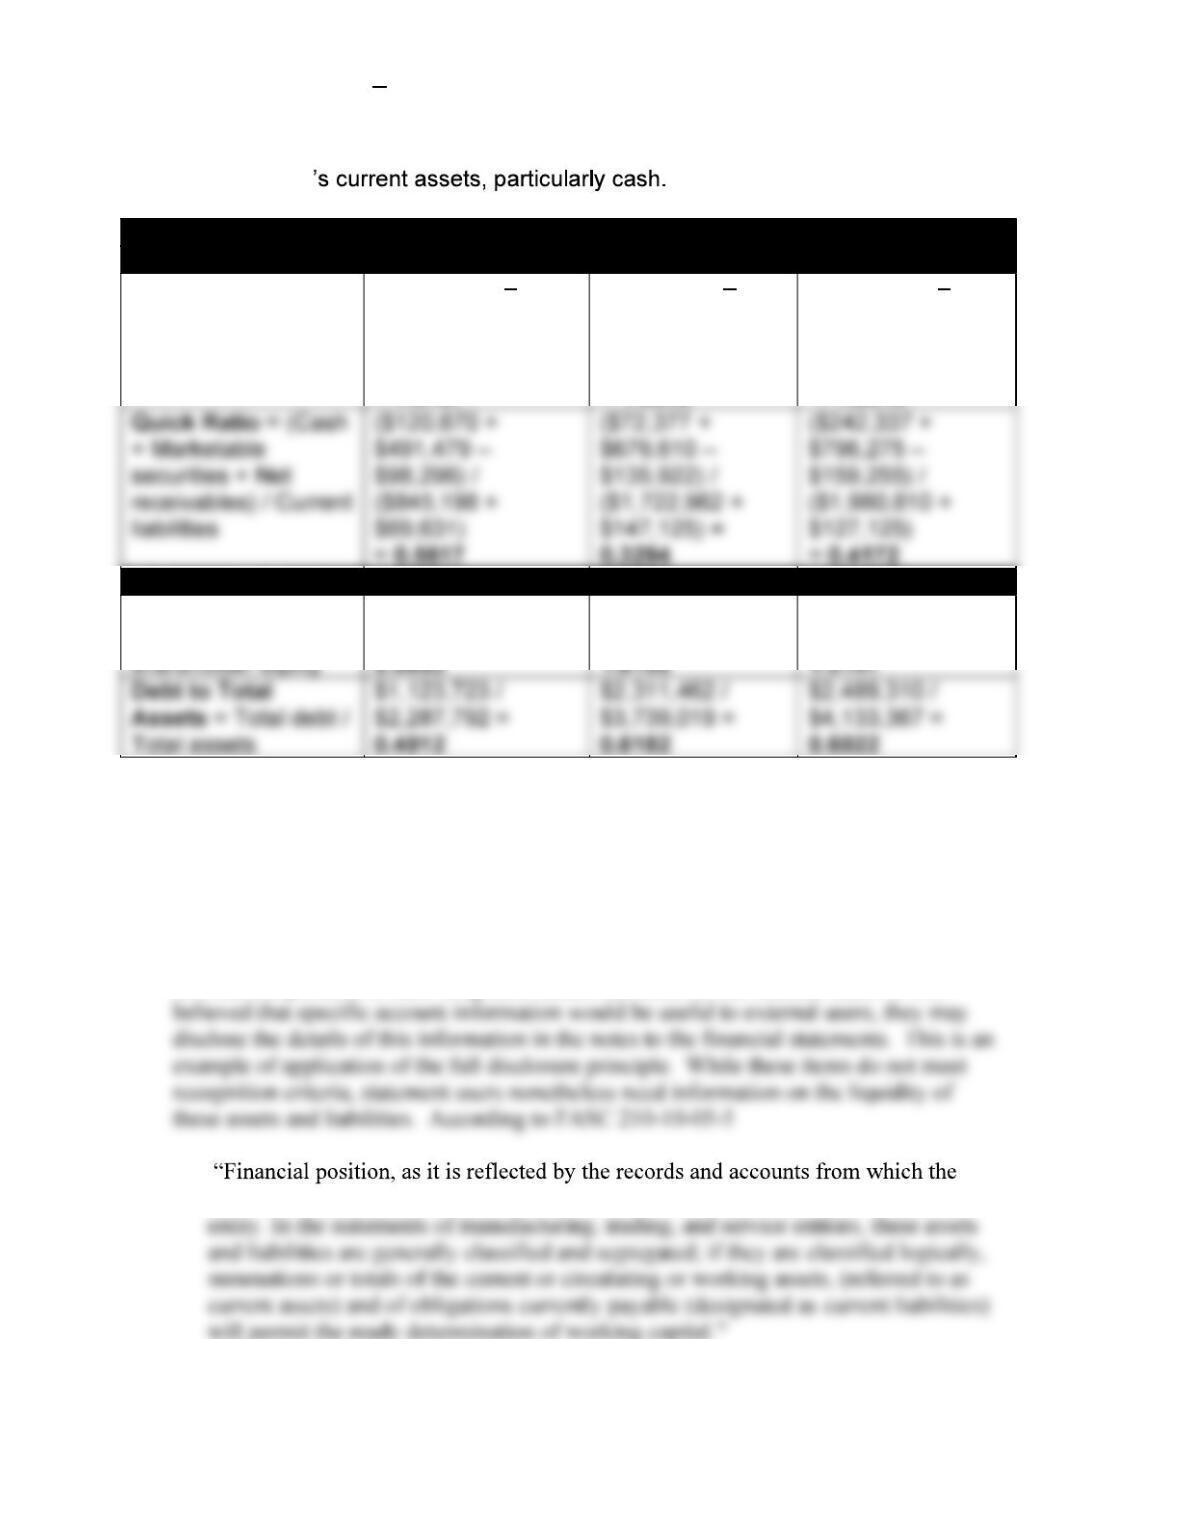
The current and quick ratios are lower all three years because of the
reclassification of items in the current sections. There was no effect on the
solvency ratios since these ratios are not affected by changes in current and non–
current classifications of assets and liabilities.
(b) CM2 is required to make the necessary adjustments to accurately reflect current and
non-current portions of their long-term assets/liabilities on the balance sheet. If CM2
statement is prepared, is revealed in a presentation of the assets and liabilities of the
Continuing Case Solution
According to FASC 210-10- Working capital (also called net working capital) is
represented by the excess of current assets over current liabilities and identifies the