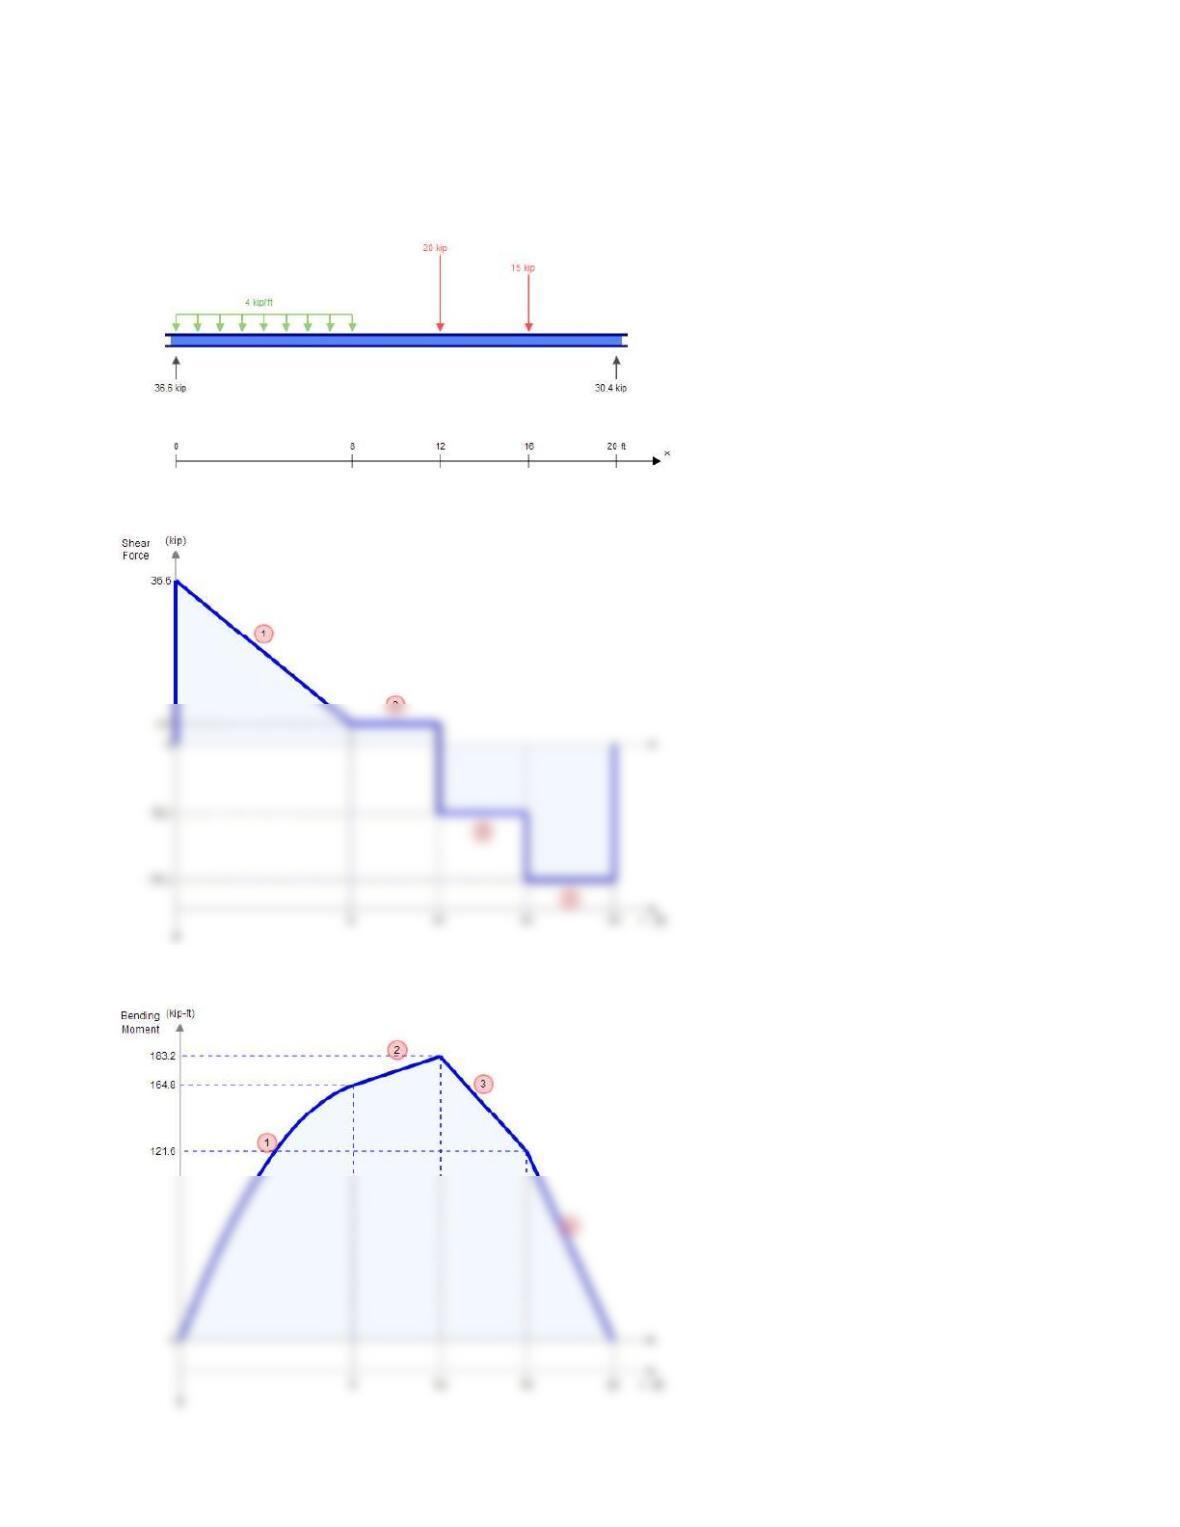
5-106
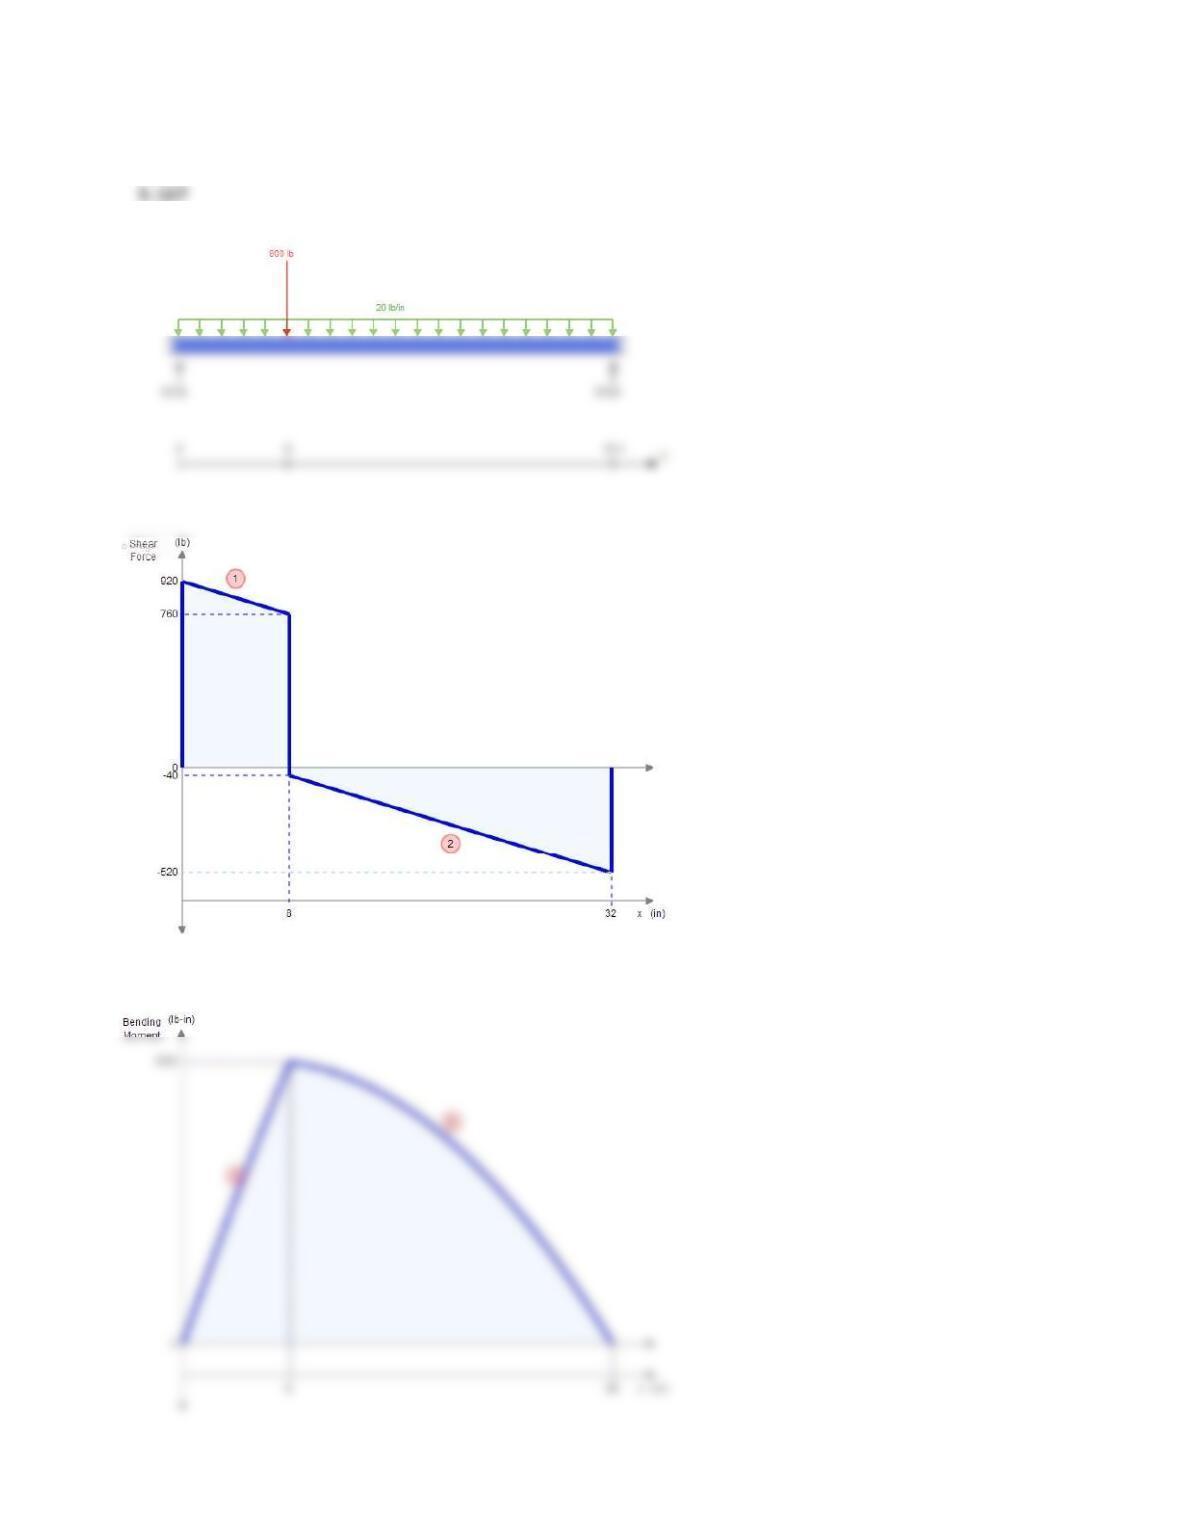
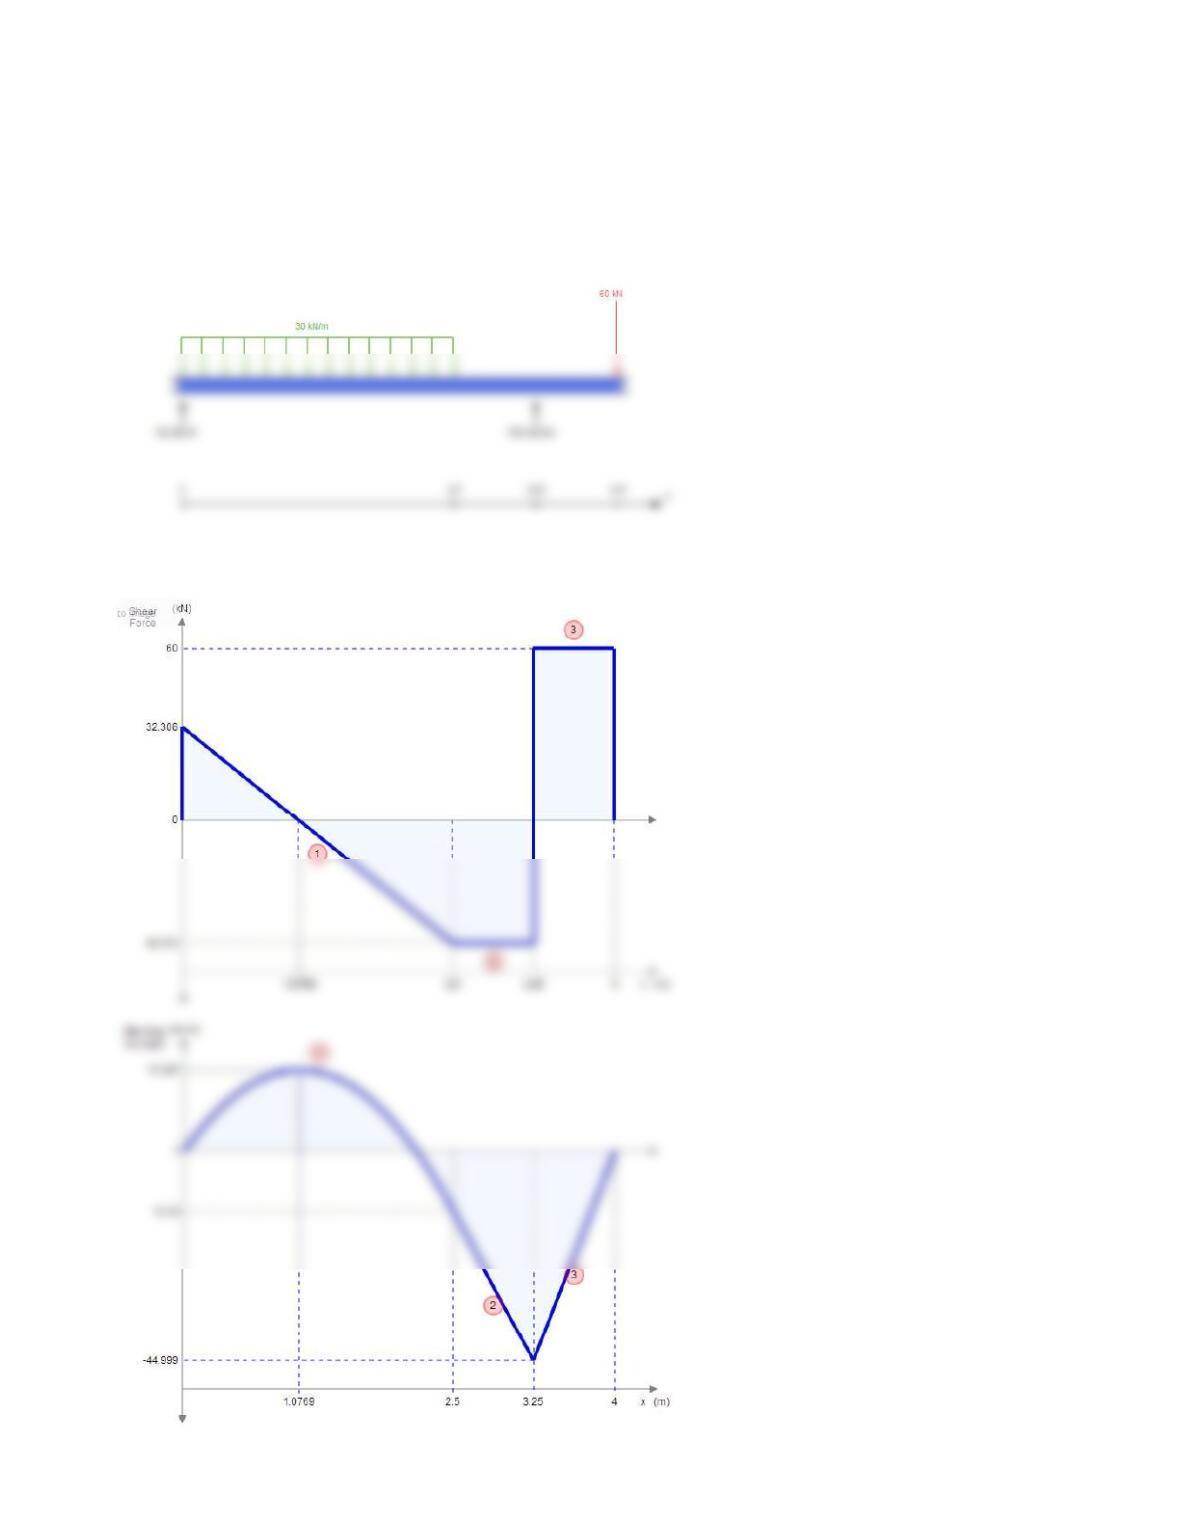
5-108
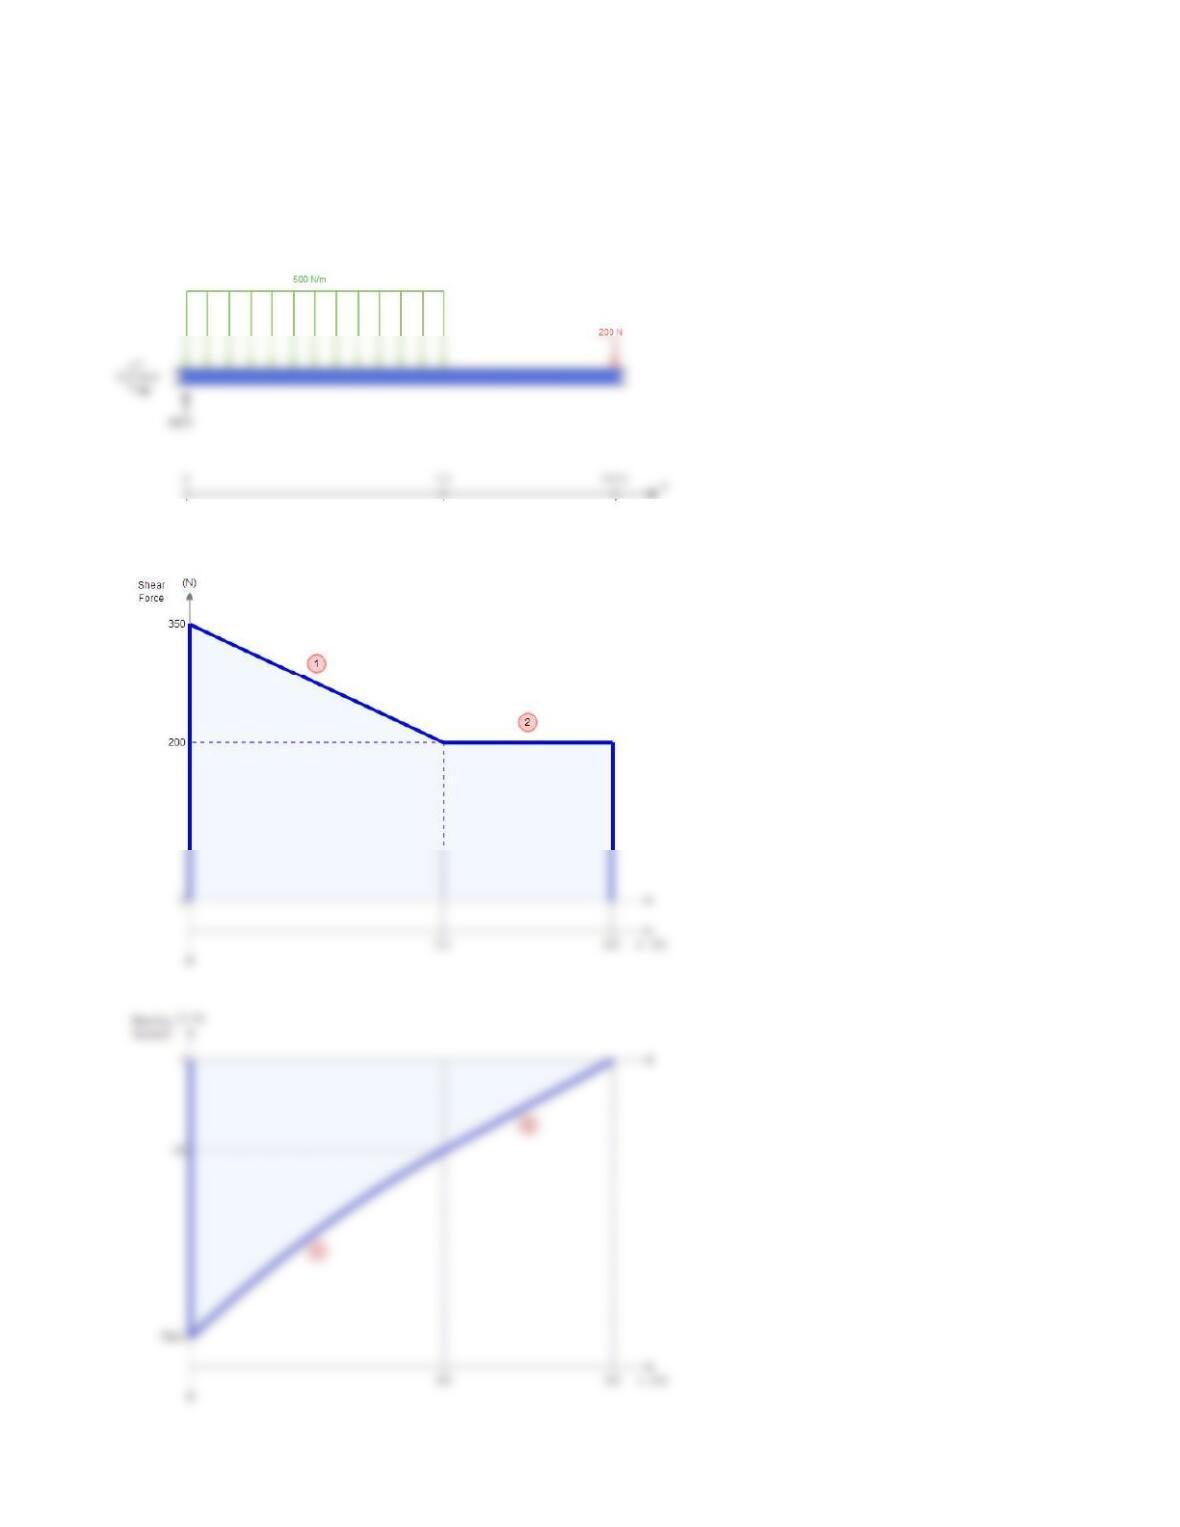
5-109
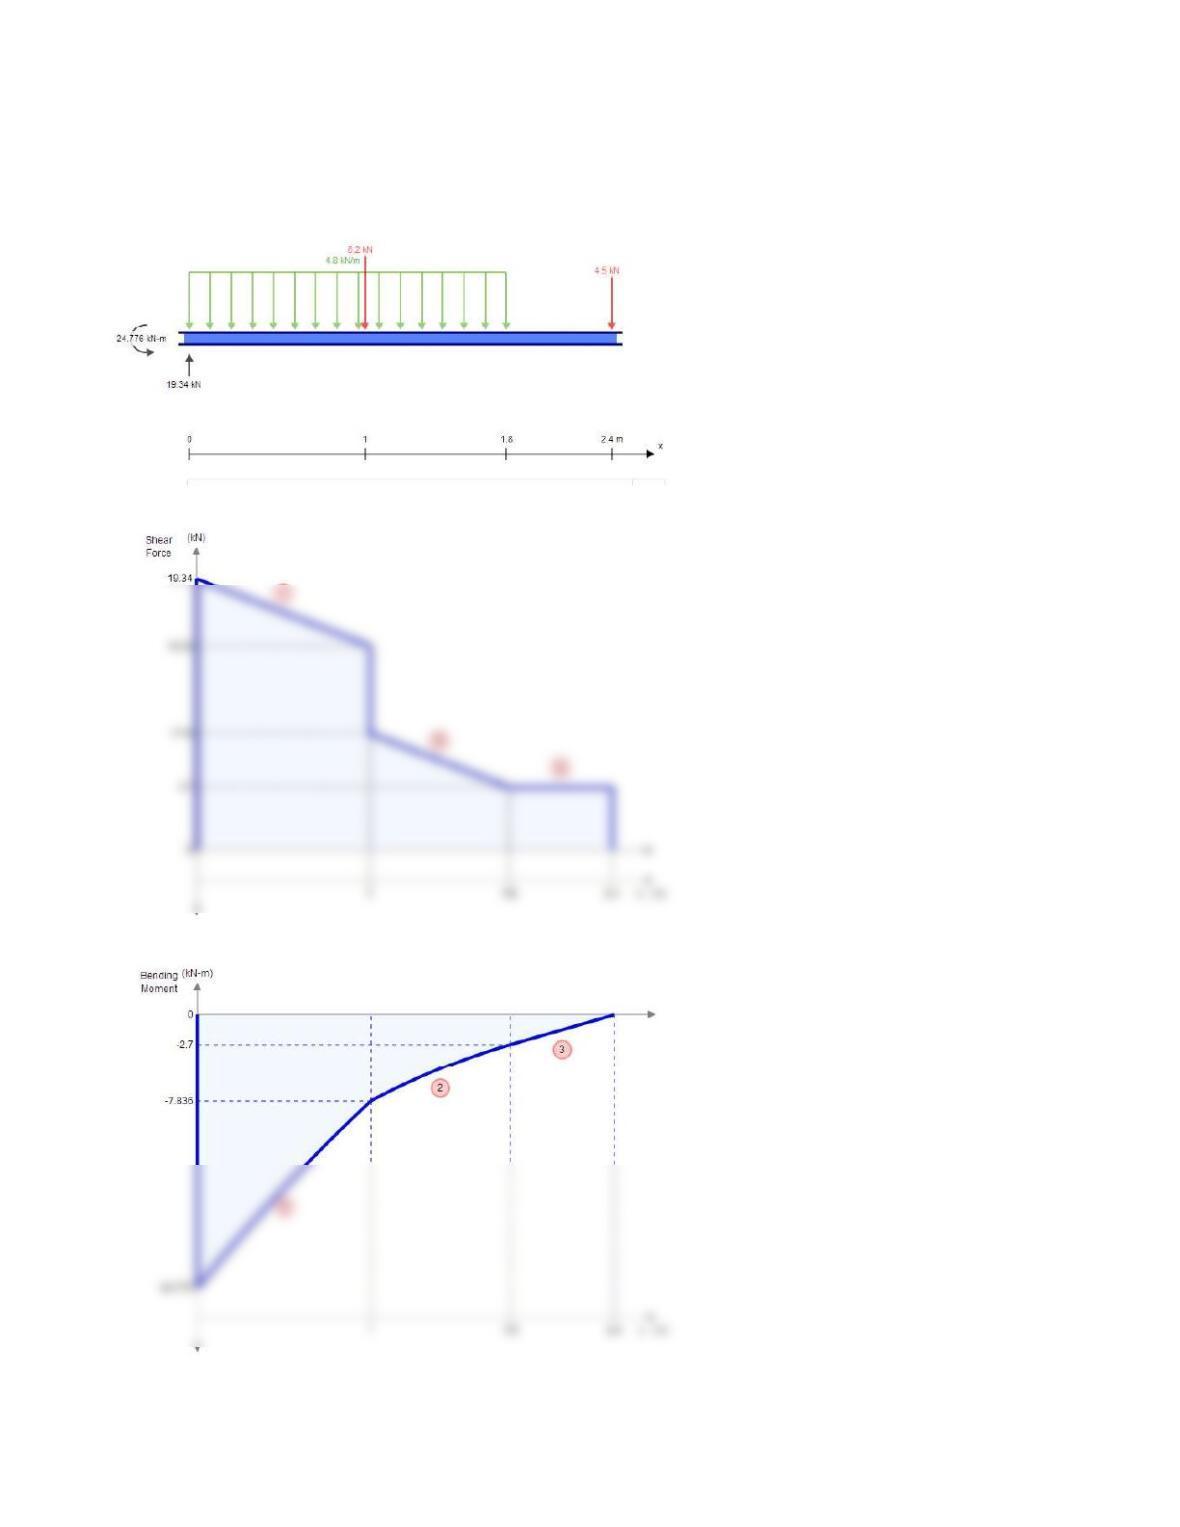
5-110
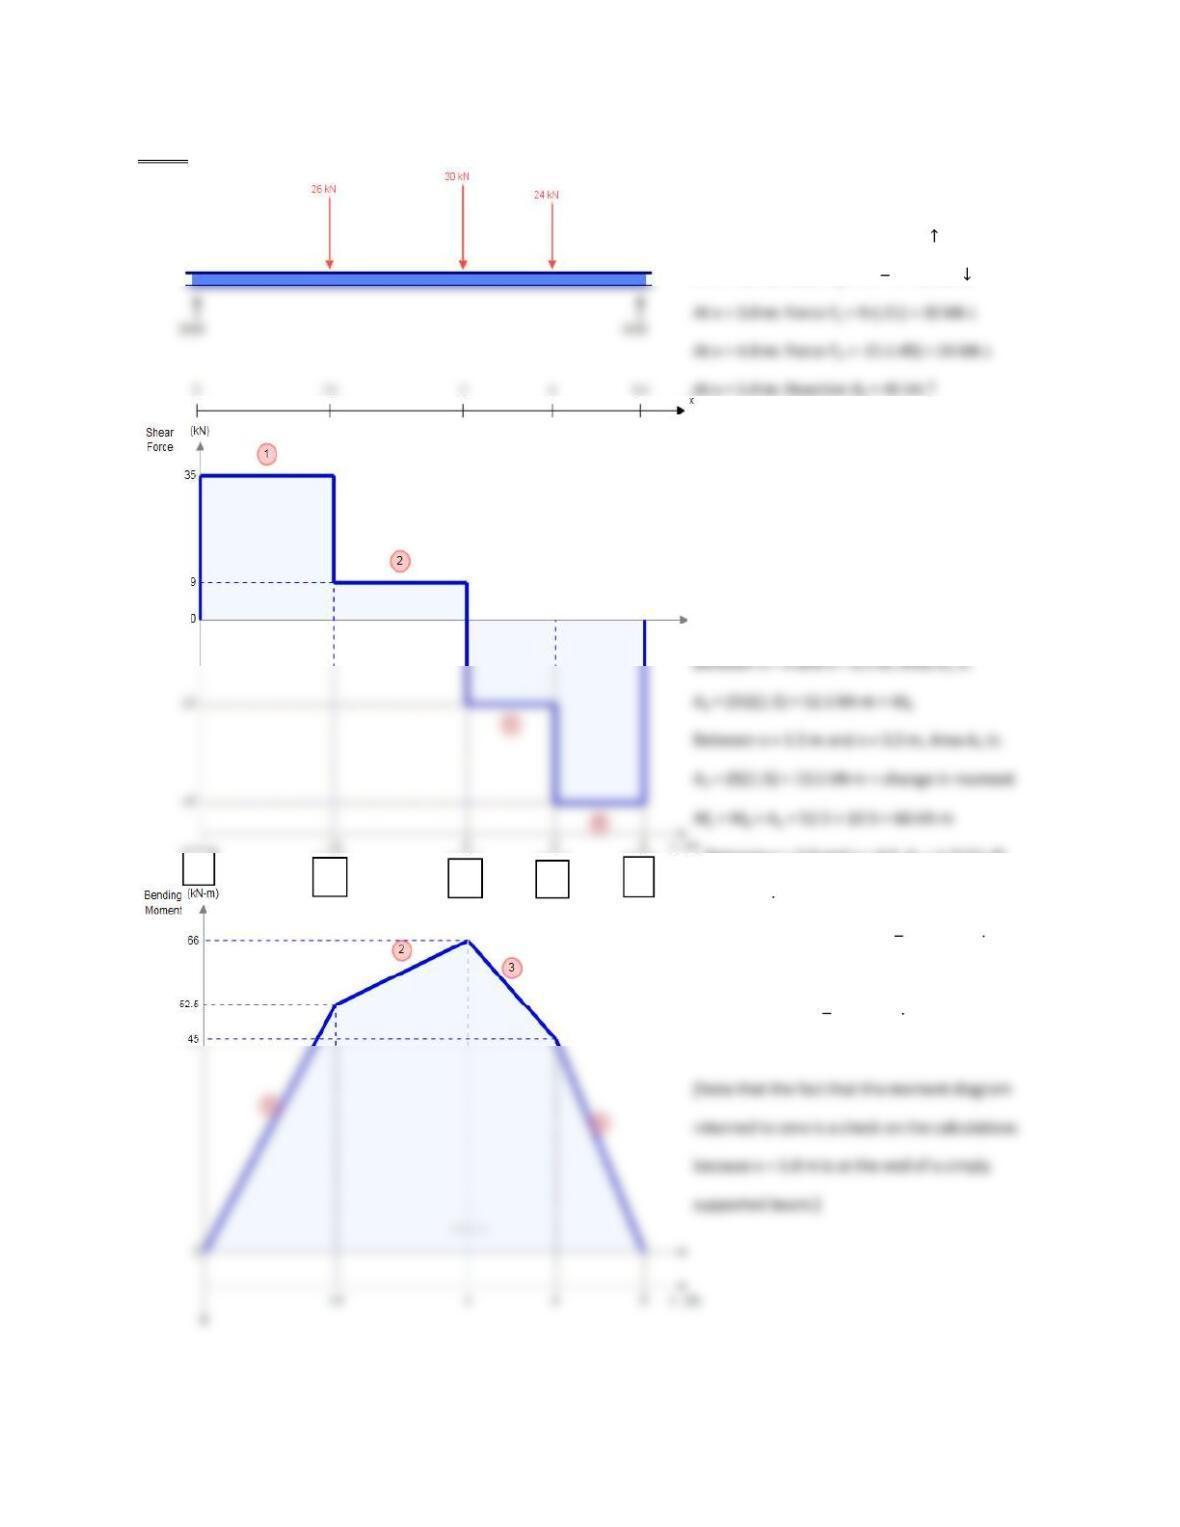
5-111 [Shear force diagram is given.]
Forces and reactions on beam:
At x = 0: Reaction RA = VA = 35 kN
At x = 1.5 m: Force FB = 35 9 = 26 kN
Moment diagram:
Use concept that area under the
Shear curve = change in bending moment.
Also moment at ends of simple beam = 0.
At x = 0, MA = 0
Between x = 3.0 and x = 4.0, A3 = (-21)(1.9)
A3 = -21 kN m = change in moment
At x = 4.0, MD = MC + A3 = 66 21 = 45 kN m
Between x = 4.0 and x = 5.0, A4 = (-45)(1.0) = -45
ME = MD + A4 = 45 45 = 0 kN m
A
B
C
DE
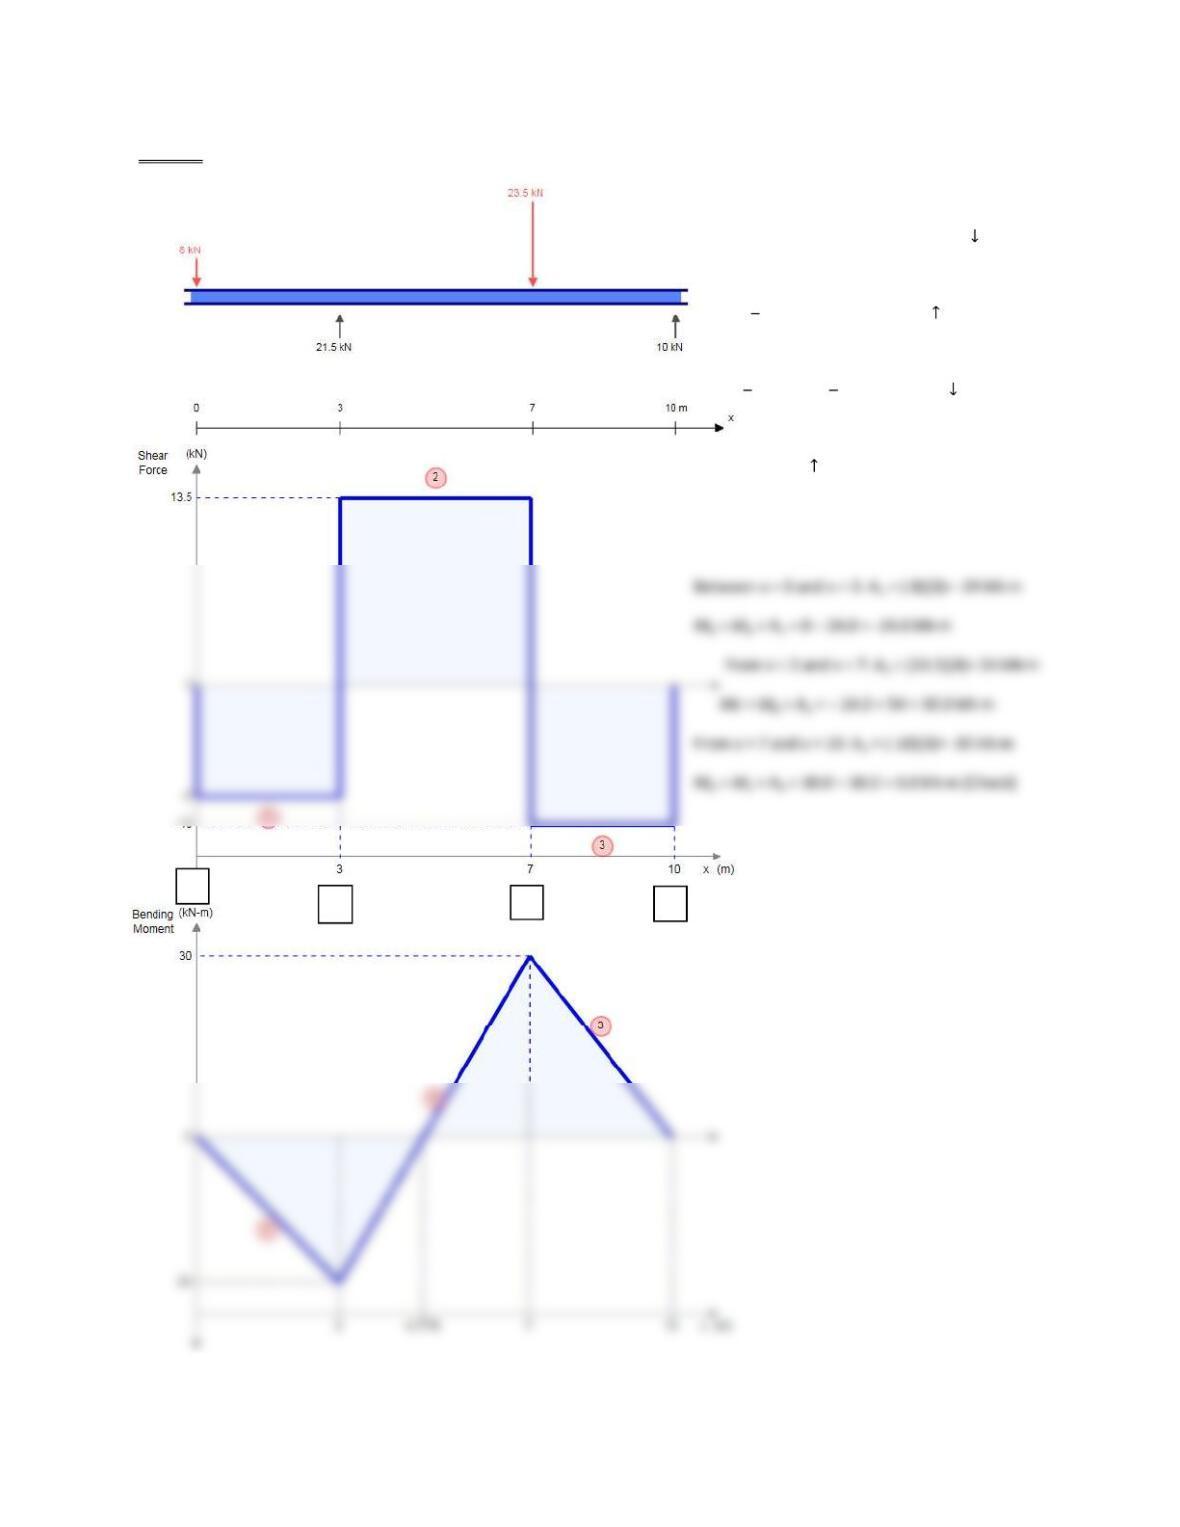
5-112 [Shear force diagram is given.]
Forces and reactions on beam:
Force applied at x = 0: FA = VA = -8.0 kN
Reaction at x = 3 m:
RB = VBL VBR = -8 -13.5 = -21.5 kN
At x = 7 m: Downward force is applied
FC = VCL VCR = 13.5 (-10) = 23.5 kN
At x = 10 m: Right reaction
RD = VD = -10 kN
Moment diagram:
A
B
C
D
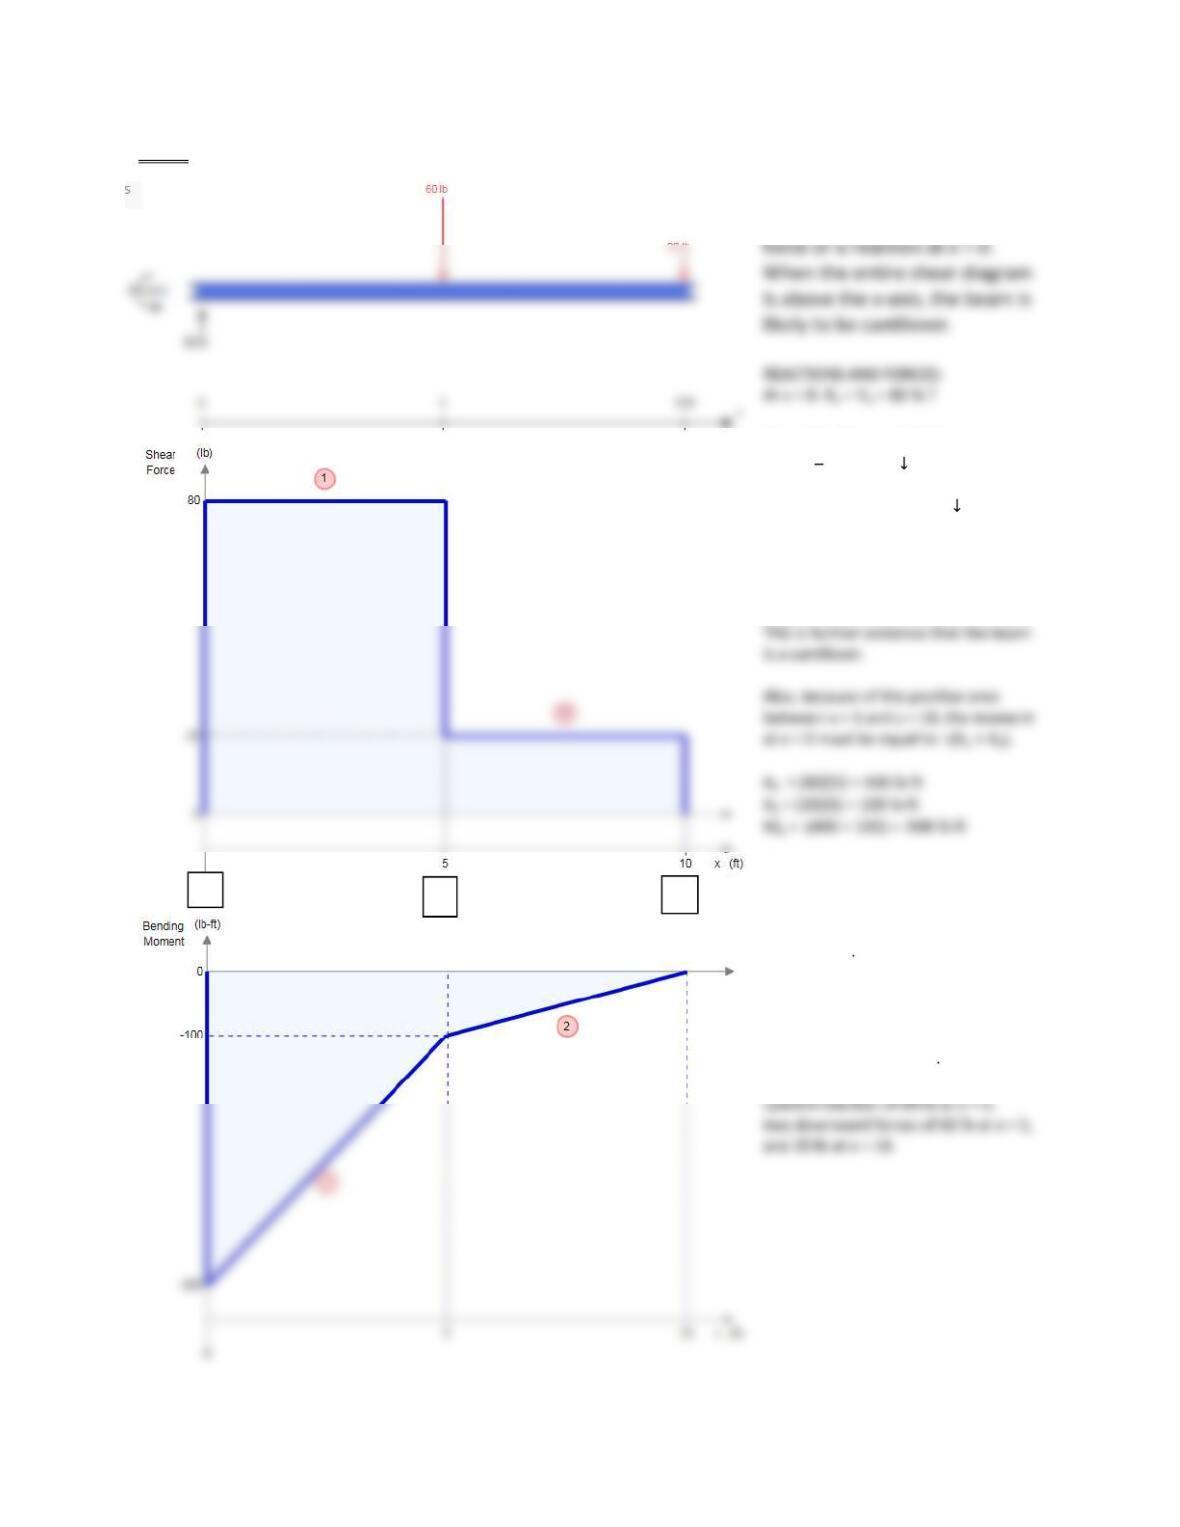
5-113 [Shear force diagram is given.]
With upward change in shear at
the left end, there is an upward
At x = 5 ft: Downward force
FB = 80 20 = 60 lb
At x = 10 ft: FC = VC = 20 lb
MOMENT DIAGRAM:
The positive area, A1, between x = 0
and x = 5 indicates that the moment
diagram started at a negative value.
This indicates a CCW moment at x = 0.
At x = 5: MB = MA + A1 = -500 +400
MB = -100 lb ft
At x = 10: MC = MB + A2 = -100 + 100
MC = 0 at the free end of beam
Therefore, the beam is a cantilever
with a moment of 500 lb ft CCW at the
fixed support at x = 0, a vertical
A
B
C
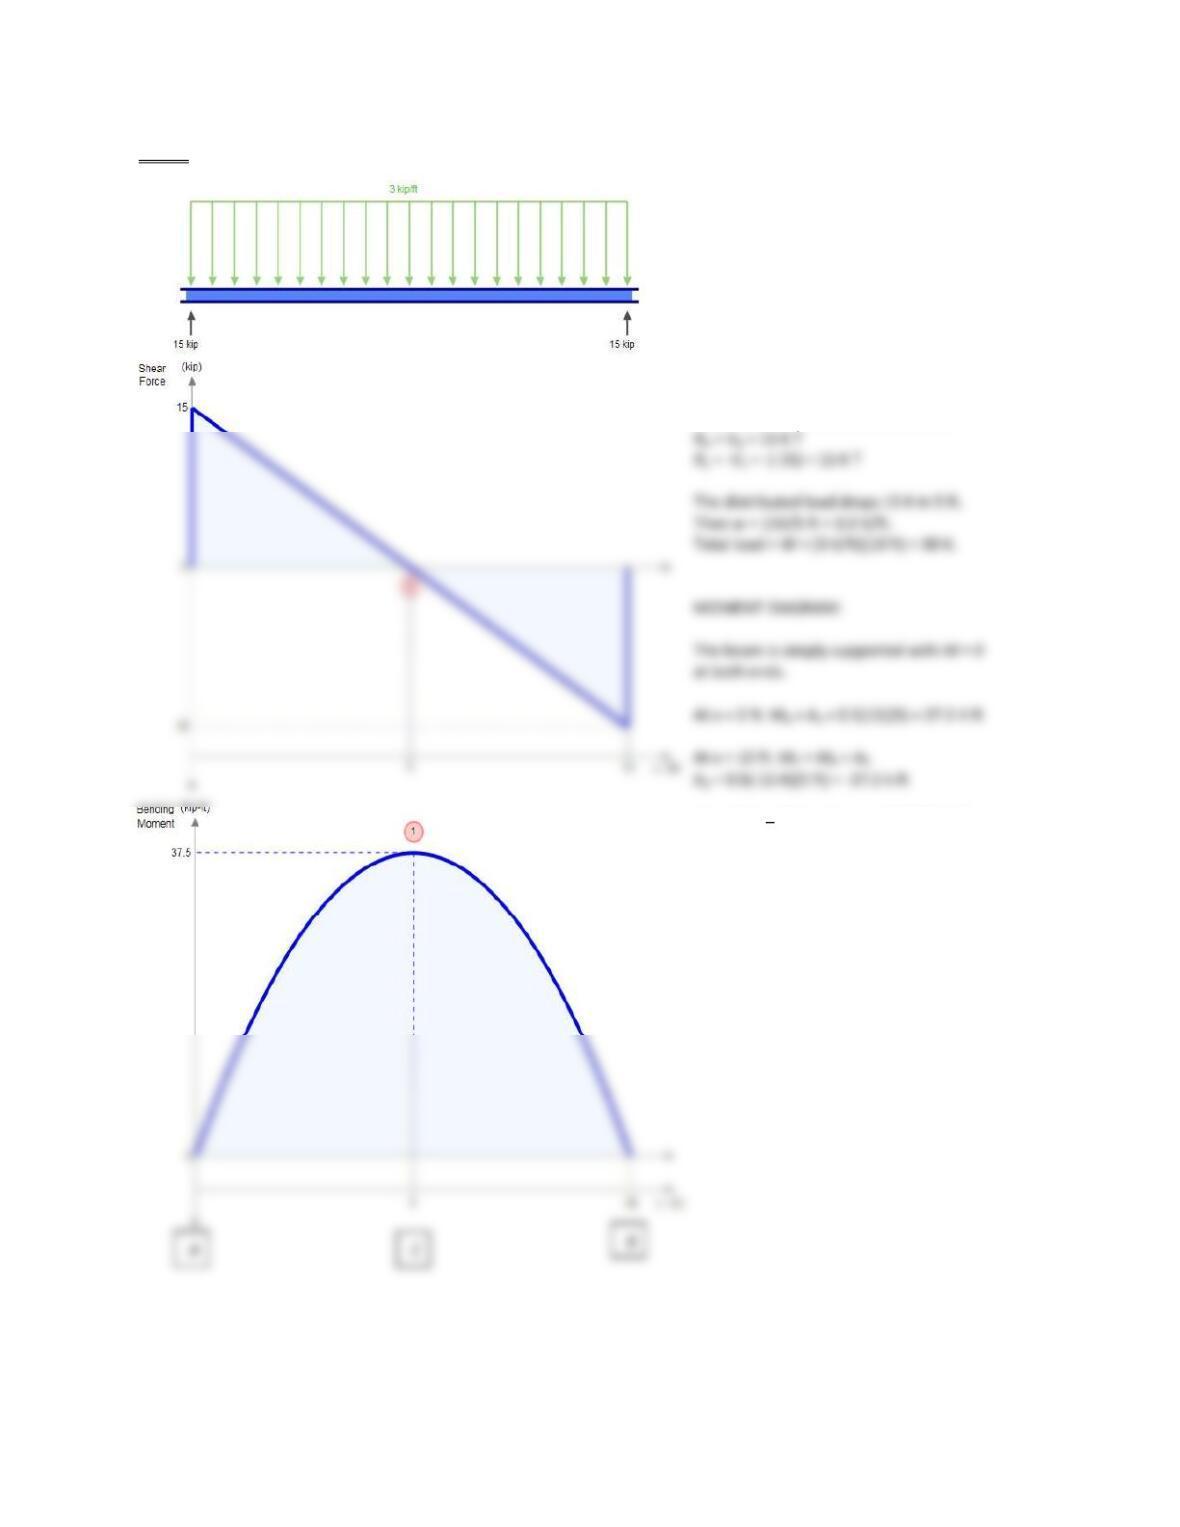
5-114 [Shear force diagram is given.]
The declining shearing force curve
Indicates that load is distributed.
With no abrupt changes in shear,
Except at the ends, there are no
Other concentrated loads and the
supports are simple at x = 0 and
and x = 10 ft.
REACTIONS AND DISTRIBUTED LOAD:
MC = 37.5 37.5 = 0 at x = 10 ft [Check]
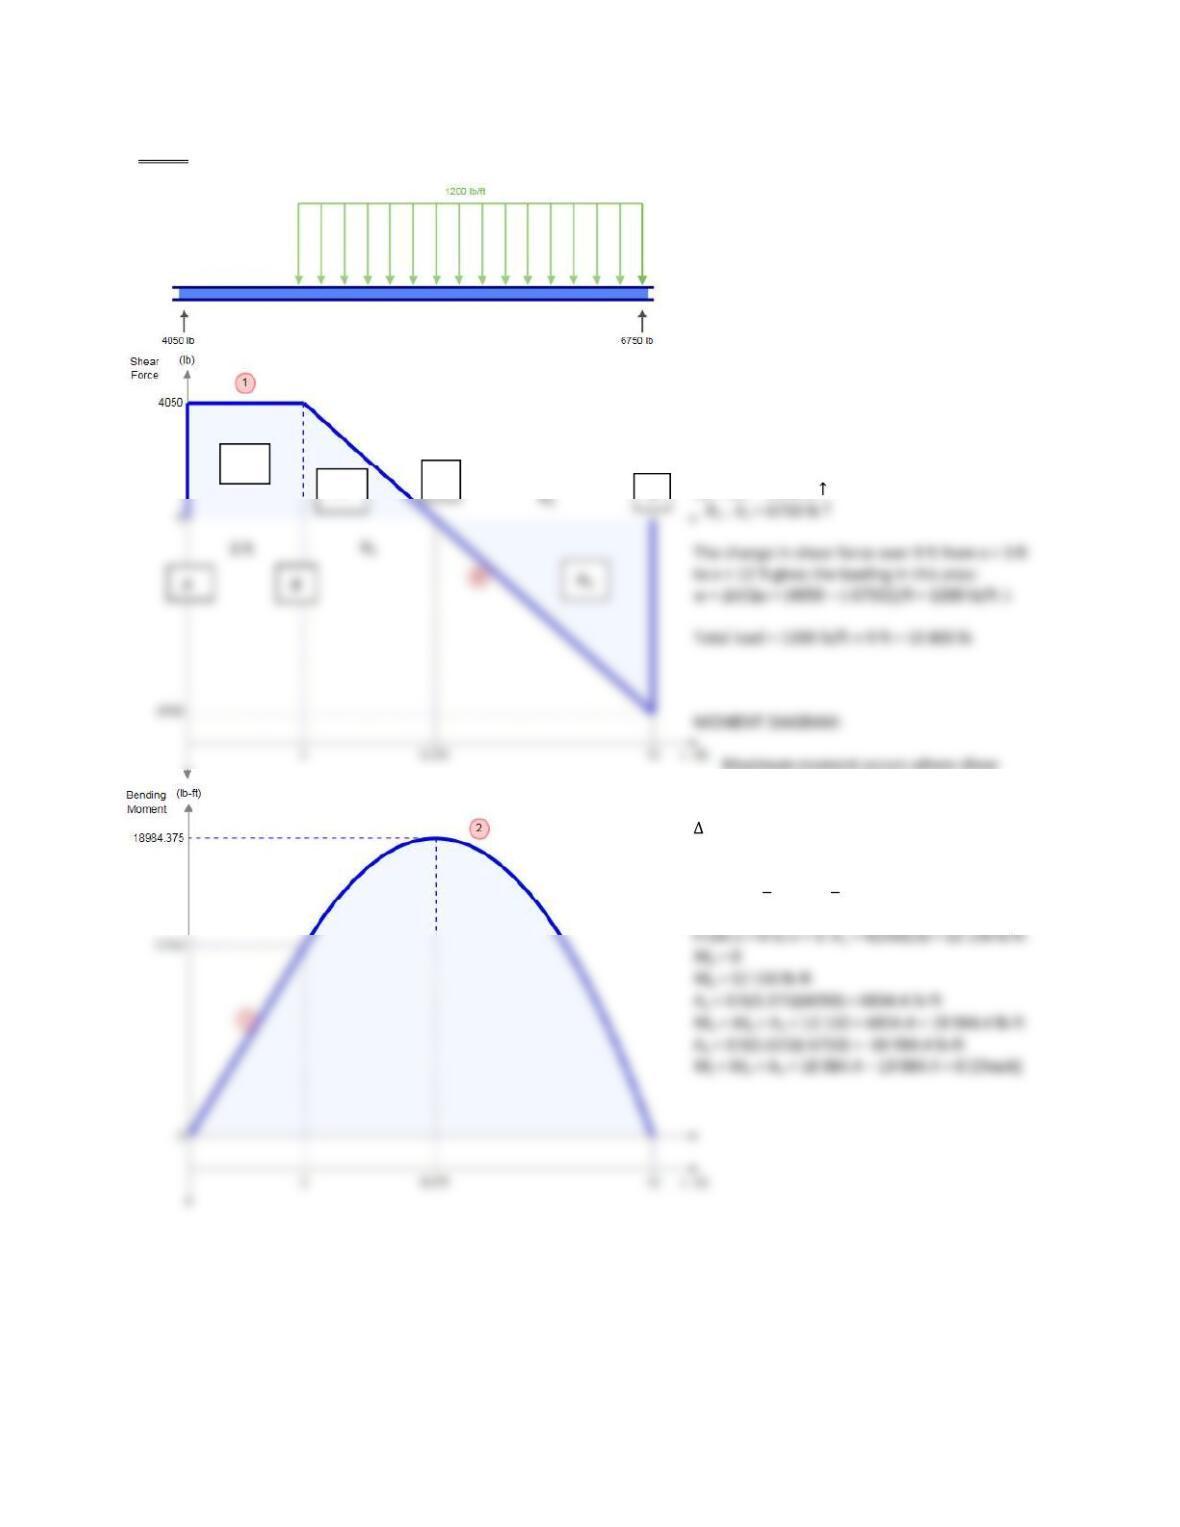
5-115 [Shear force diagram is given.]
The vertically upward changes in shear force
at x = 0 and x = 12 ft indicate simple supports
at those locations.
No change in shear between x = 0 and x = 12 ft
Indicates no load applied in that segment.
The linearly decreasing shear force between
x = 3 and x = 12 indicates a uniformly distributed
load in that segment.
REACTIONS AND LOADING:
RA = VA = 4050 lb
force curve crosses the x-axis.
V = 4050 lb, decreasing at w =1200 lb/ft
x1 = (4050 lb)/(1200 lb/ft) = 3.375 ft
x2 = 9.0 ft x1 = 9.0 3.375 = 5.625 ft
C
D
A1
A2
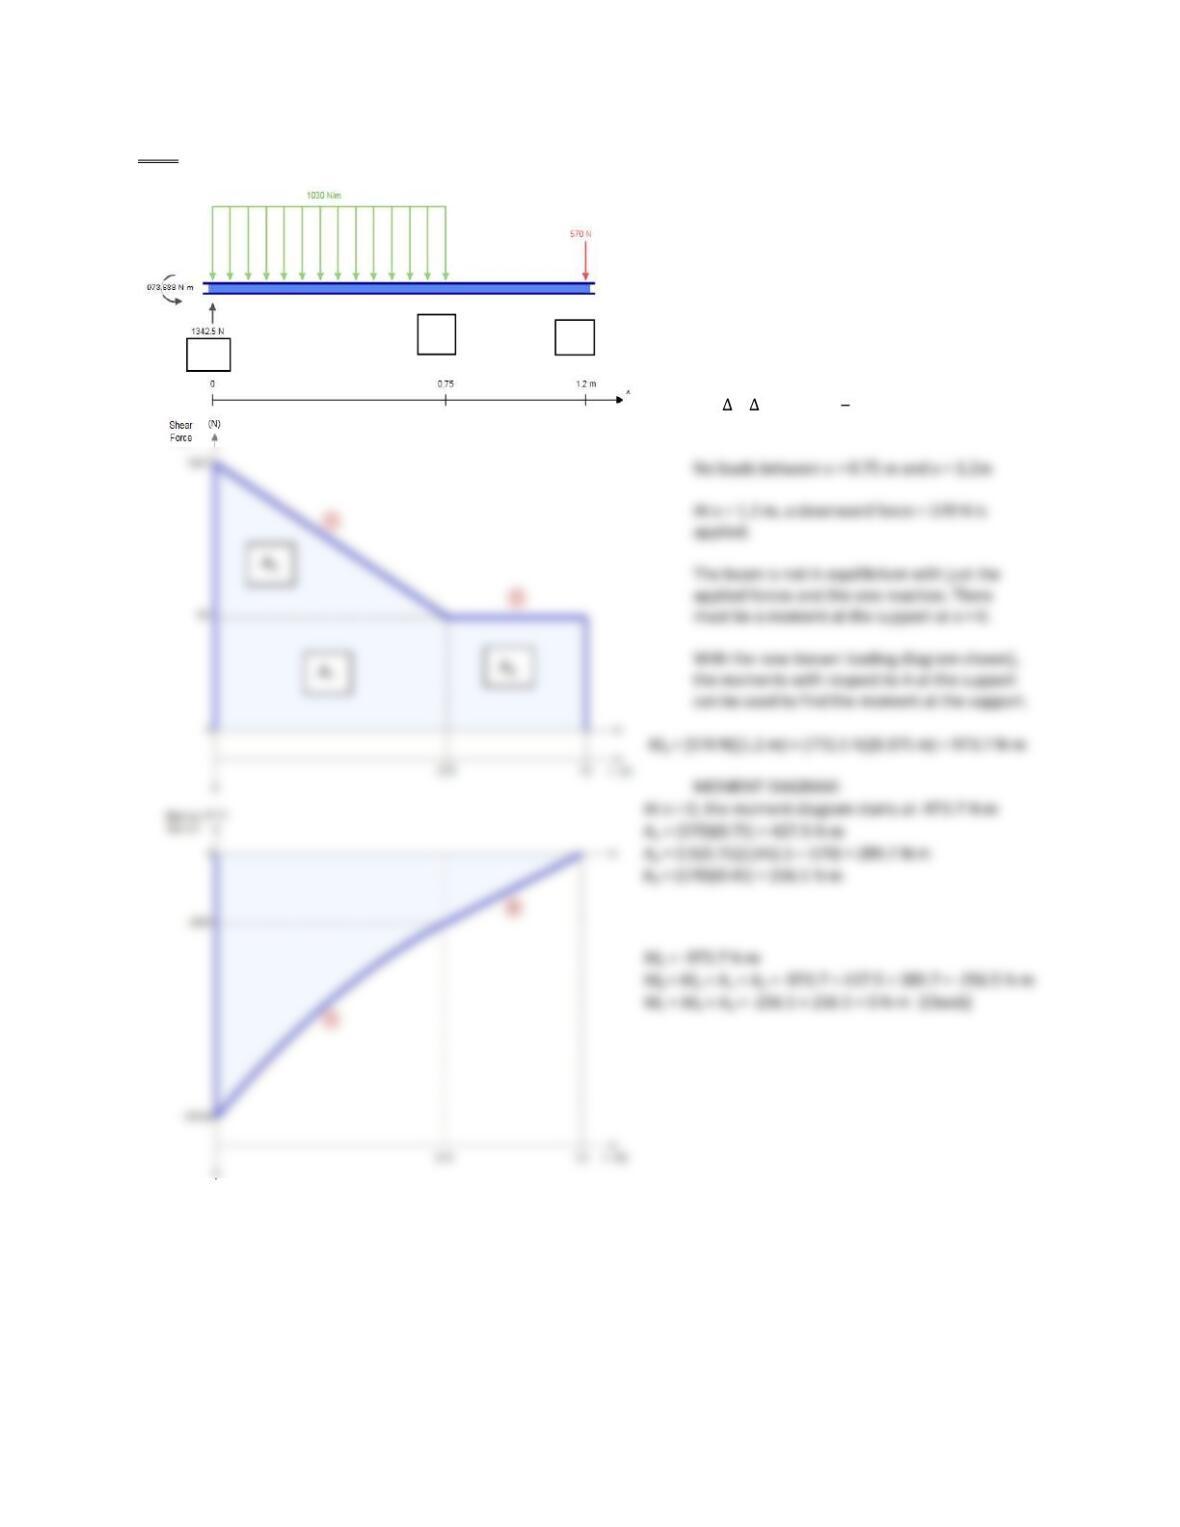
5-116 [Shear force diagram is given.]
Using observations from Problems 5-113
and 5-114, this is a cantilever beam with
a uniformly distributed load over the span
from x = 0 to x = 0.75 m. There is also a
concentrated downward load at x = 1.2 m.
BEAM LOADING AND REACTIONS:
At x = 0: RA = VA = 1342.5 N
Change in shear from x = 0 to x = 0.75 is w.
w = V/ x = (1342.5 570)(0.75) = 1030 N/m
Total load W = wL = (1030)(0.75) = 772.5 N
A
B
C
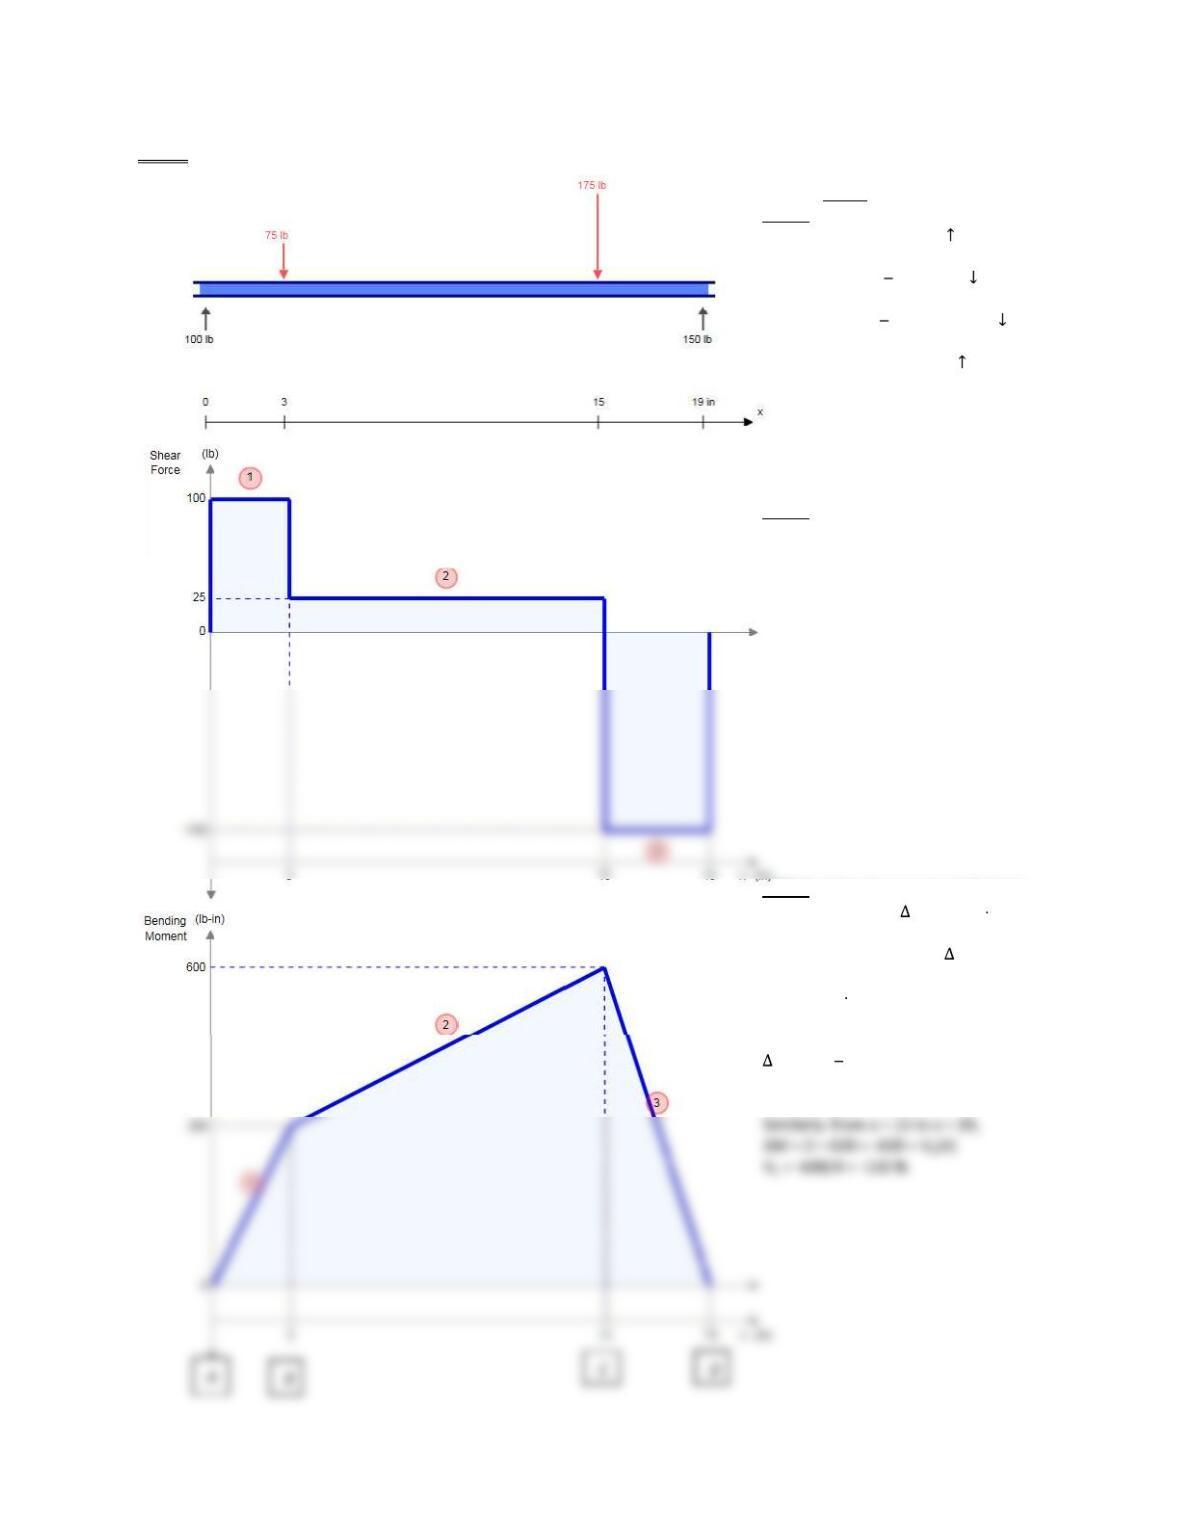
5-117 [Bending Moment Diagram is given. Develop Shear Force Diagram and loading.]
[Start at Step 1 at moment diagram.]
STEP 3:
Reaction At x = 0 is 100 lb
No loads between x = 0 and x = 3.
At x = 3, FB = 100 25 = 75 lb
No loads between x = 3 and x = 15
At x =15, FC = 25 (-150) = 175 lb
No loads between x = 15 and x = 19
Reaction at x = 19 is 150 lb.
STEP 2:
Shear curves drawn as straight lines
at uniform values determined in Step 1.
VA = 100 lb from x = 0 to x = 3
VB = 25 lb from x = 3 to x = 15
VC = -150 lb from x = 15 to x = 19
STEP 1: Using given moment diagram.
From x = 0 to x = 3, M = 300 lb in
Uniform slope of M-curve indicates
constant value of V. Also, M = area
under shear curve = VA(3 in). Then,
VA = (300 lb in)/(3 in) = 100 lb.
Similarly: from x = 3 to x = 15,
M = 600 300 = 300 = VB(12)
VB = 300/12 = 25 lb
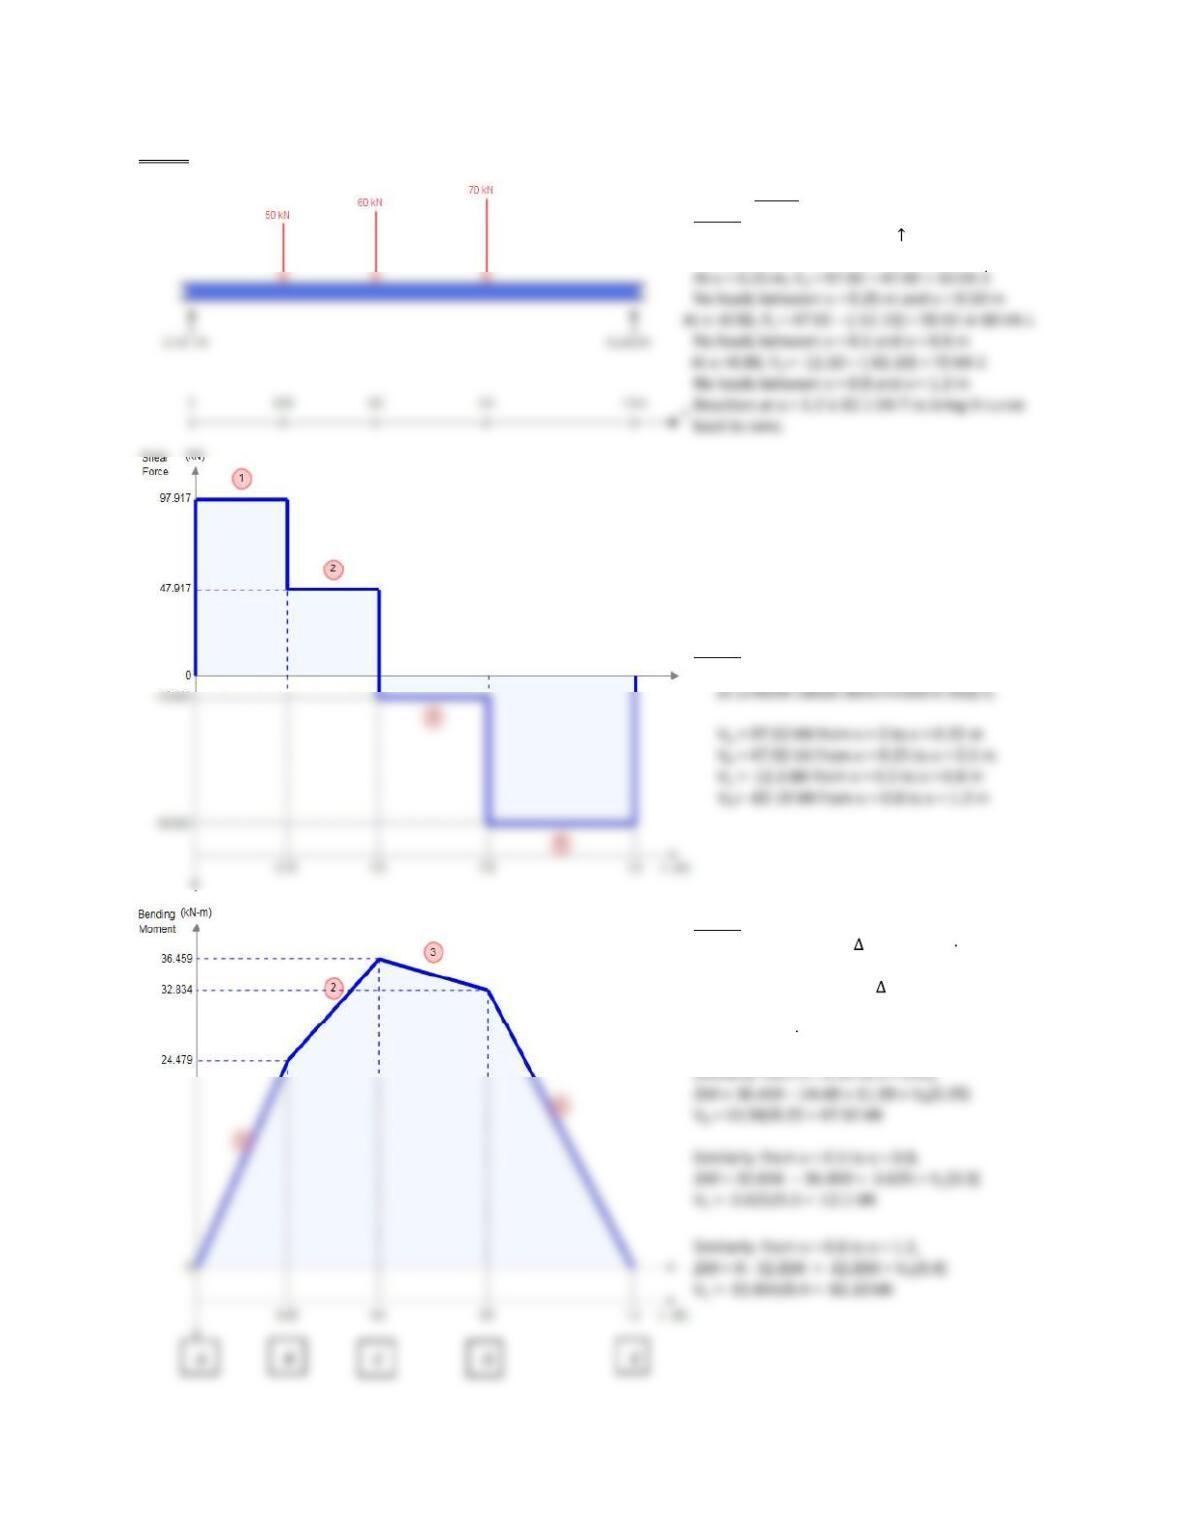
5-118 [Bending Moment Diagram is given. Develop Shear Force Diagram and loading.]
[Start at Step 1 at moment diagram.]
STEP 3:
Reaction At x = 0 is 97.92 kN
No loads between x = 0 and x = 0.25 m.
STEP 2:
Shear curves drawn as straight lines
STEP 1: Using given moment diagram.
From x = 0 to x = 0.25, M = 24.48kN m
Uniform slope of M-curve indicates
constant value of V. Also, M = area
under shear curve = VA(0.25 m). Then,
VA = (24.48 kN m)/(0.25 m) = 97.92 kN.