4-60
COMPARATIVE ANALYSIS CASE
(a) Both companies are using the multiple-step format in presenting
income statement information. Companies use the multiple-step in–
come statement to recognize additional relationships related to revenues
and expenses. Both companies distinguish between operating and
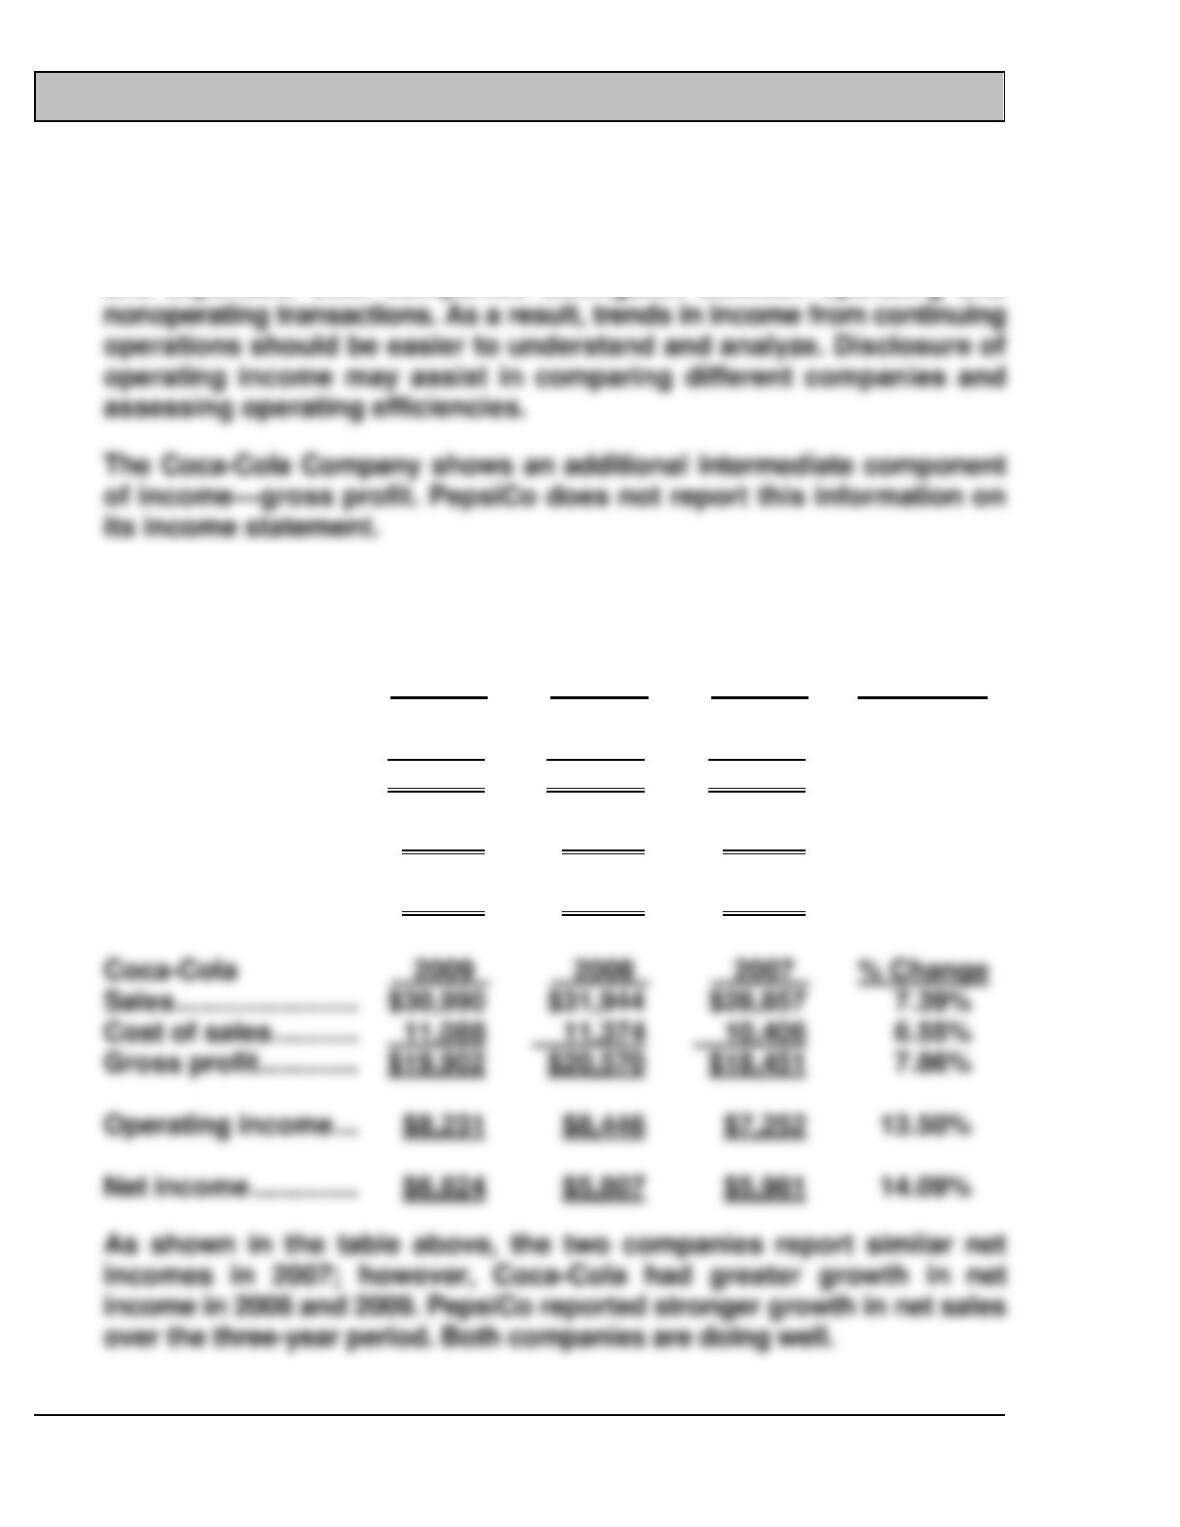
(b) The gross profit, operating profit, and net income for these two companies
are as follows:
PepsiCo
2009
2008
2007
% Change
Sales ………………………….
$43,232
$43,251
$39,474
9.52%
Cost of sales ………………
20,099
20,351
18,038
11.43%
Gross profit ………………..
$23,133
$22,900
$21,436
7.92%
Operating profit ………….
$8,044
$6,959
$7,182
12.00%
Net income …………………
$5,946
$5,142
$5,658
5.09%
Sales ……………………….
$30,990
$31,944
$28,857
7.39%
Cost of sales ……………
11,088
6.55%
Gross profit ……………..
$19,902
$20,570
$18,451
7.86%
Operating income …….
$8,231
$8,446
$7,252
13.50%
Net income ………………
$6,824
$5,807
$5,981
14.09%
4-61
COMPARATIVE ANALYSIS CASE (Continued)
(c) Coca-Cola has reported gains on the equity transactions related to
bottling operations. PepsiCo reported gains on its equity investments.
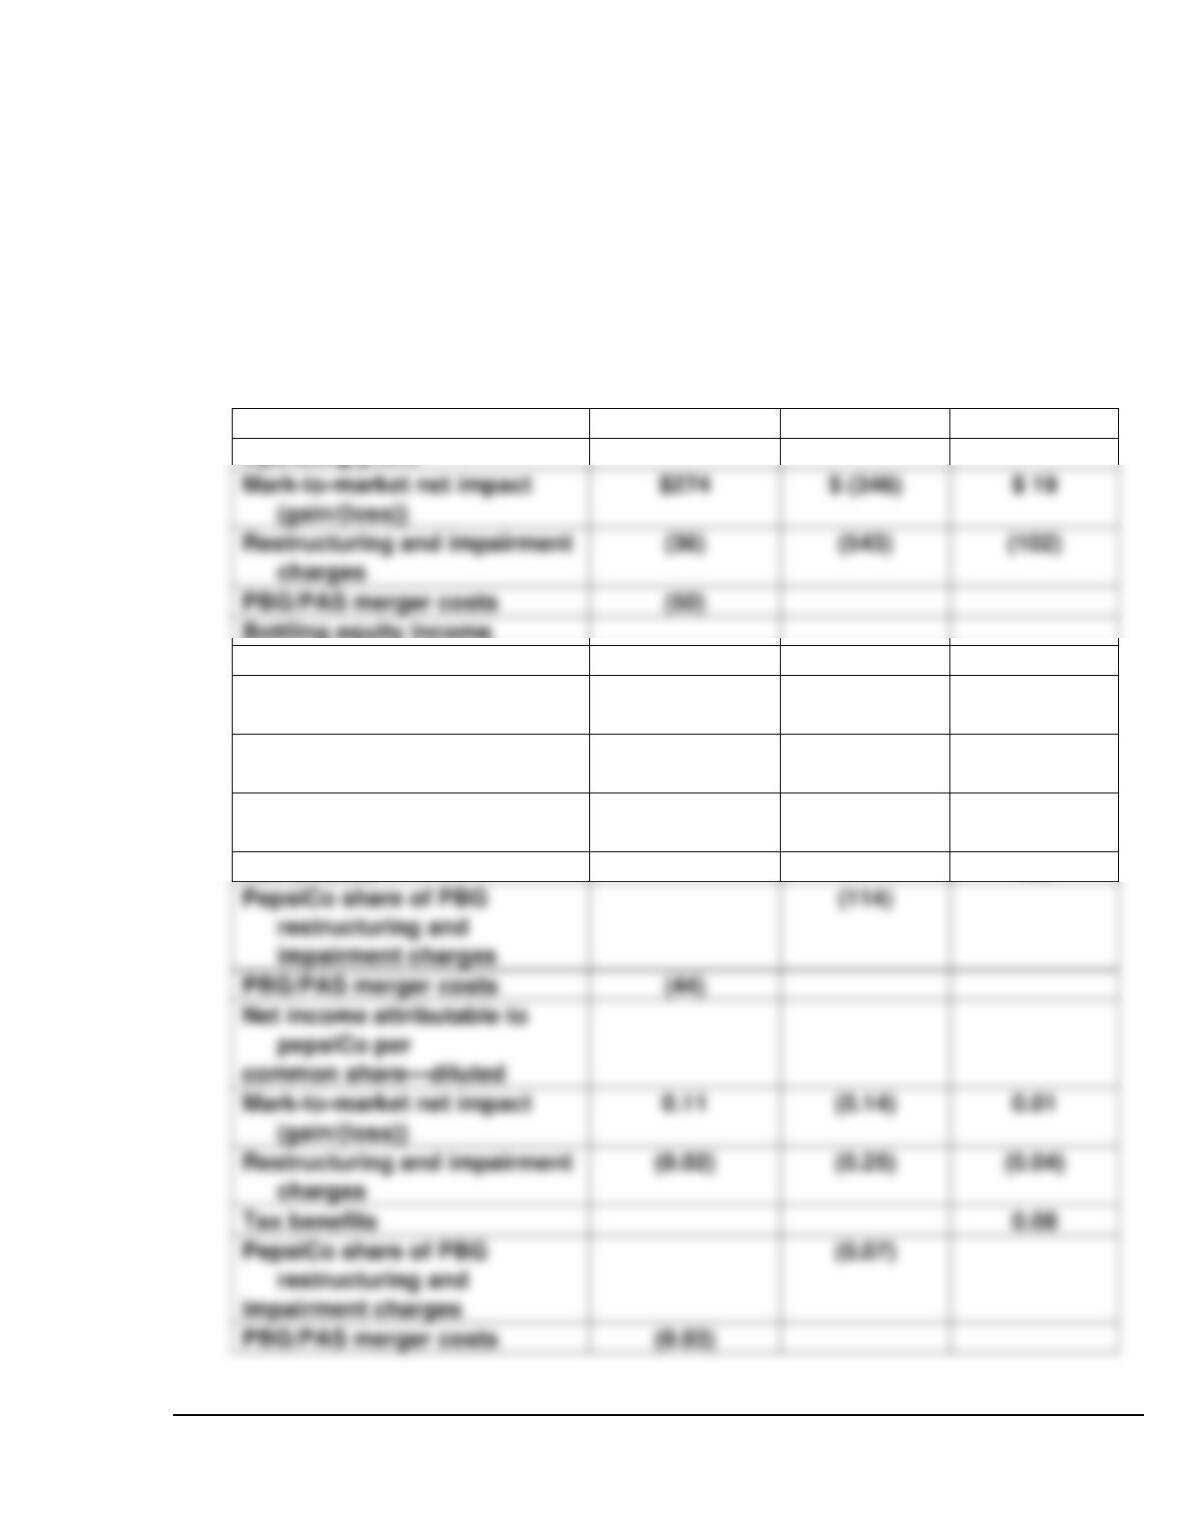
PepsiCo provided the following disclosure for Items Affecting
Comparability:
ITEMS AFFECTING COMPARABILITY
The year-over-year comparisons of our financial results are affected
by the following items:
2009
2008
2007
Operating profit
Bottling equity income
PBG/PAS merger costs
(11)
Net income attributable to
Pepsico
Mark-to-market net impact
(gain/(loss))
173
(223)
12
Restructuring and impairment
charges
(29)
(408)
(70)
Tax benefits
129
impairment charges
PBG/PAS merger costs
(44)
Restructuring and impairment
charges
Tax benefits
impairment charges
PBG/PAS merger costs
Mark-to-market net impact
(gain/(loss))
Restructuring and impairment
charges
(36)
(543)
(102)
PBG/PAS merger costs
(50)
4-62
COMPARATIVE ANALYSIS CASE (Continued)
Mark-to-Market Net Impact
We centrally manage commodity derivatives on behalf of our
divisions. These commodity derivatives include energy, fruit and
other raw materials. Certain of these commodity derivatives do not
In 2009, we recognized $274 million ($173 million after-tax or $0.11 per
share) of mark-to-market net gains on commodity hedges in corporate
unallocated expenses.
In 2008, we recognized $346 million ($223 million after-tax or $0.14 per
share) of mark-to-market net losses on commodity hedges in
corporate unallocated expenses.
In 2009, we incurred a charge of $36 million ($29 million after-tax or
$0.02 per share) in conjunction with our Productivity for Growth
program that began in 2008. The program includes actions in all
divisions of the business, including the closure of six plants that we
4-63
COMPARATIVE ANALYSIS CASE (Continued)
In 2007, we incurred a charge of $102 million ($70 million after-tax or
$0.04 per share) in conjunction with restructuring actions primarily to
close certain plants and rationalize other production lines.
In 2008, PBG implemented a restructuring initiative across all of its
geographic segments. In addition, PBG recognized an asset impairment
charge related to its business in Mexico. Consequently, a non-cash
charge of $138 million was included in bottling equity income ($114
million after-tax or $0.07 per share) as part of recording our share of
PBG’s financial results.
4-64
FINANCIAL STATEMENT ANALYSIS CASE 1
(a) Depending on the company chosen, student answers will vary. Given
the ready availability, the analysis for Walgreens is provided below:
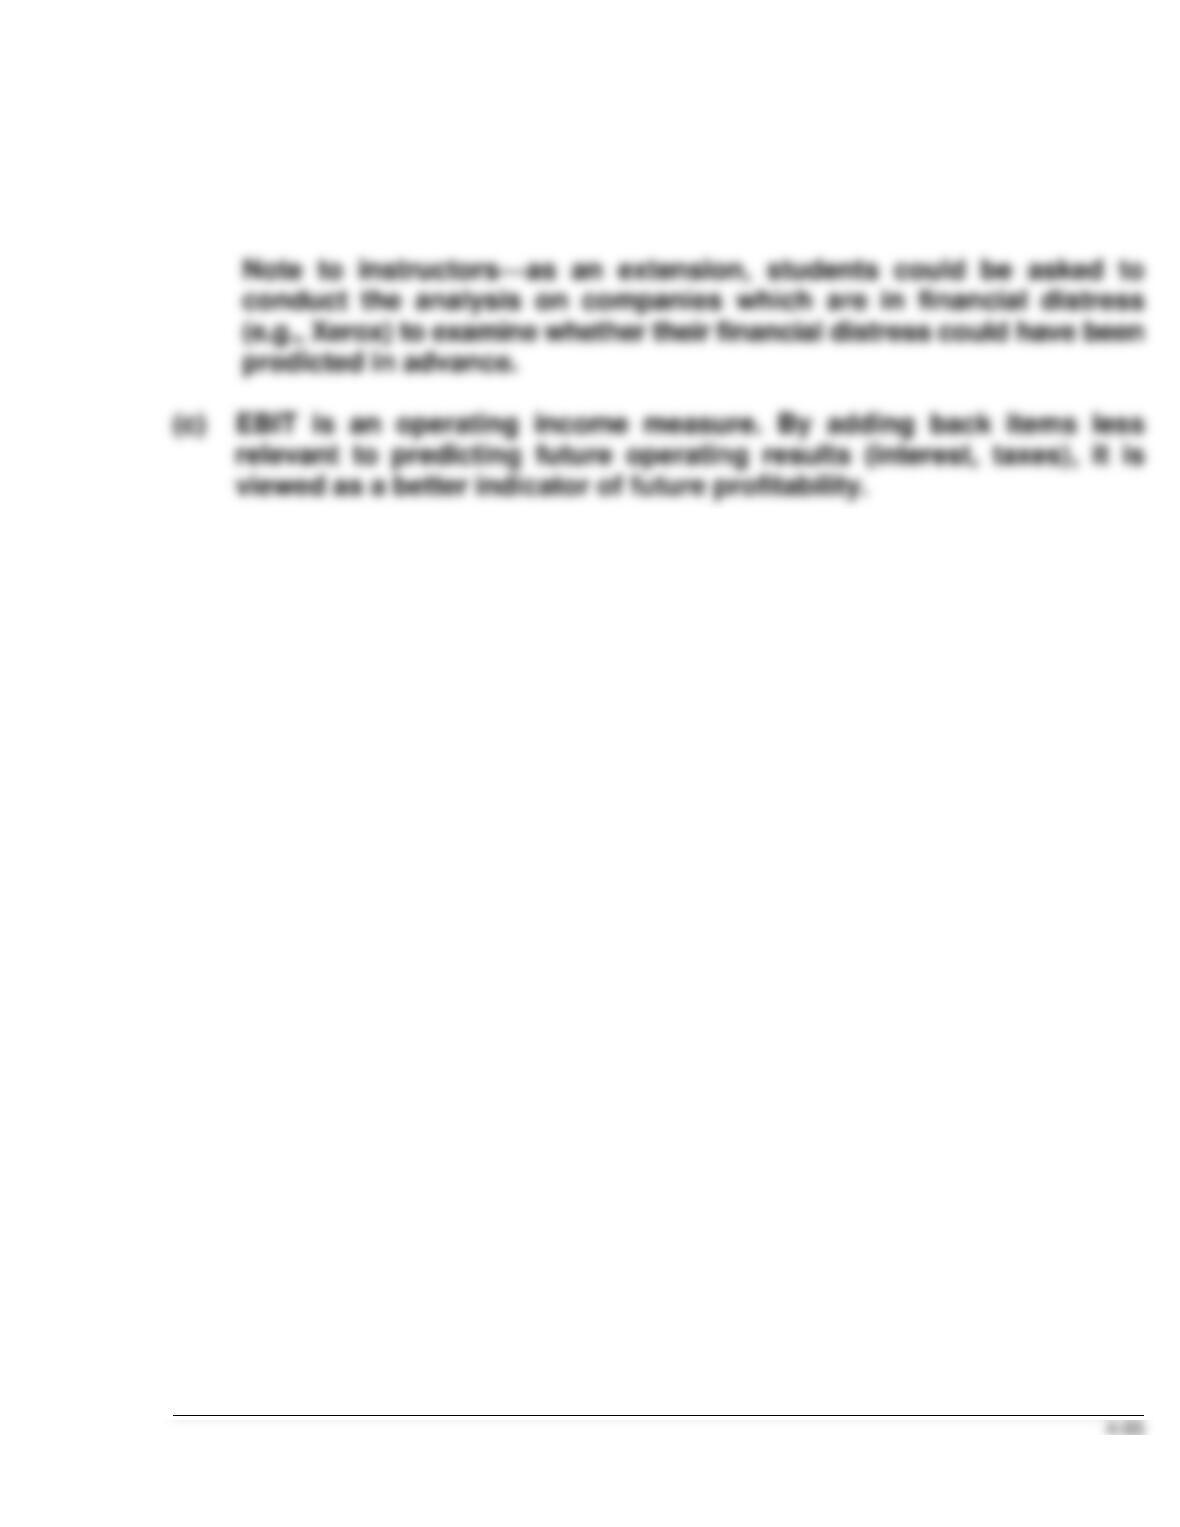
Z-Score Analysis
Walgreens ($000,000)
2009
Weights
Z-Score
2009
2008
Weights
Z-Score
2008
Total Assets
$25,142
$22,410
Current Assets
12,049
10,433
Current Liabilities
6,769
6,644
Working Capital
5,280
3,789
Working Capital/Assets
0.210
X 1.2
=
0.252
0.169
X 1.2
=
Retained Earnings
$15,327
$13,792
EBIT
$ 3,247
$ 3,441
EBIT/Assets
0.129
X 3.3
=
0.426
0.154
X 3.3
=
0.508
Sales
$63,335
$59,034
Sales/Assets
2.519
X 0.99
=
2.494
2.634
X 0.99
=
2.608
MV Equity*
$33,492
$36,036
Total Liabilities
10,766
9,541
MV Equity/Total
Liabilities
3.111
X 0.6
=
1.867
3.777
X 0.6
=
2.266
Total
=
5.893
Total
=
6.446
*Market Price X Shares Outstanding
Market Price
$ 33.88
$ 36.43
Shares Outstanding
988.56
989.18
Total Equity
$33,492
$36,036
FINANCIAL STATEMENT ANALYSIS CASE 1 (Continued)
(b) Walgreens’ Z-score in 2009 has declined but is still above the cutoff
score for companies that are unlikely to fail. The company has only
improved with respect to working capital in 2009, compared to 2006.
4-66
FINANCIAL STATEMENT ANALYSIS CASE 2
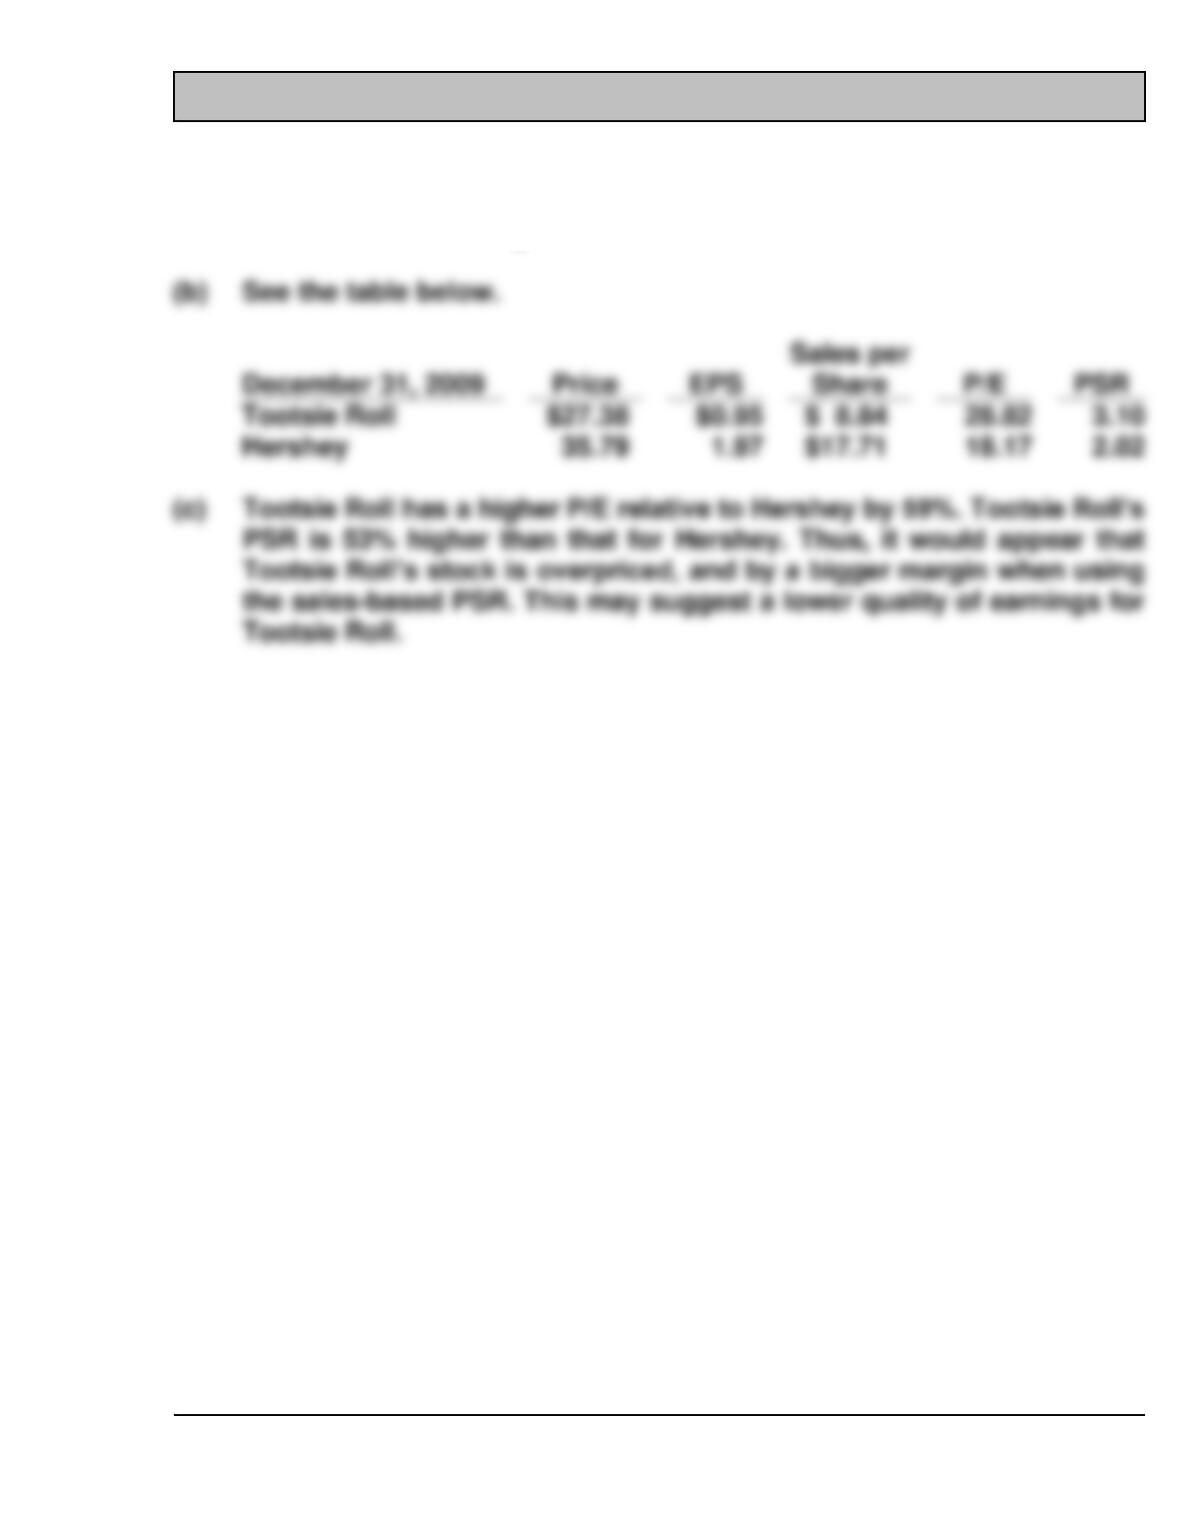
Earnings (loss) per common share
Earnings from continuing operations
($97,700,000 ÷ 177,636,000) ……………………………………….
$0.55
Discontinued operations………………………………………………….
Extraordinary items ……………………………………………………….
4-67
FINANCIAL STATEMENT ANALYSIS CASE 3
(a) Assumptions and estimates related to items such as bad debt expense,
warranties, or the useful lives or residual values for fixed assets could
result in income being overstated.
4-68
ACCOUNTING, ANALYSIS, AND PRINCIPLES
Accounting
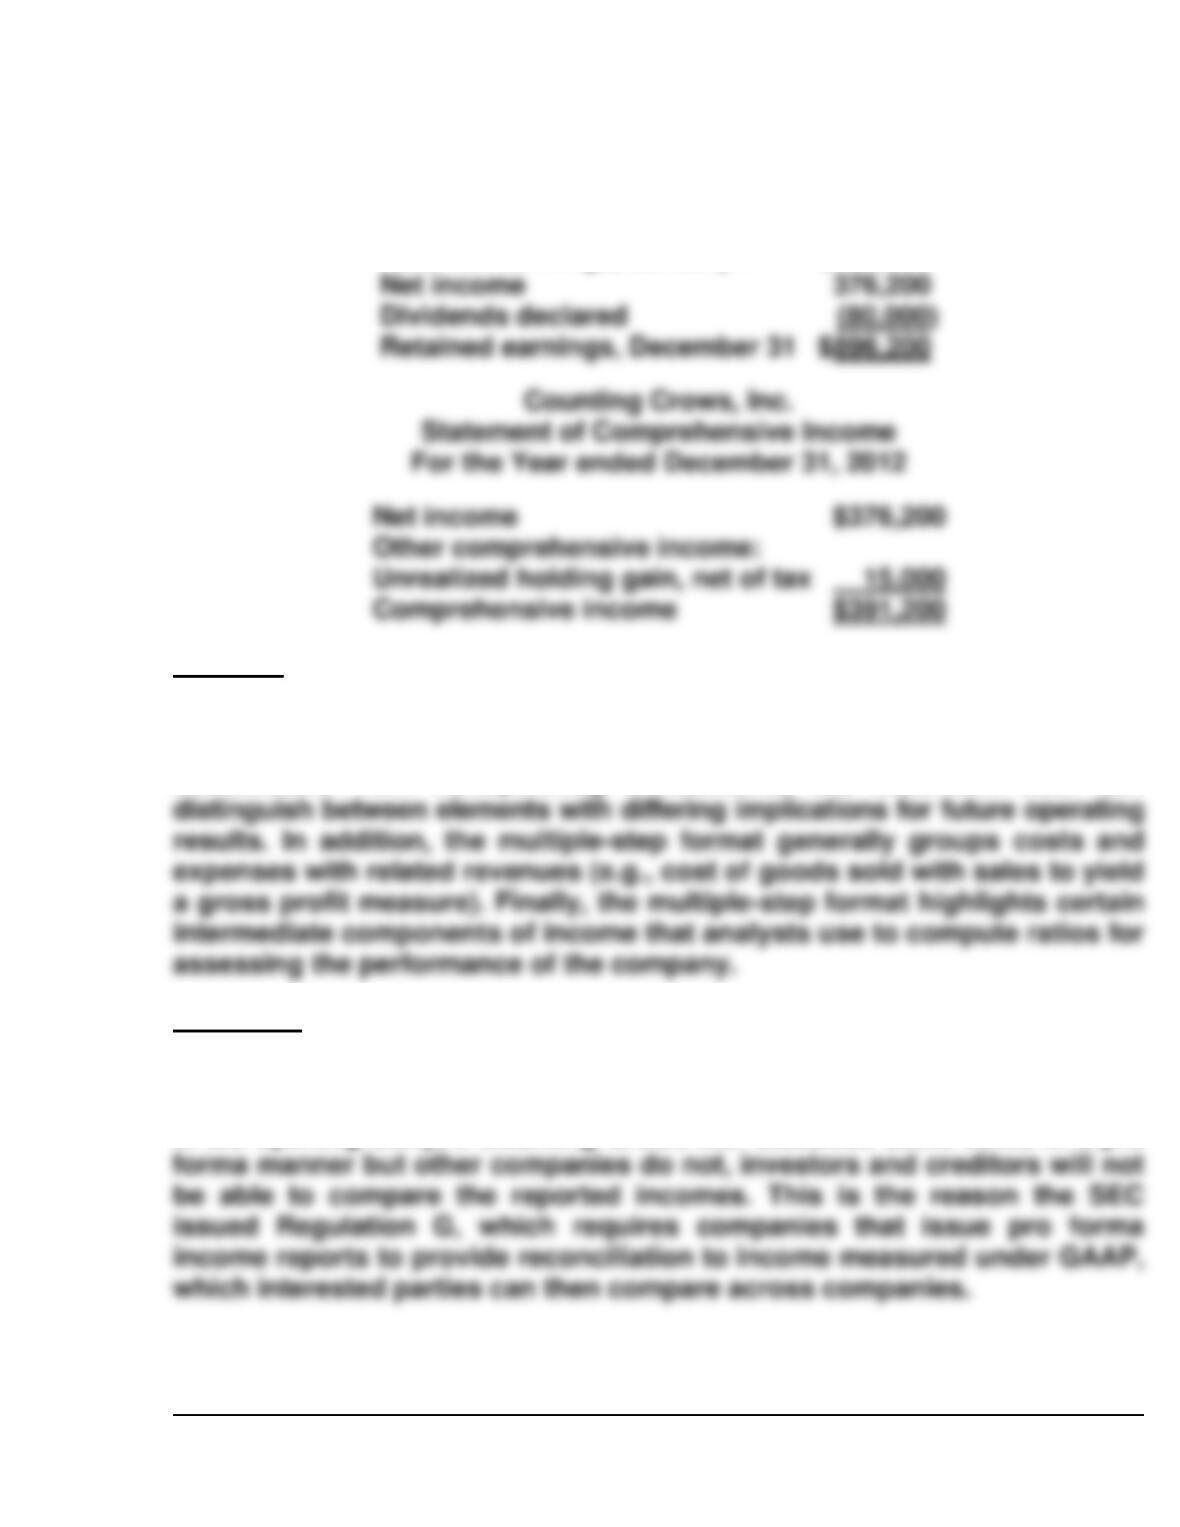
Counting Crows, Inc.
Statement of Income
For the Year Ending December 31, 2012
Revenues
Expenses
Cost of goods sold
850,000
Selling expenses
300,000
Administrative expenses
240,000
Income tax expense
187,000
Total expenses
Income from continuing operations
363,000
Discontinued operations
Loss on discontinued operations
$75,000
Less: Applicable income tax reduction
Income before extraordinary items
313,500
Extraordinary items:
Less: Applicable income tax
Net income
Per share of common stock:
Income from continuing operations ($363,000 ÷
100,000)
$3.63
Loss on discontinued operations, net of tax
(0.50)
Income before extraordinary items ($313,500 ÷
100,000)
3.13
Extraordinary gain, net of tax
Net income ($376,200 ÷ 100,000)
Sales revenue
$1,900,000
Rent revenue
40,000
4-69
ACCOUNTING, ANALYSIS, AND PRINCIPLES (Continued)
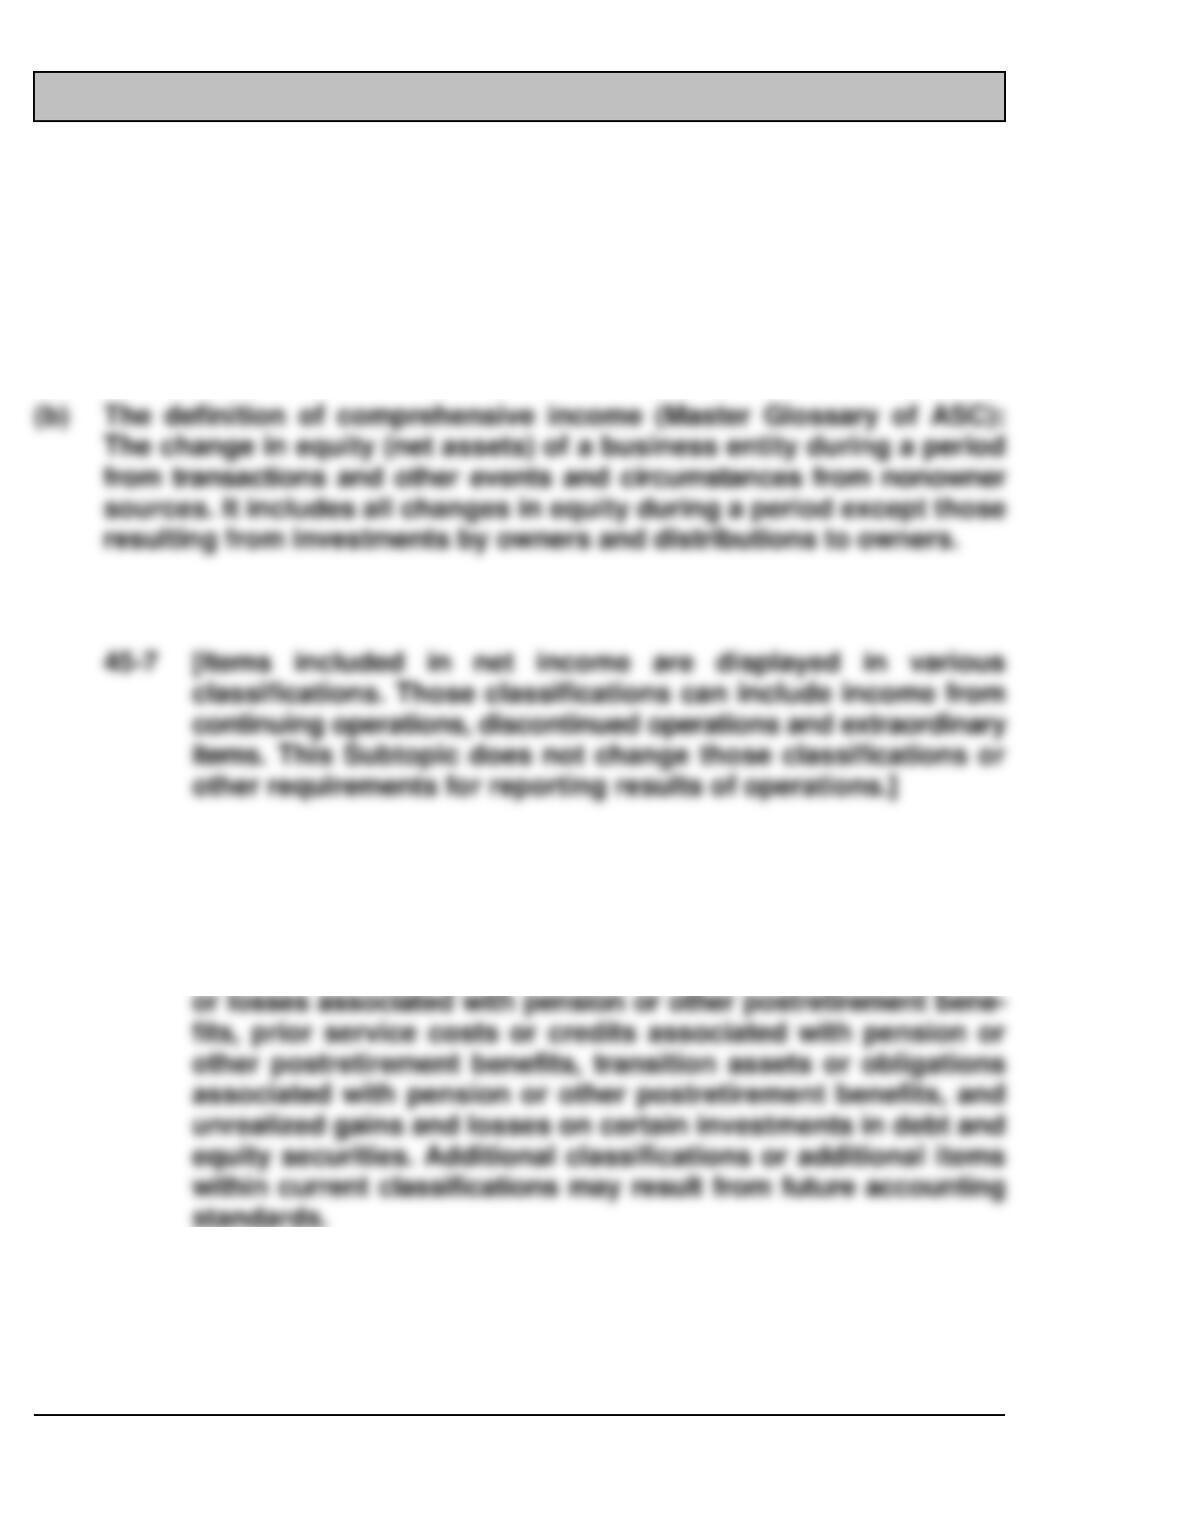
Counting Crows, Inc.
Retained Earnings Statement
For the Year ended December 31, 2012
Retained earnings, January 1
$600,000
Analysis
The multiple-step income statement recognizes important relationships
between income statement elements. For example, by separating operating
transactions from nonoperating transactions, the statement user can
Principles
Pro forma reporting is inconsistent with the conceptual framework’s qualita–
tive characteristic of comparability. For example, similar to the discussion
in the opening story, if Counting Crows Inc. classifies some items in a pro
Retained earnings, December 31
$896,200
Unrealized holding gain, net of tax
15,000
4-70
PROFESSIONAL RESEARCH
(a) FASB ASC 220 – Presentation, Comprehensive Income. The predecessor
standard for this topic is FAS No. 130 Reporting Comprehensive Income
(Issued June, 1997). By following this Codification String: Presentation
> 220 Comprehensive Income > 10 Overall > 5 Background and then
click on Printer-Friendly with sources, FAS 130 is identified; you can
then go to www.fasb.org/st/ to find the issue date.
(c) Classifications within net income and examples (FASB ASC 220-10–45–7):
(d) The classifications within other comprehensive income (220-10–45–13):
45–13 [Items included in other comprehensive income shall be classified
based on their nature. For example, other comprehensive income
shall be classified separately into foreign currency items, gains
4-71
PROFESSIONAL RESEARCH (Continued)
(e) Reclassification adjustments (FASB ASC 220-10–45-15)
45–15 Reclassification adjustments shall be made to avoid double
counting in comprehensive income items that are displayed as
part of net income for a period that also had been displayed
4-72
PROFESSIONAL SIMULATION
Explanation
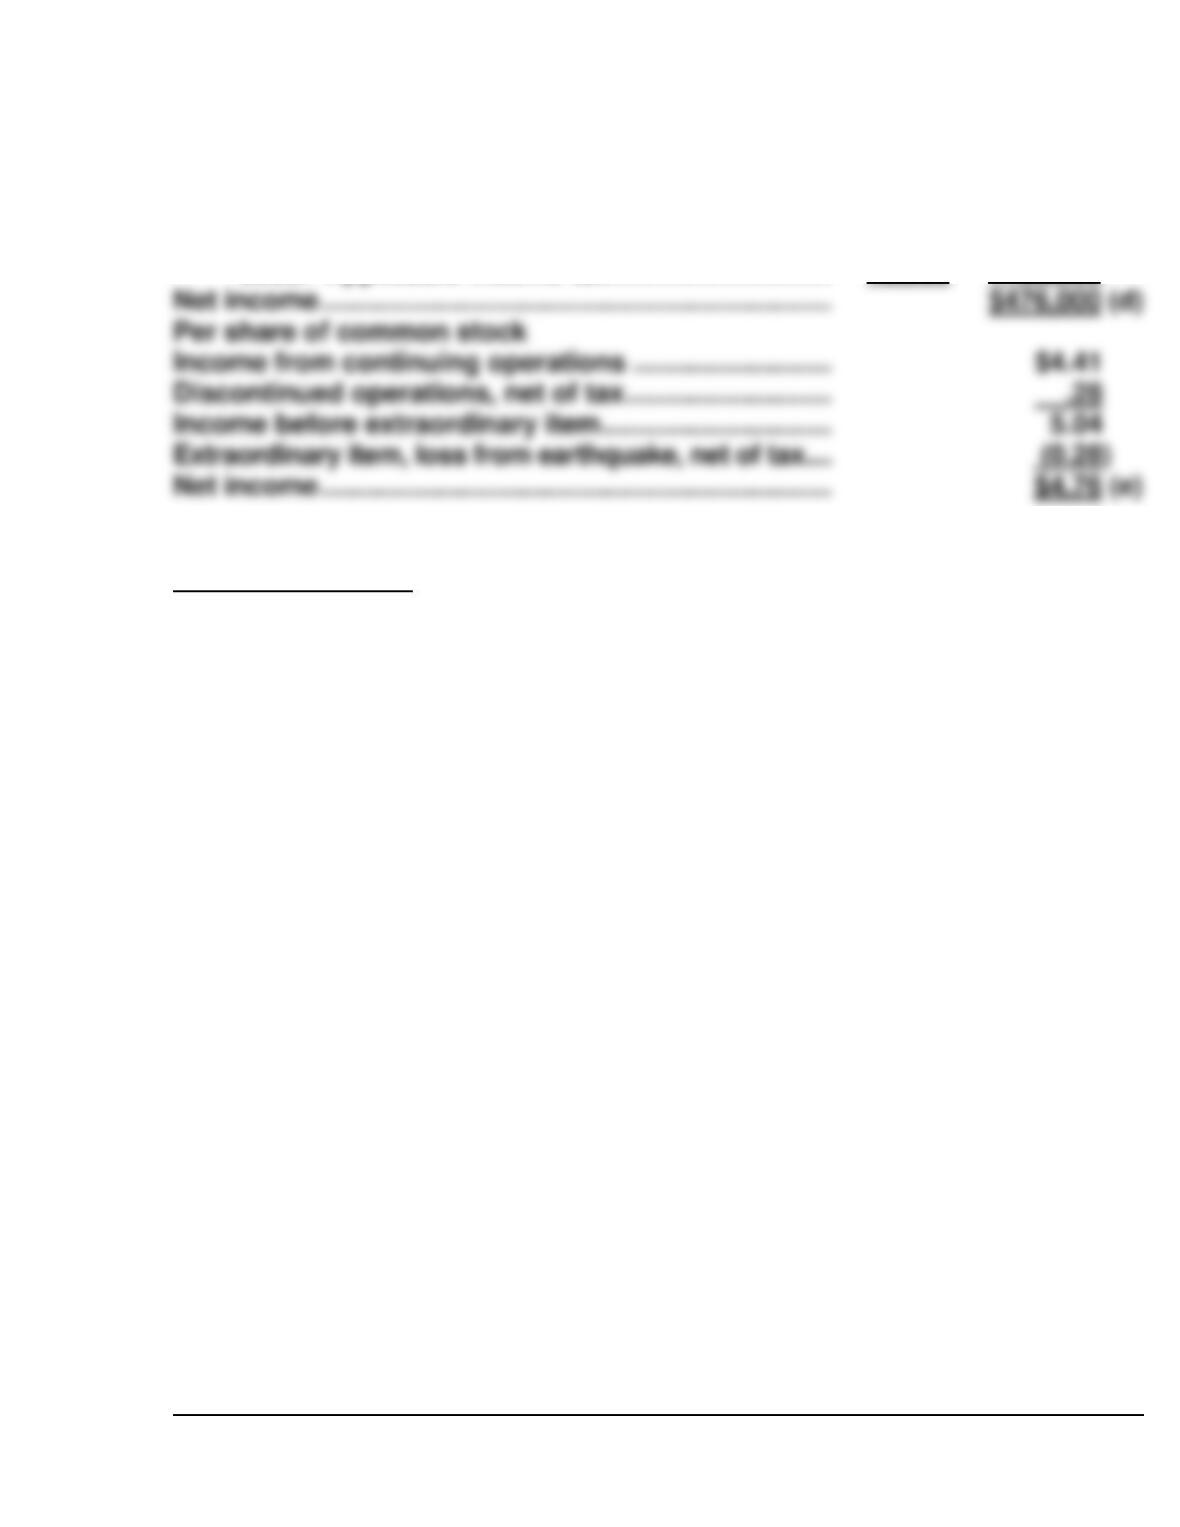
As indicated in the income statement below, the loss on abandonment is
reported as an “other expense and loss.” The gain on disposal of a business
Measurement
Answers are revealed in the income statement below.
JUDE LAW CORPORATION
Income Statement
For the Year Ended December 31, 2012
Sales ………………………………………………………………….
$3,200,000
Cost of goods sold ……………………………………………..
1,920,000
Gross profit ………………………………………………………..
1,280,000 (a)
Selling expenses ………………………………………………..
$340,000
Administrative expenses …………………………………….
280,000
620,000
Income from operations ………………………………………
Other revenues and gains
Interest revenue ……………………………………………
Other expenses and losses
Loss from plant abandonment ………………………
40,000
Income tax (30% X $630,000) ……………………………….
Discontinued operations
Gain on disposal of component of business ….
Less: Applicable income tax ………………………..
63,000
4-73
PROFESSIONAL SIMULATION (Continued)
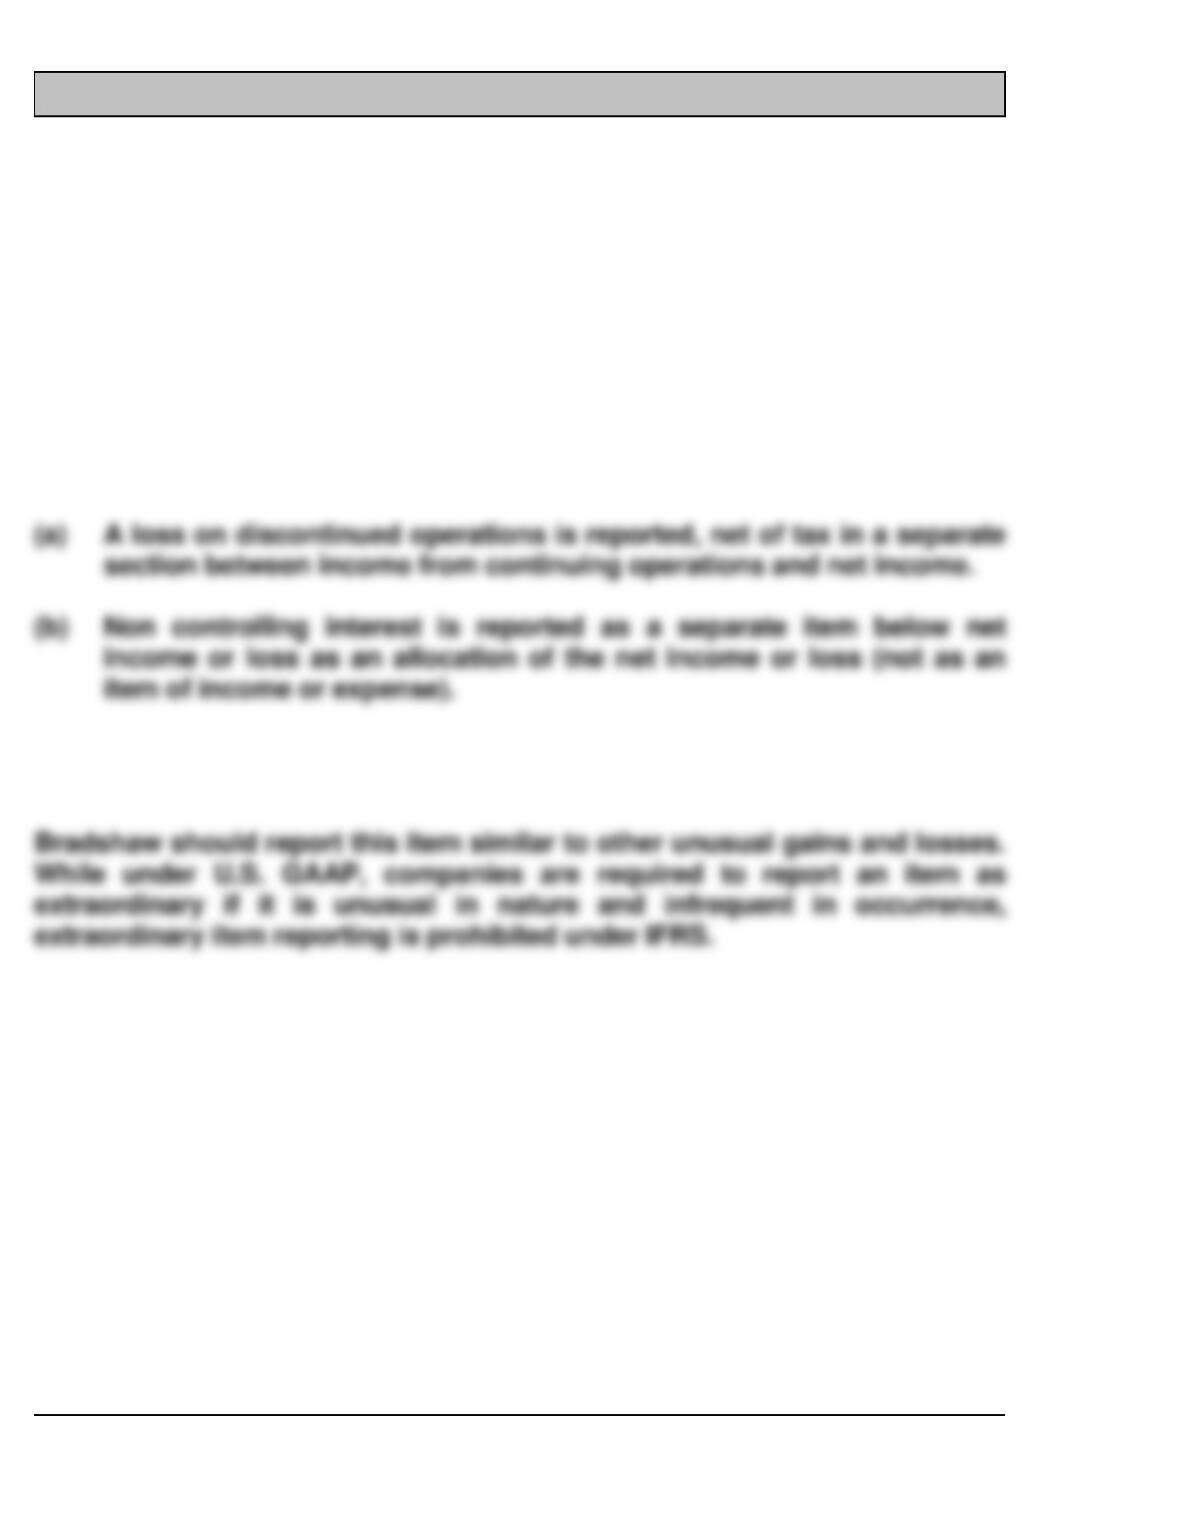
Income before extraordinary item …………………………..
504,000
Extraordinary item
Loss from earthquake ……………………………………….
40,000
Less: Applicable income tax …………………………..
12,000
28,000
Note to instructor: The change for inventory costing is reflected in the
current year’s cost of goods sold. If comparative statements are presented,
prior year’s income statements would be recast as under the new method.
The cumulative effect of the change in accounting principle is shown as an
adjustment to beginning retained earnings.
Net income …………………………..…………………………………..
Per share of common stock
Income from continuing operations …………………………..
Discontinued operations, net of tax …………………………..
Income before extraordinary item …………………………..
Extraordinary item, loss from earthquake, net of tax……….
Net income …………………………..…………………………………..
4-74
IFRS CONCEPTS AND APPLICATION
IFRS4-1
Companies are required to present an analysis of expenses classified
either by their nature (such as cost of materials used, direct labor incurred,
delivery expense, advertising expense, employee benefits, depreciation
expense, and amortization expense) or their function (such as cost of
goods sold, selling expenses, and administrative expenses).
IFRS4-2
IFRS4-3
4-75
IFRS4-4
Sales revenue …………………………..…………………………..
$310,000
Cost of goods sold ……………………………………………………….
140,000
Selling and administrative expenses …………………………..
50,000
Net income ……………………………………………………….
$132,000
(b)
Attributable to:
Controlling shareholders ………………………………………………
92,000
(c)
Non–controlling interest ………………………………………………..
(40,000)
$137,000
(e)
IFRS4-5
(a) Some of the differences are:
1. Units of currency—Avon reports in pounds sterling and Earnings
per share in pence.
2. Terminology—Interest revenue and expense are referred to as
Gain on sale of plant assets ……………………………………………
Income from operations ………………………………………………….
Interest expense ……………………………………………………….
Income from continuing operations …………………………..
Discontinued operations …………………………………………………
4-76
IFRS4-5 (Continued)
(b) Both the “Exceptional items” and the “Discontinued operations” are
example of irregular items. As in the U.S., these items are included in
IFRS4-6
(a) International Accounting Standard 1, Presentation of Financial
Statements addresses the statement of comprehensive income
reporting. This standard was issued in September 2007 and includes
subsequent amendments resulting from IFRSs issued up to 30
November 2008. Its effective date is 1 January 2009.
4-77
IFRS4-6 (Continued)
Because the effects of an entity’s various activities, transactions and
other events differ in frequency, potential for gain or loss and
predictability, disclosing the components of financial performance
assists users in understanding the financial performance achieved
(d) When items of income or expense are material, an entity shall disclose
their nature and amount separately (Para. 97). Circumstances that
would give rise to the separate disclosure of items of income and
expense include:
a. write-downs of inventories to net realisable value or of property,
plant and equipment to recoverable amount, as well as reversals
of such write-downs;
IFRS4-7
(a) M&S uses a condensed format income statement. This format provides
highlights of a company’s performance without presenting unnecessary
detailed computations.
(d) M&S reports operating profit separately from nonoperating profit
because nonoperating profit is non-recurring and not expected to
arise in the future. In order to make valid comparisons between
companies and years, nonoperating must be reported separately from
operating profit.