25
CHAPTER 4
MOVING AVERAGES AND SMOOTHING METHODS
ANSWERS TO PROBLEMS AND CASES
1. Exponential smoothing
6. a.
t Yt
t
Y
e t et e t
2
t
t
Y
e
t
t
Y
e
1 19.39 19.00 .39 .39 .1521 .020 .020
5 18.43 17.89 .54 .54 .2916 .029 .029
7 19.51 19.98 – .47 .47 .2209 .024 -.024
9 19.78 20.63 – .85 .85 .7225 .043 -.043
11 21.18 21.25 – .07 .07 .0049 .003 -.003
7.
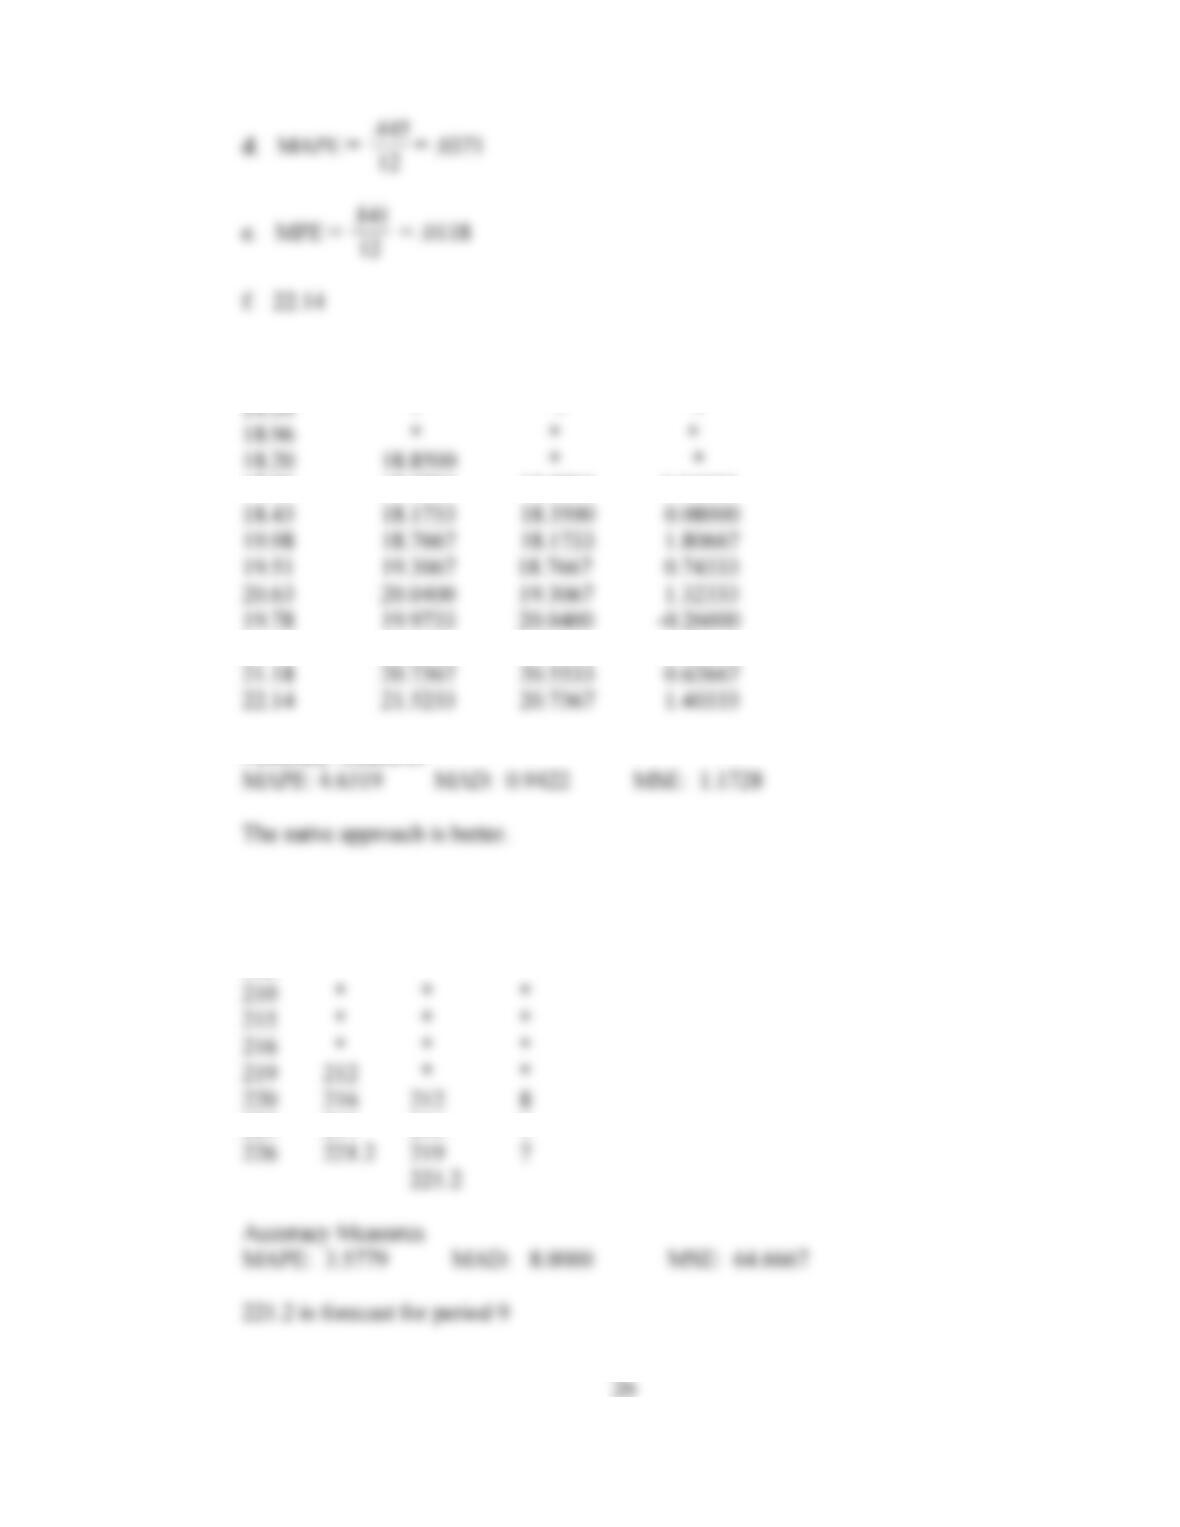
Price AVER1 FITS1 RESI1
17.89 18.3500 18.8500 -0.96000
21.25 20.5533 19.9733 1.27667
Accuracy Measures
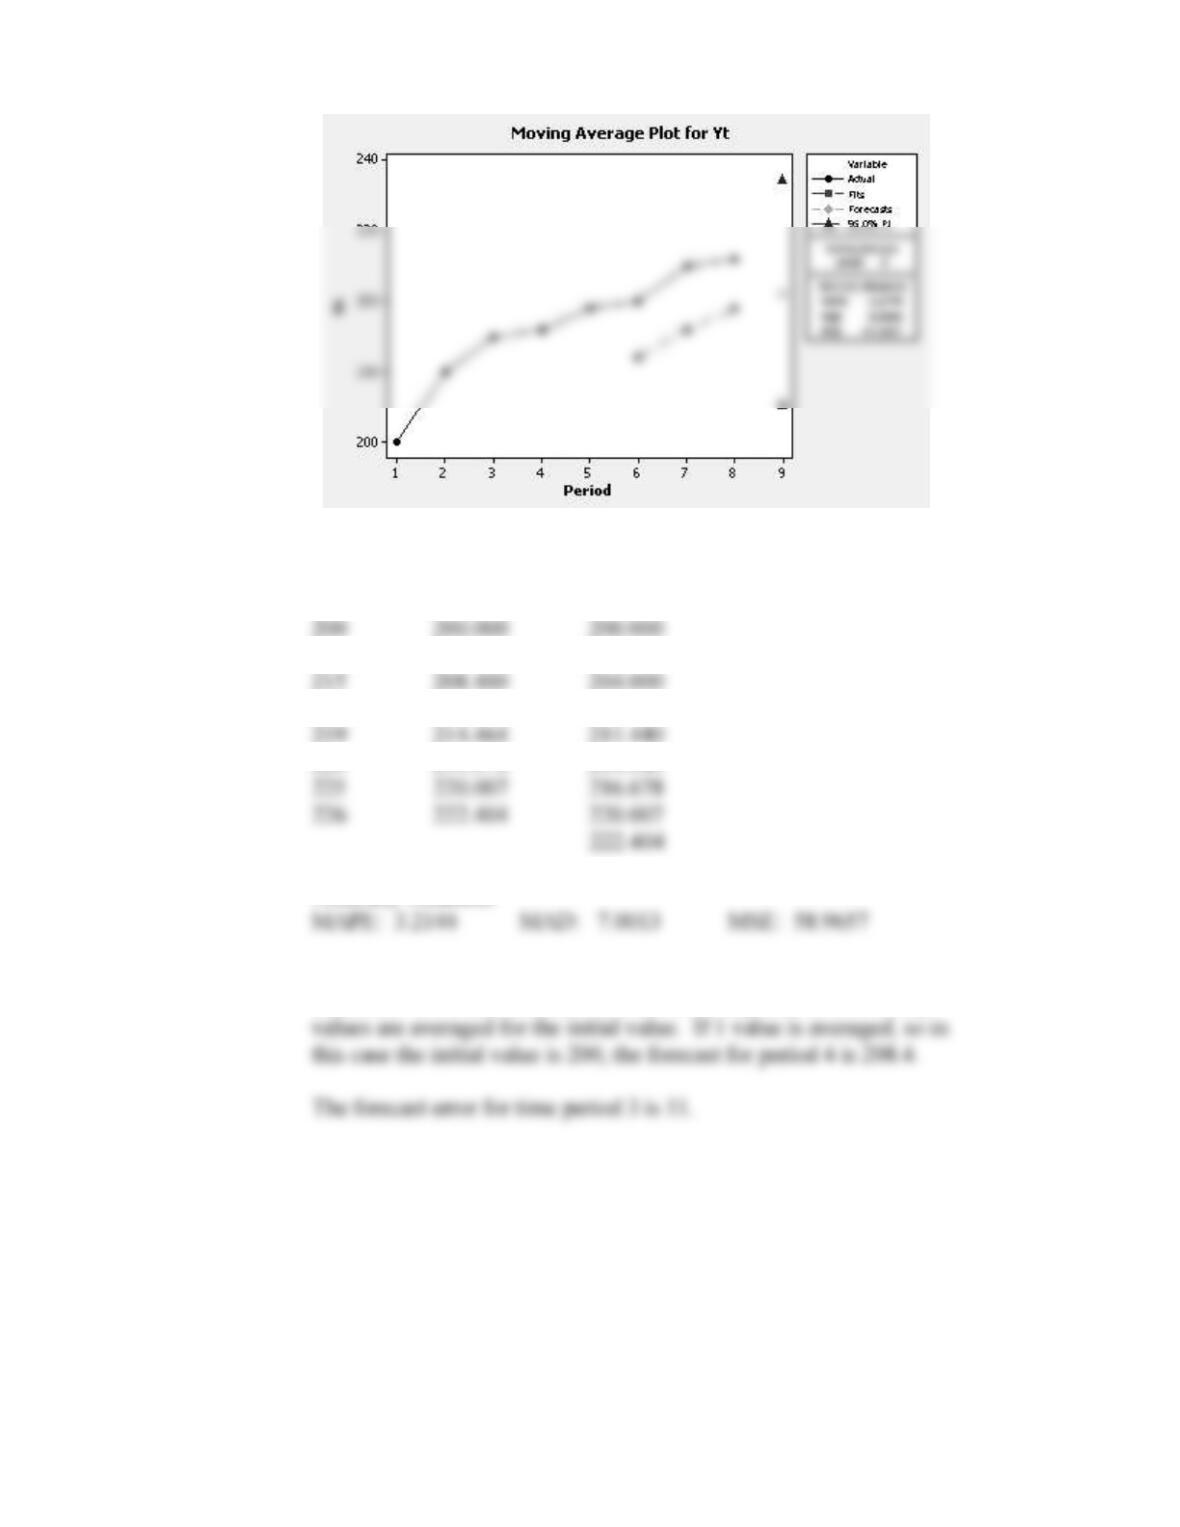
8. a. See plot below.
Yt Avg Fits Res
200 * * *
225 219 216 9
27
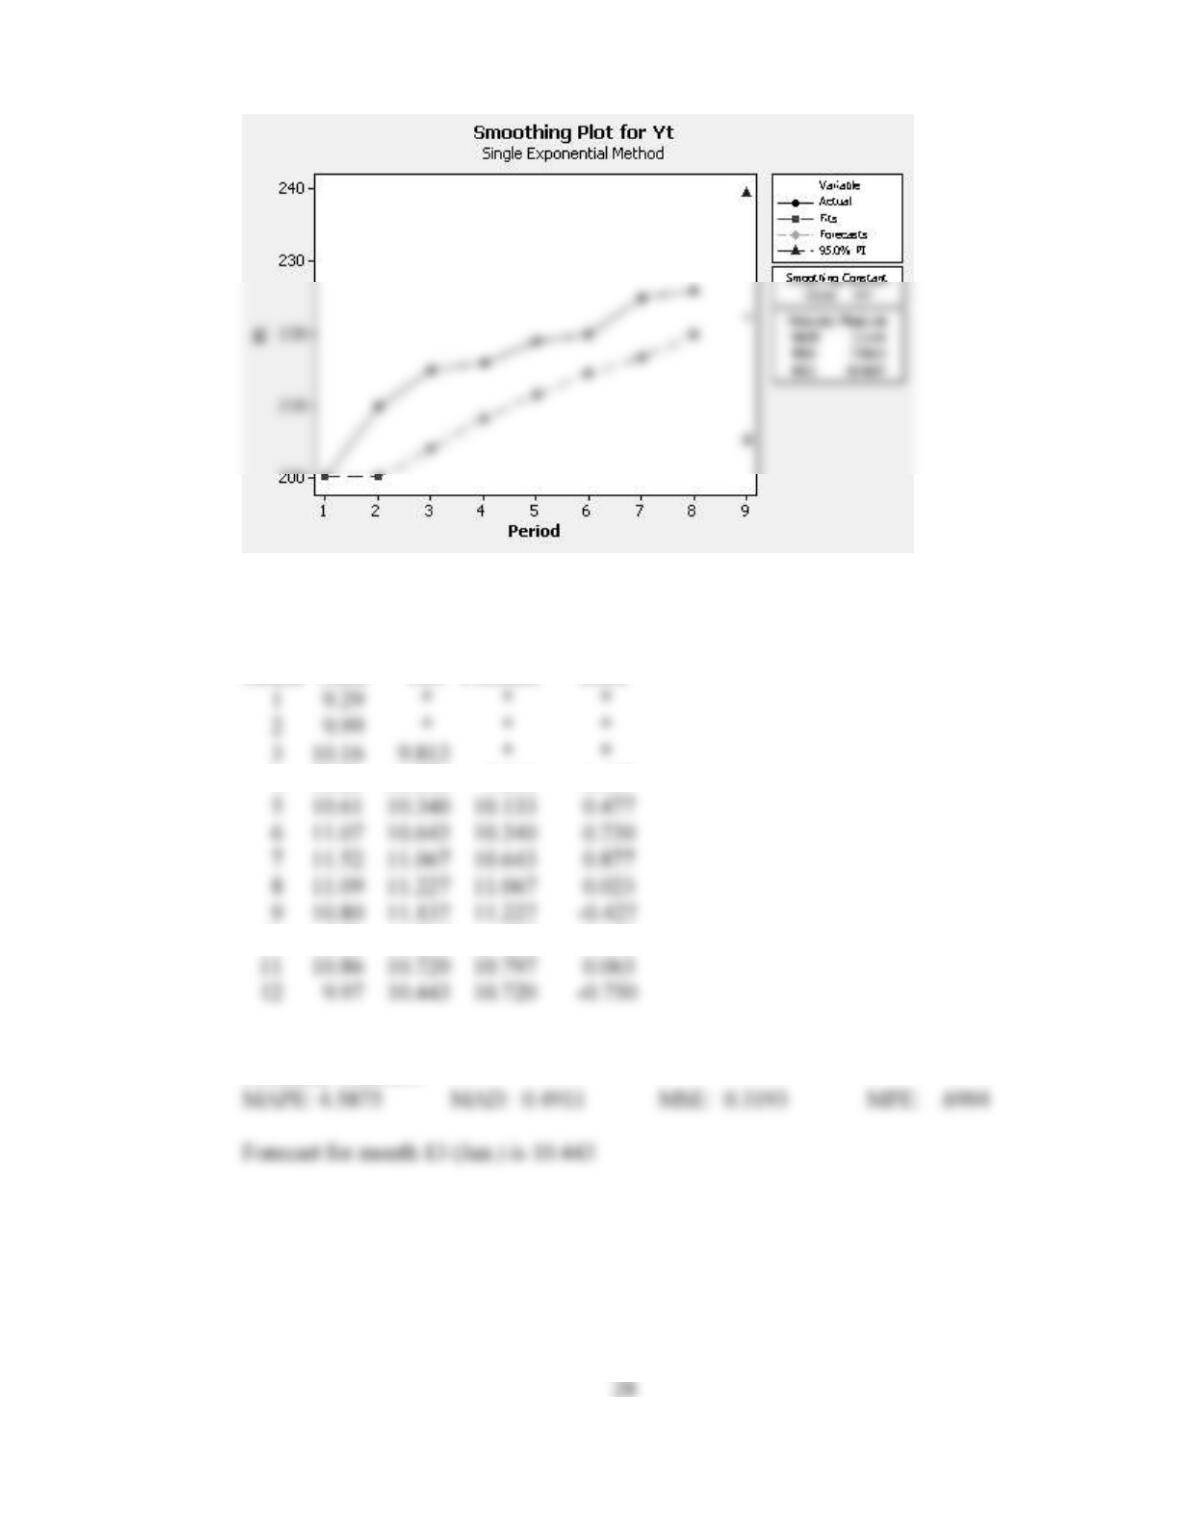
b. & c. See plot below.
Yt Smoothed Forecast
210 204.000 200.000
216 211.440 208.400
220 216.678 214.646
Accuracy Measures
Caution: If Minitab is used, the final result depends on how many
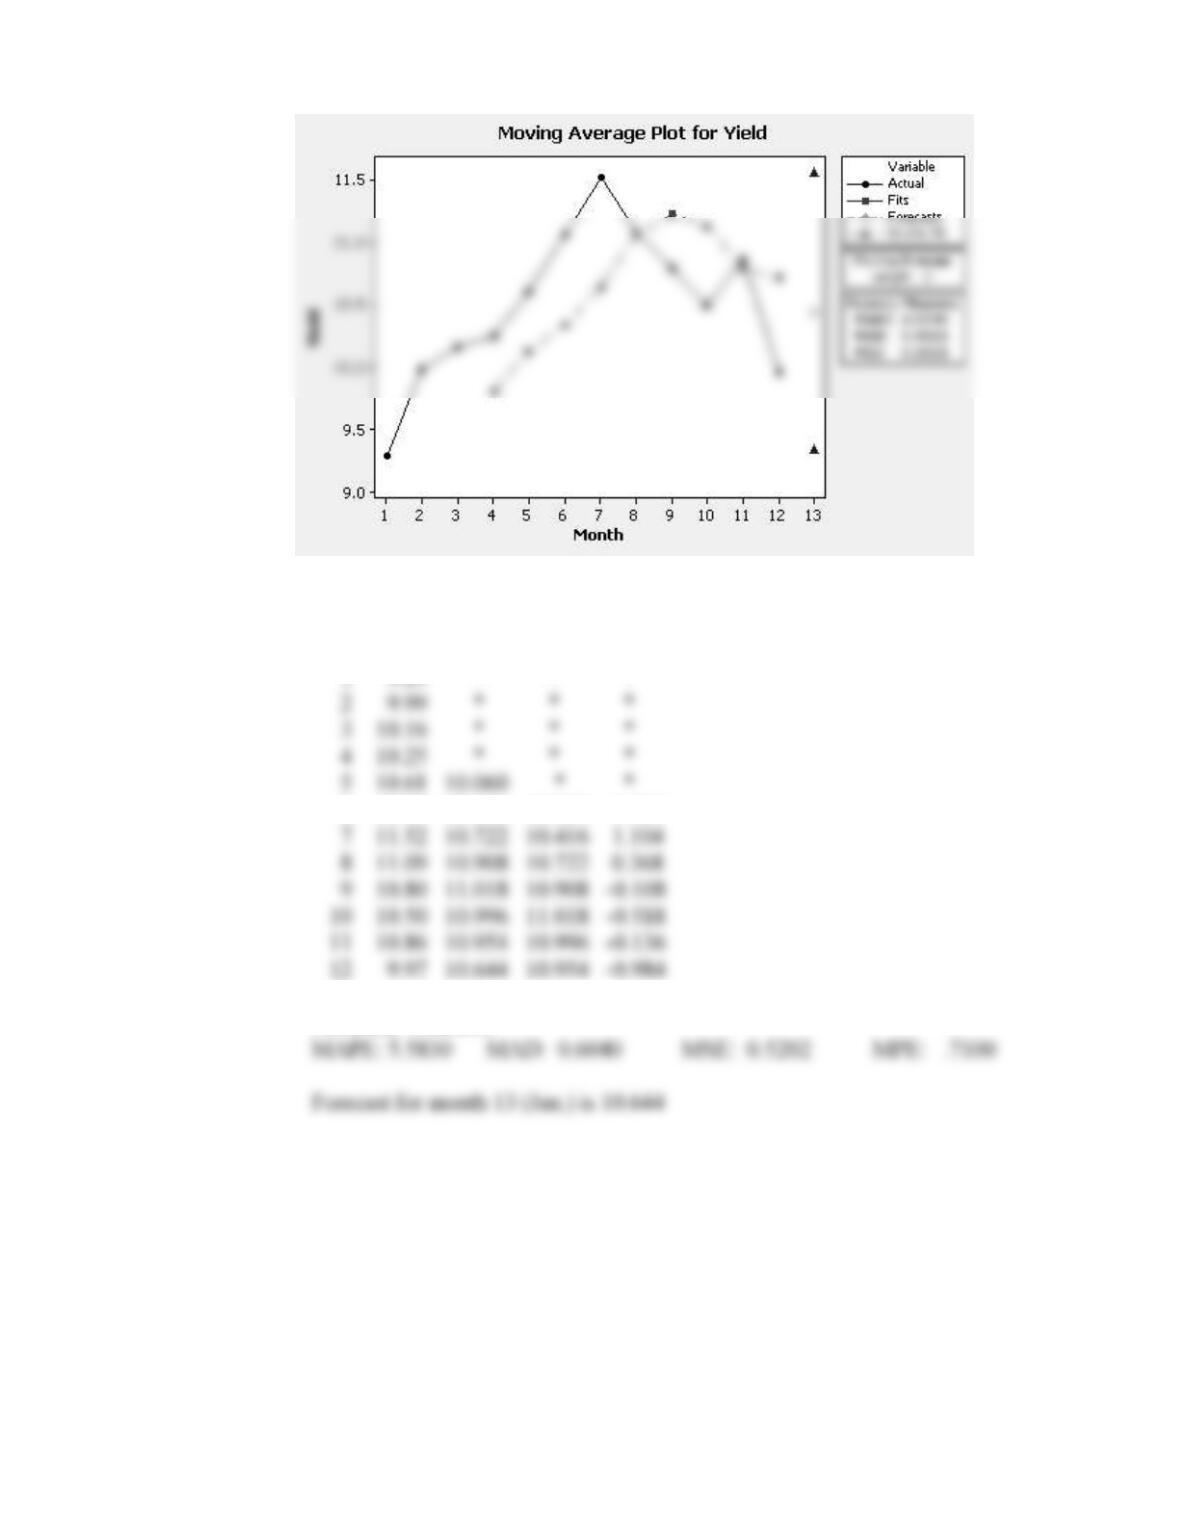
9. a. & c, d, e, f 3-month moving-average (See plot below.)
Month Yield MA Forecast Error
4 10.25 10.133 9.813 0.437
10 10.50 10.797 11.137 -0.637
Accuracy Measures
29
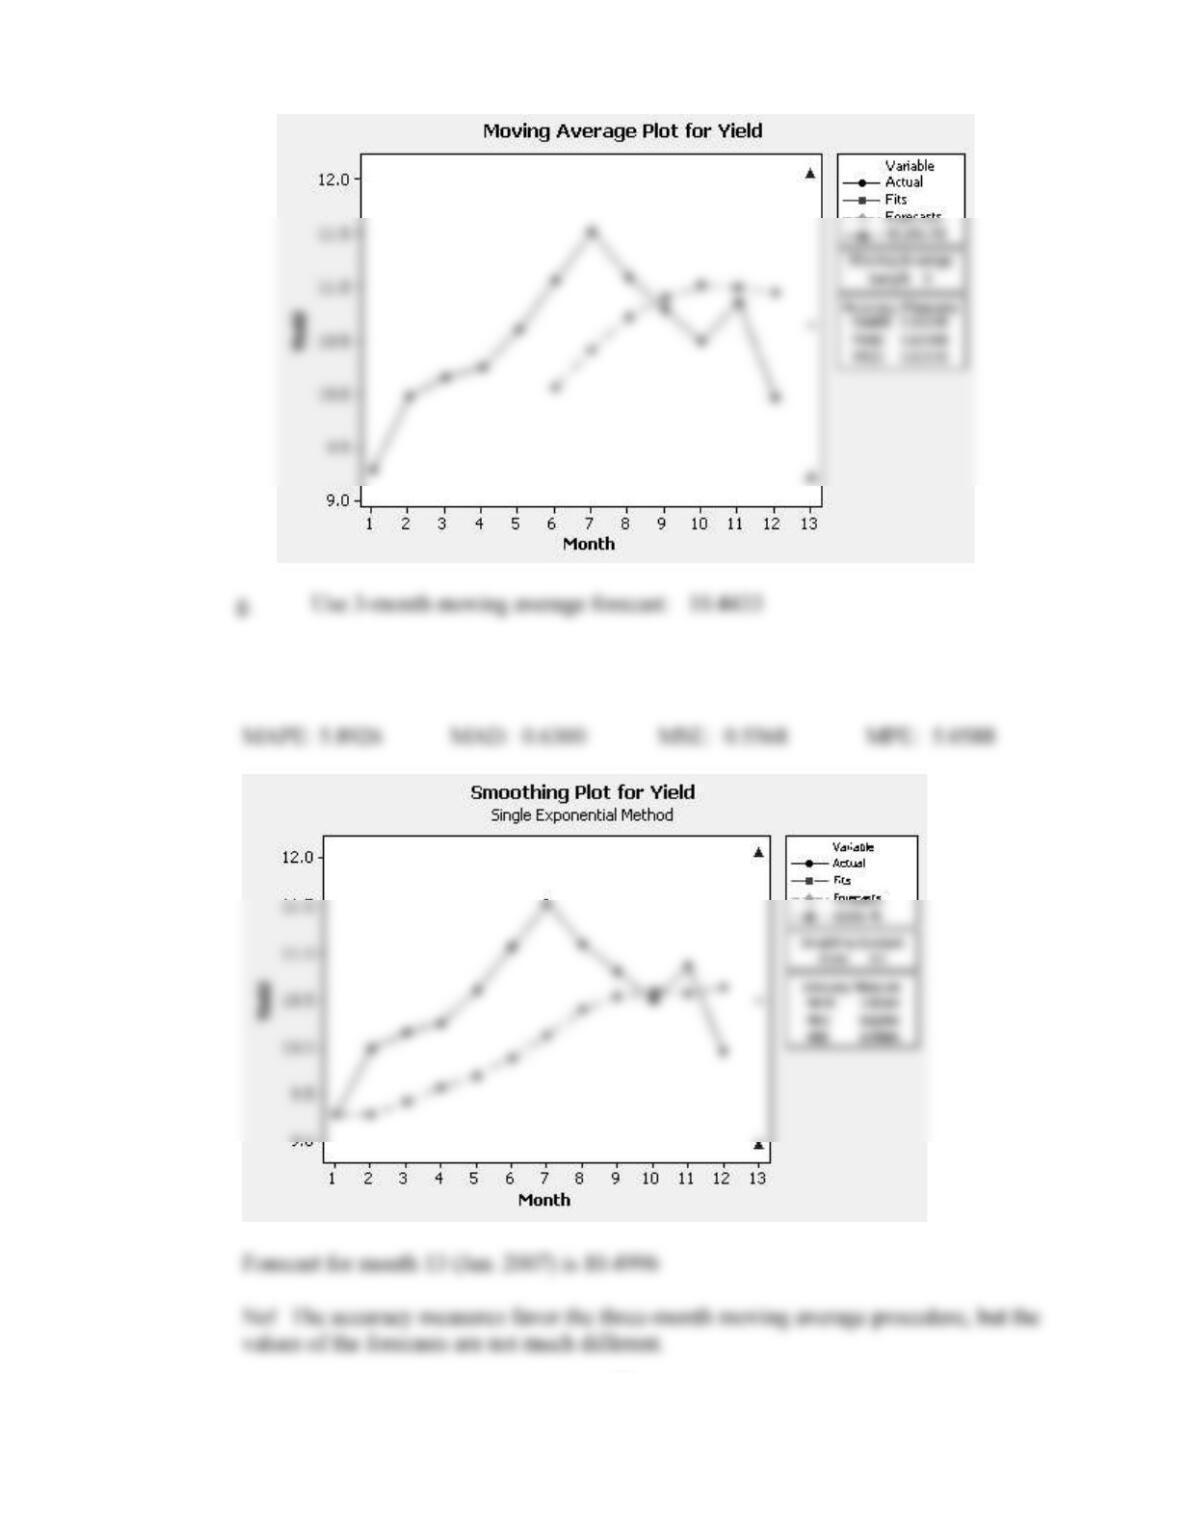
b. & c, d, e, f 5-month moving-average (See plot below.)
Month Yield MA Forecast Error
6 11.07 10.416 10.060 1.010
Accuracy Measures
30
10. Accuracy Measures (See plot below.)
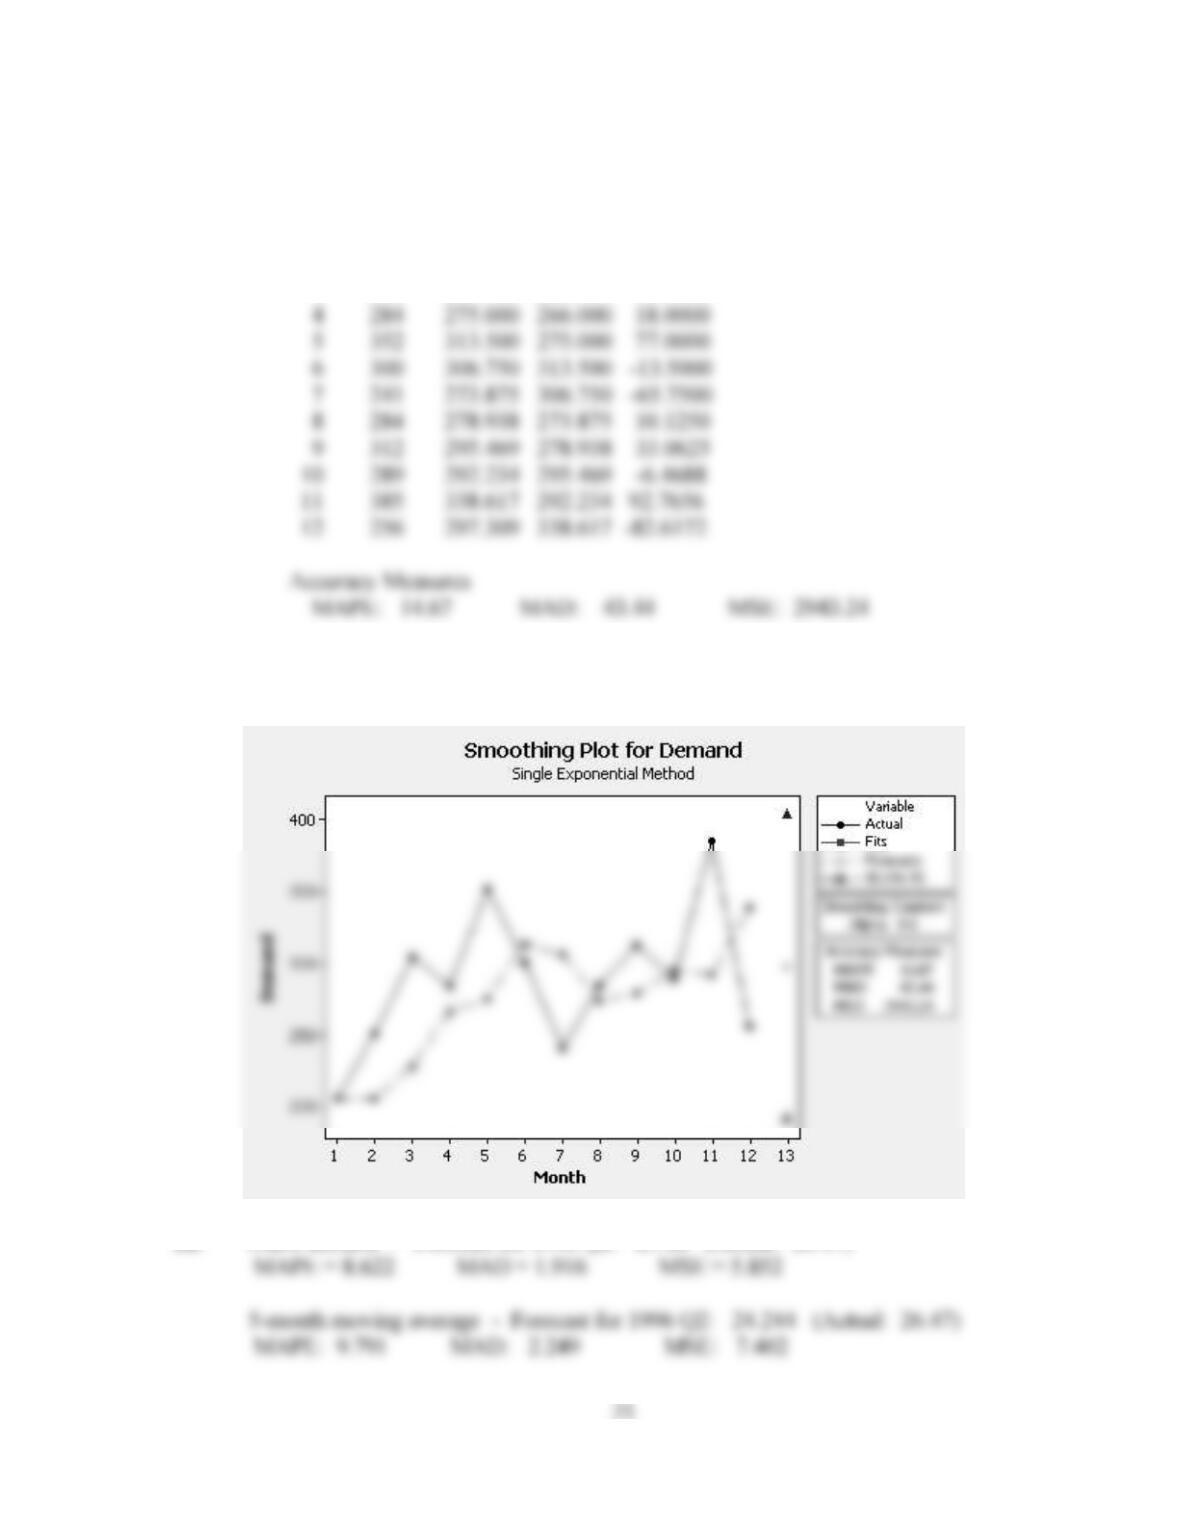
11. See plot below.
Month Demand Smooth Forecast Error
1 205 205.000 205.000 0.0000
2 251 228.000 205.000 46.0000
3 304 266.000 228.000 76.0000
Forecast for month 13 (Jan. 2007) is 297.309
12. Naïve method – Forecast for 1996 Q2: 25.68 (Actual: 26.47)
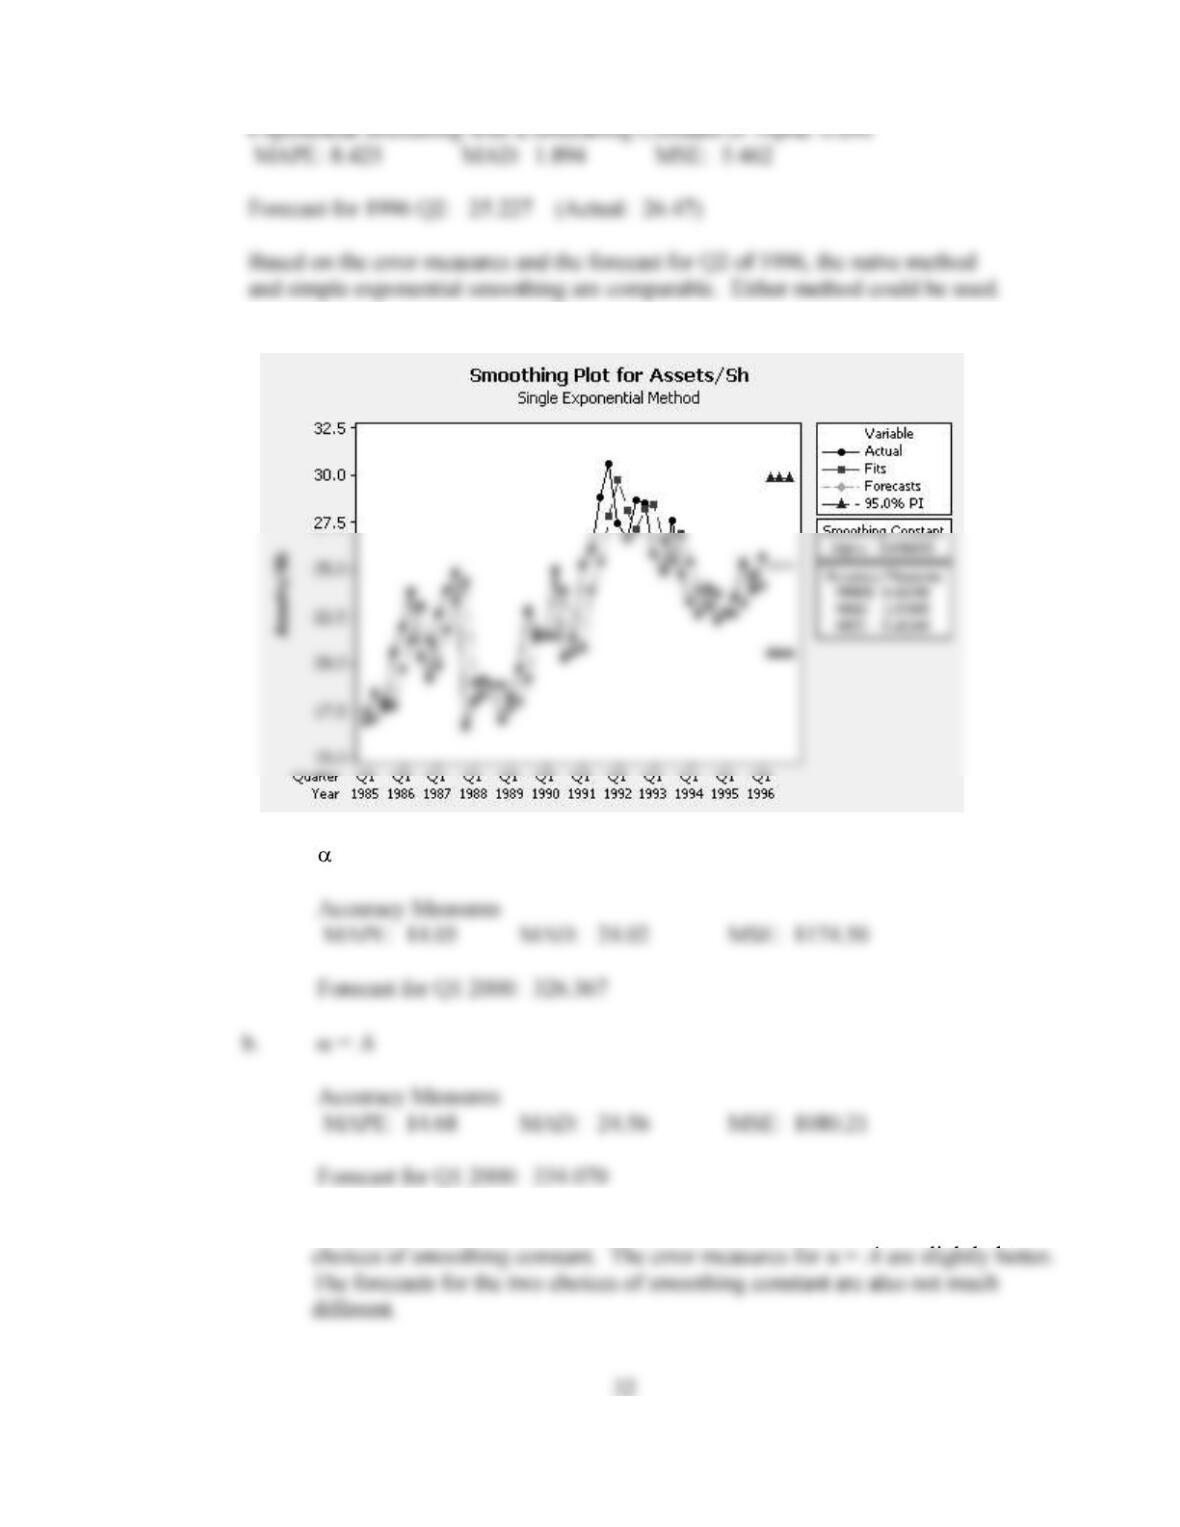
13. a. = .4
c. Looking at the error measures, there is not much difference between the two
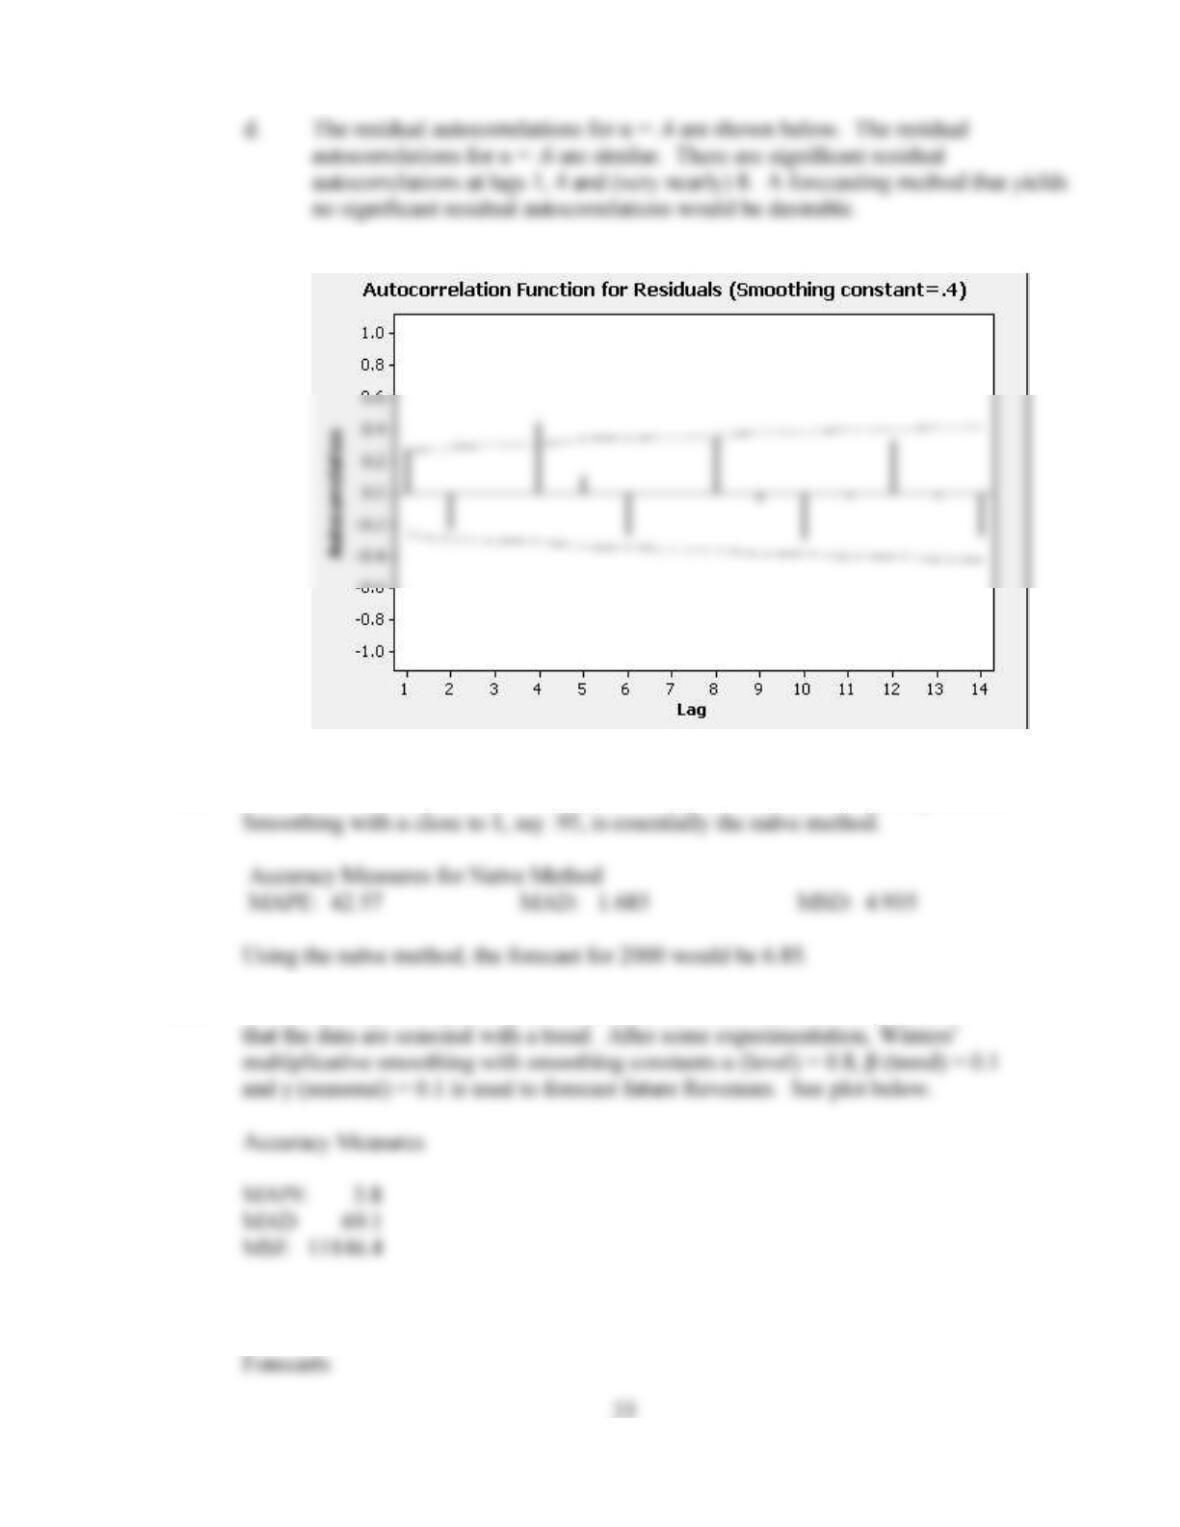
14. None of the techniques do much better than the naïve method. Simple exponential
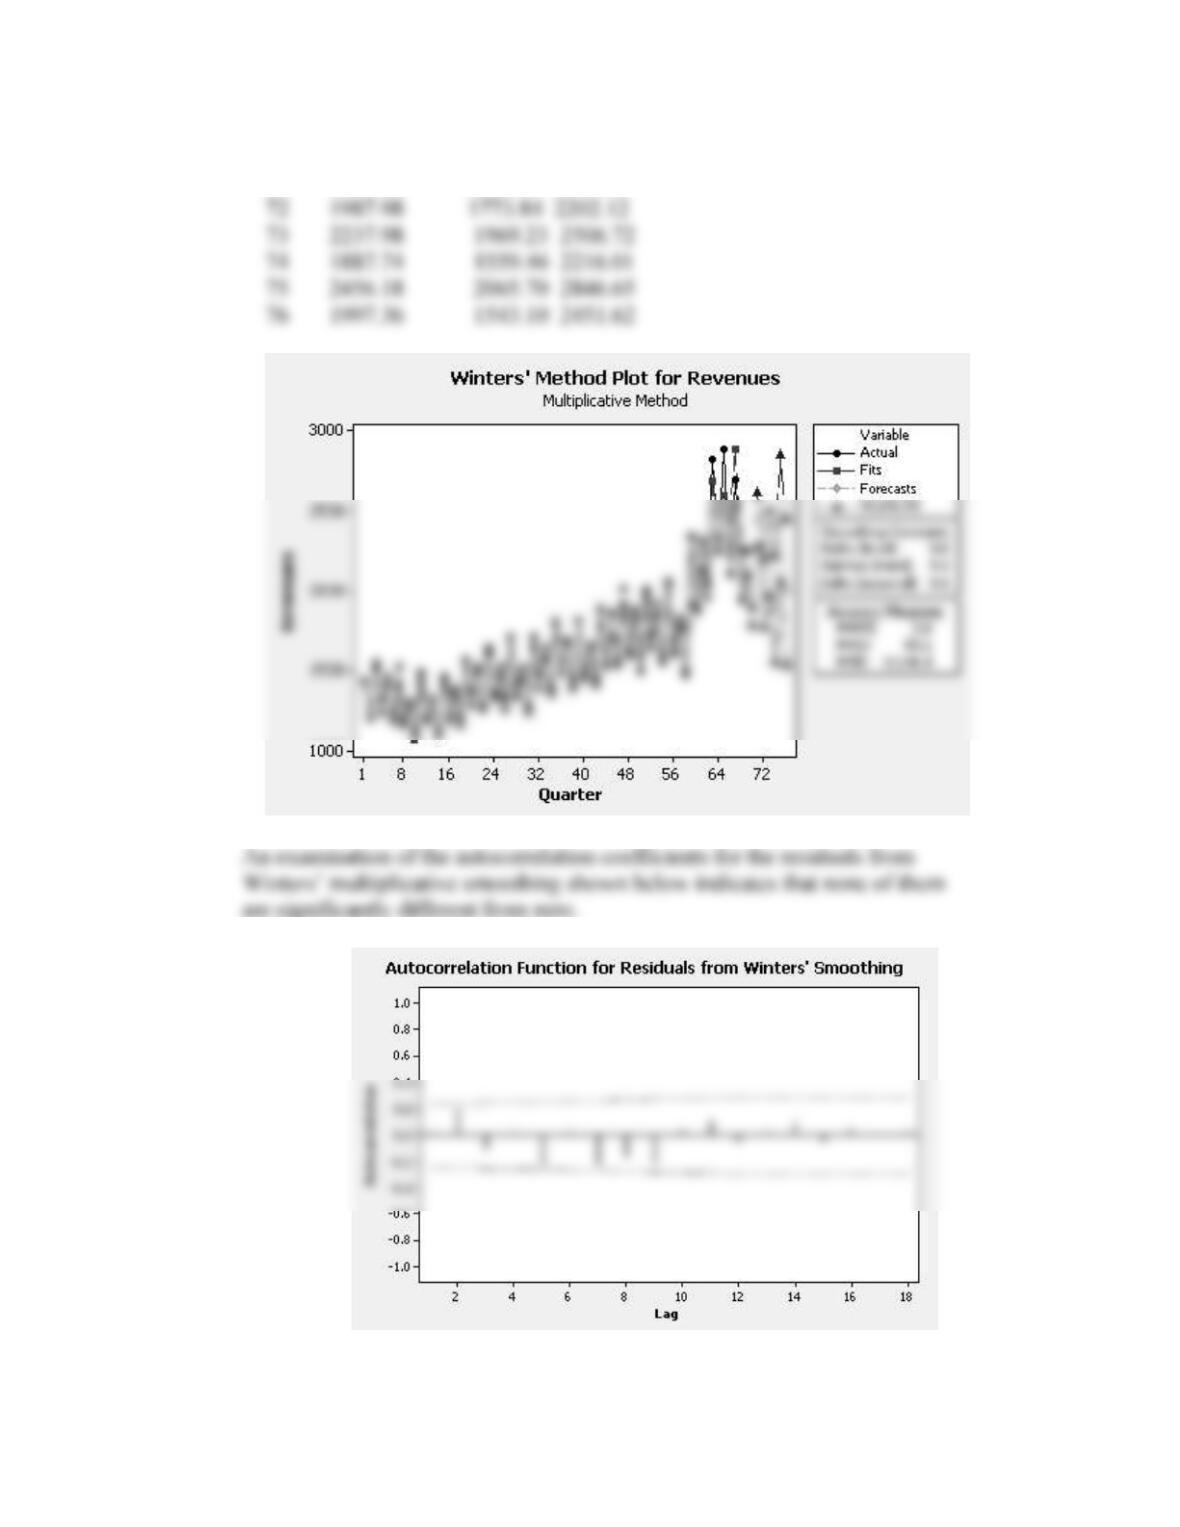
15. A time series plot of quarterly Revenues and the autocorrelation function show
34
Quarter Forecast Lower Upper
71 2444.63 2275.34 2613.92
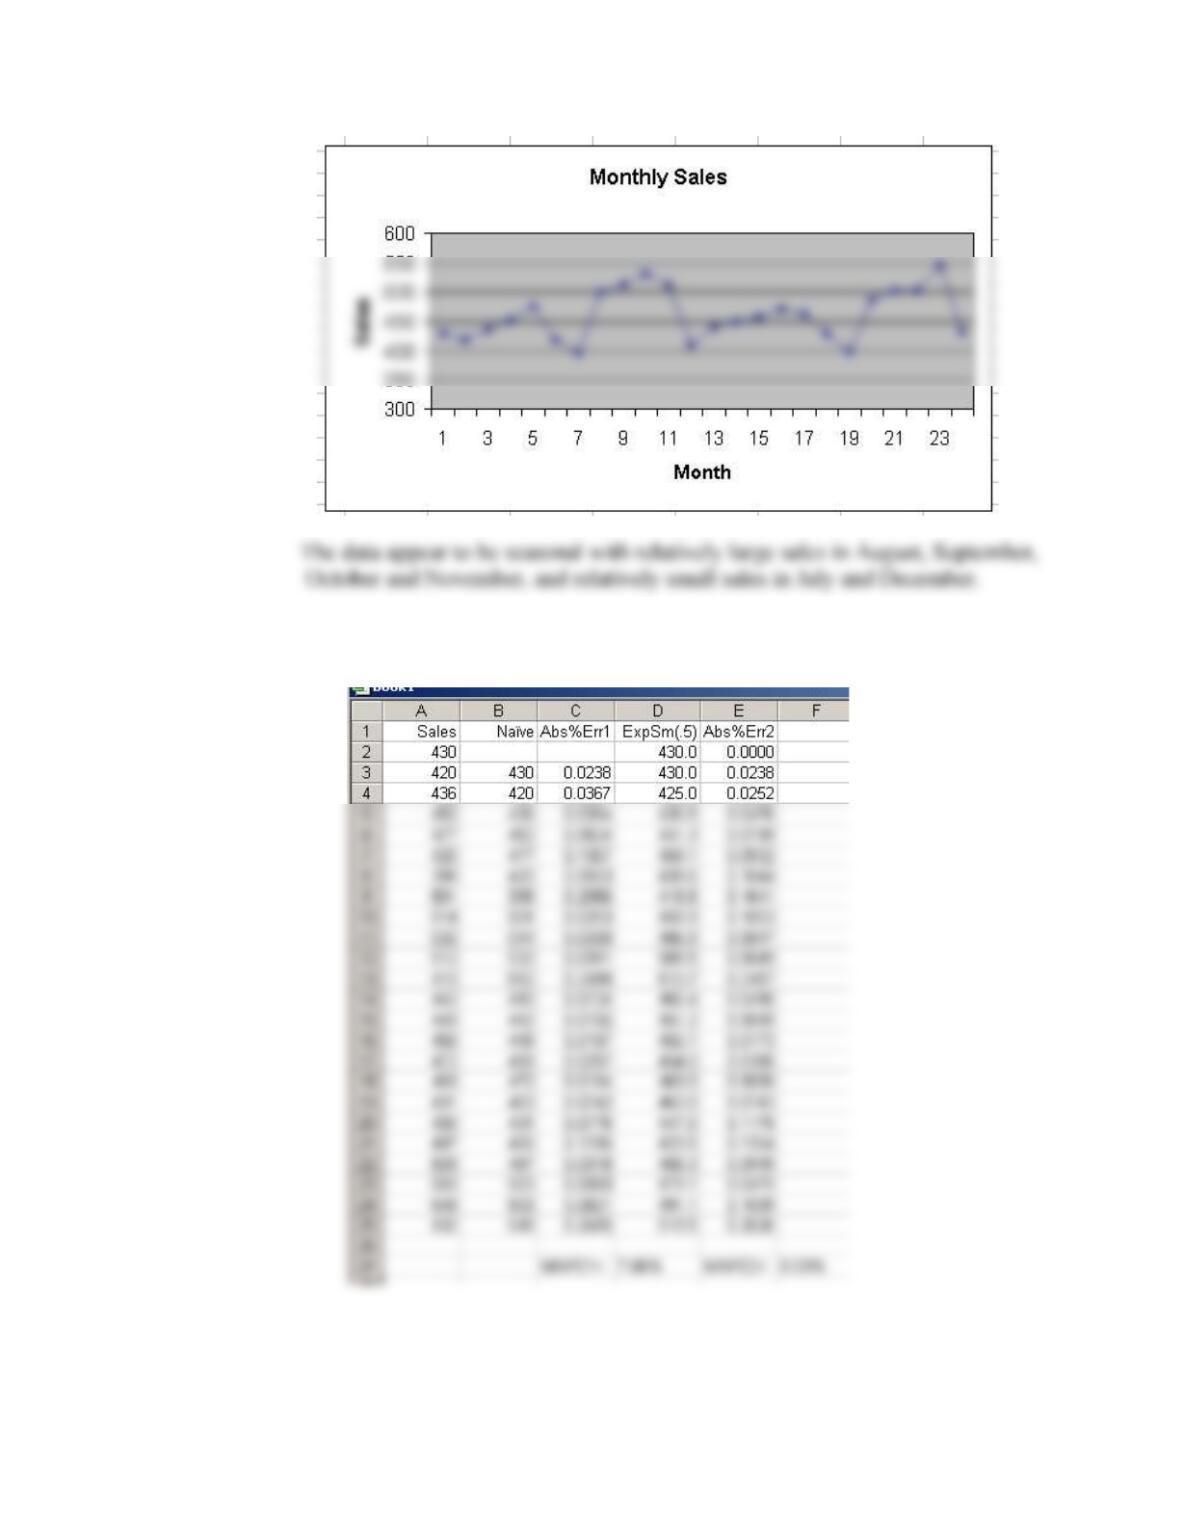
16. a. An Excel time series plot for Sales follows
35
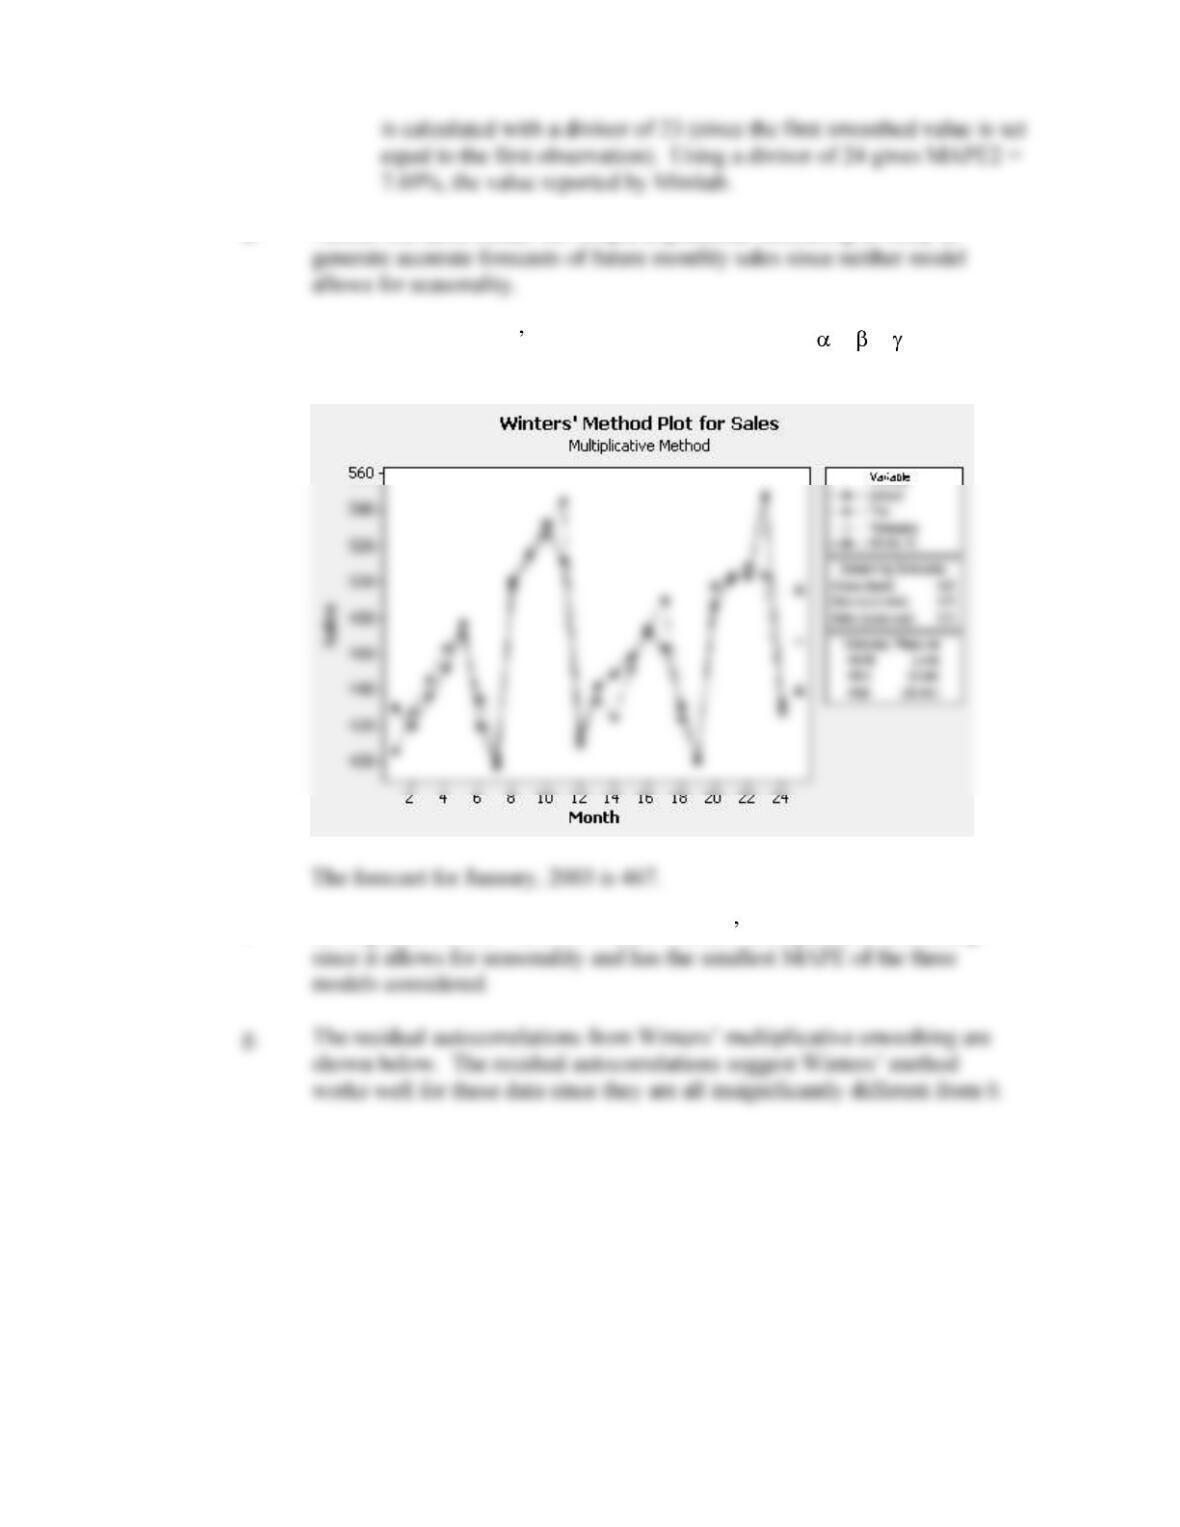
b. & c. The Excel spreadsheet for calculating MAPE for the naïve forecasts and
the simple exponential smoothing forecasts is shown below.
Note: MAPE2 for simple exponential smoothing in the Excel spreadsheet
36
d. Neither the naïve model nor simple exponential smoothing is likely to
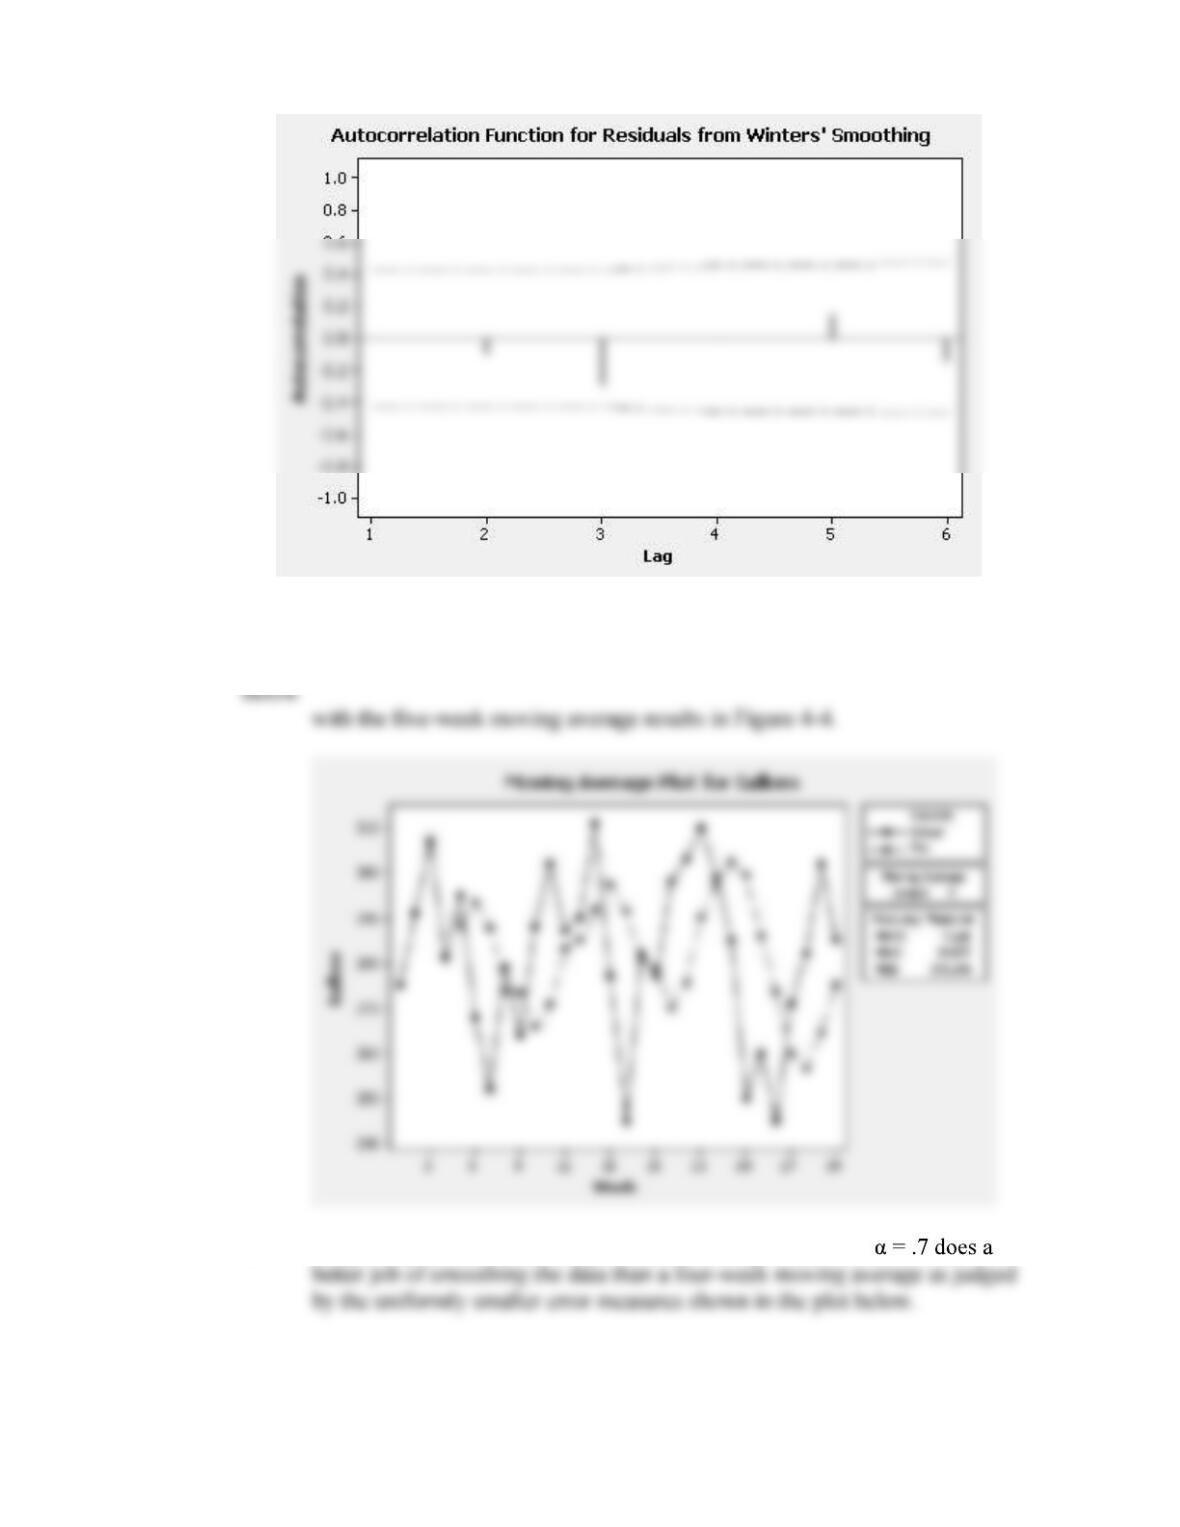
e. The results of Winters multiplicative smoothing with = = = .5 is
shown in the Minitab plot below.
f. From part e, MAPE = 2.45%. Prefer Winters multiplicative smoothing
37
17. a. The four-week moving average seems to represent the data a little better.
Compare the error measures for the four-week moving average in the figure
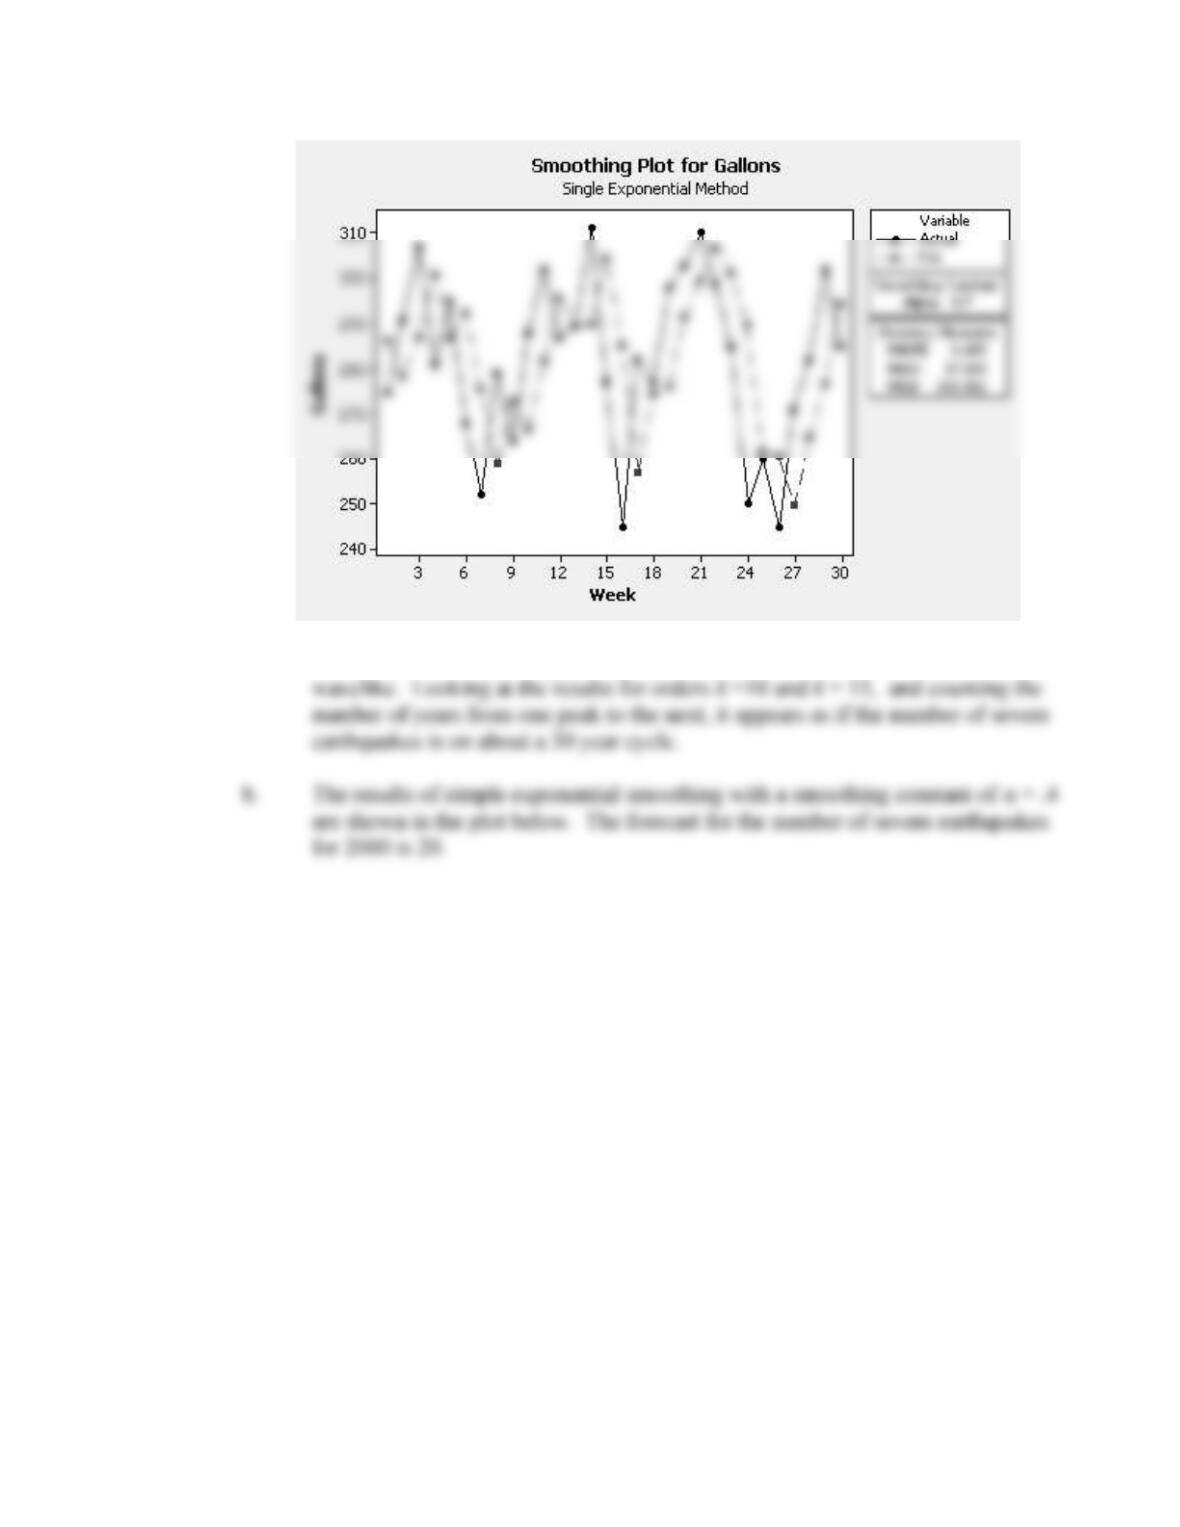
b. Simple exponential smoothing with a smoothing constant of
38
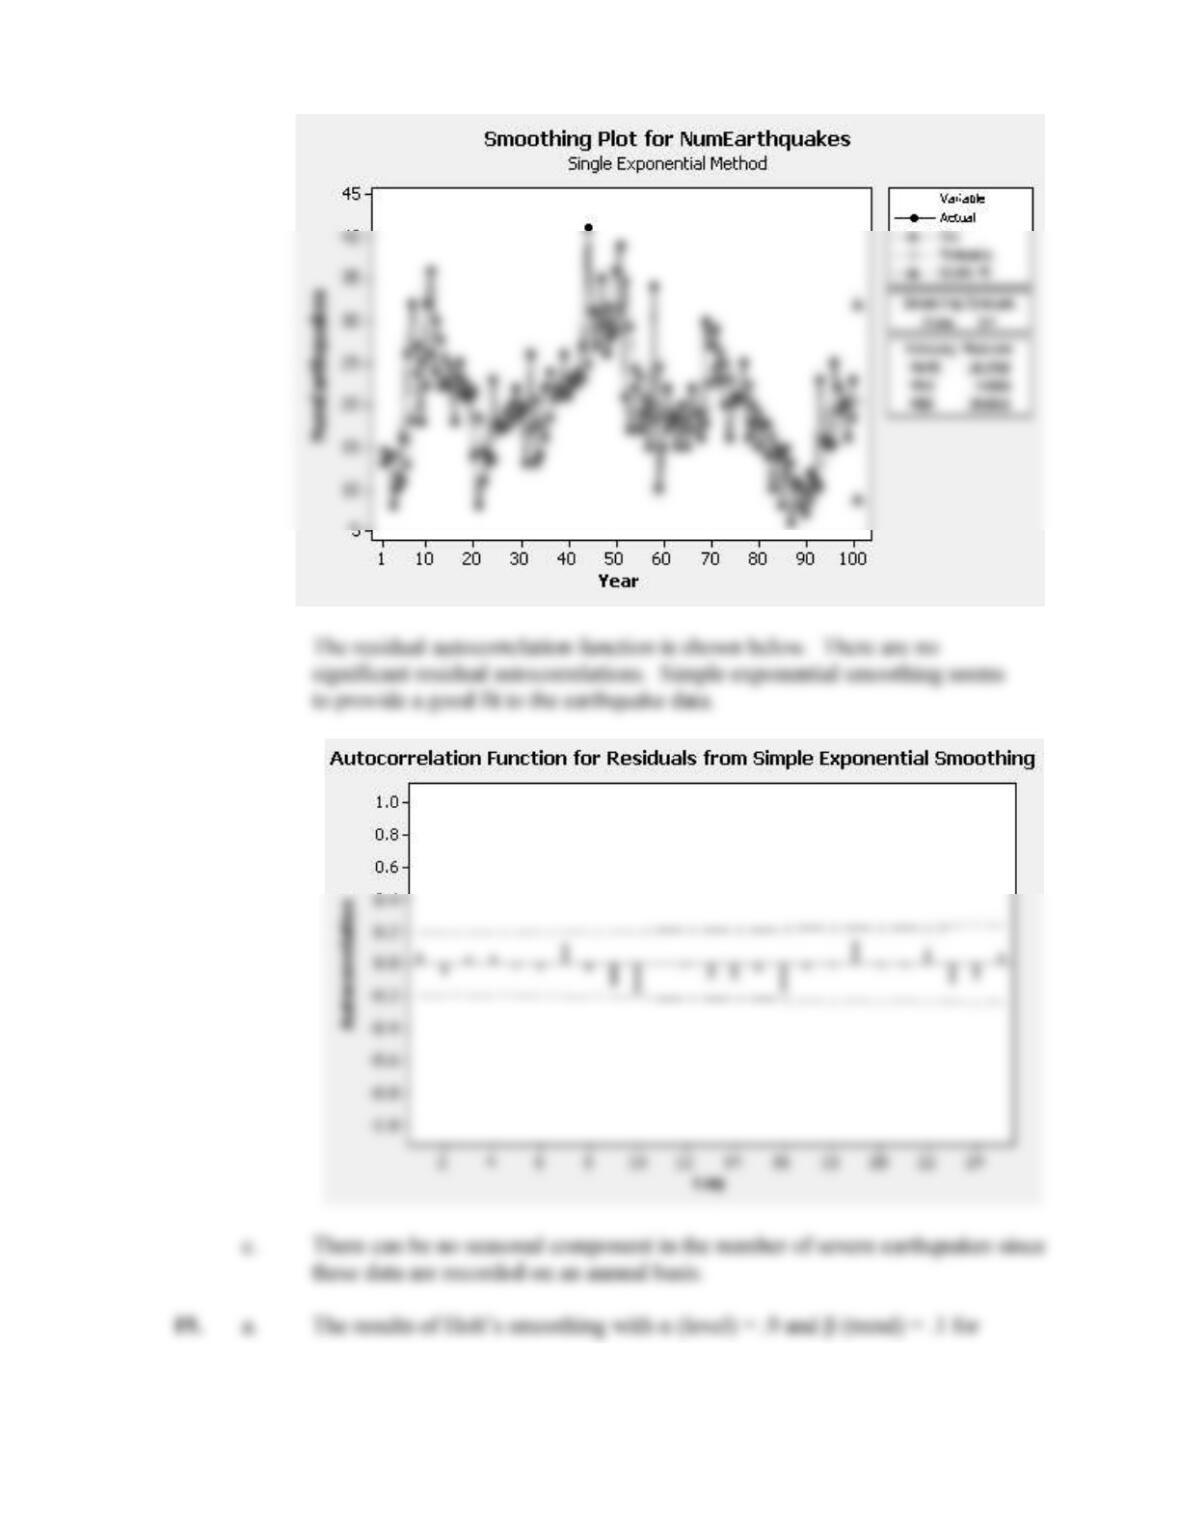
18. a. As the order of the moving average increases, the smoothed data become more
39
40
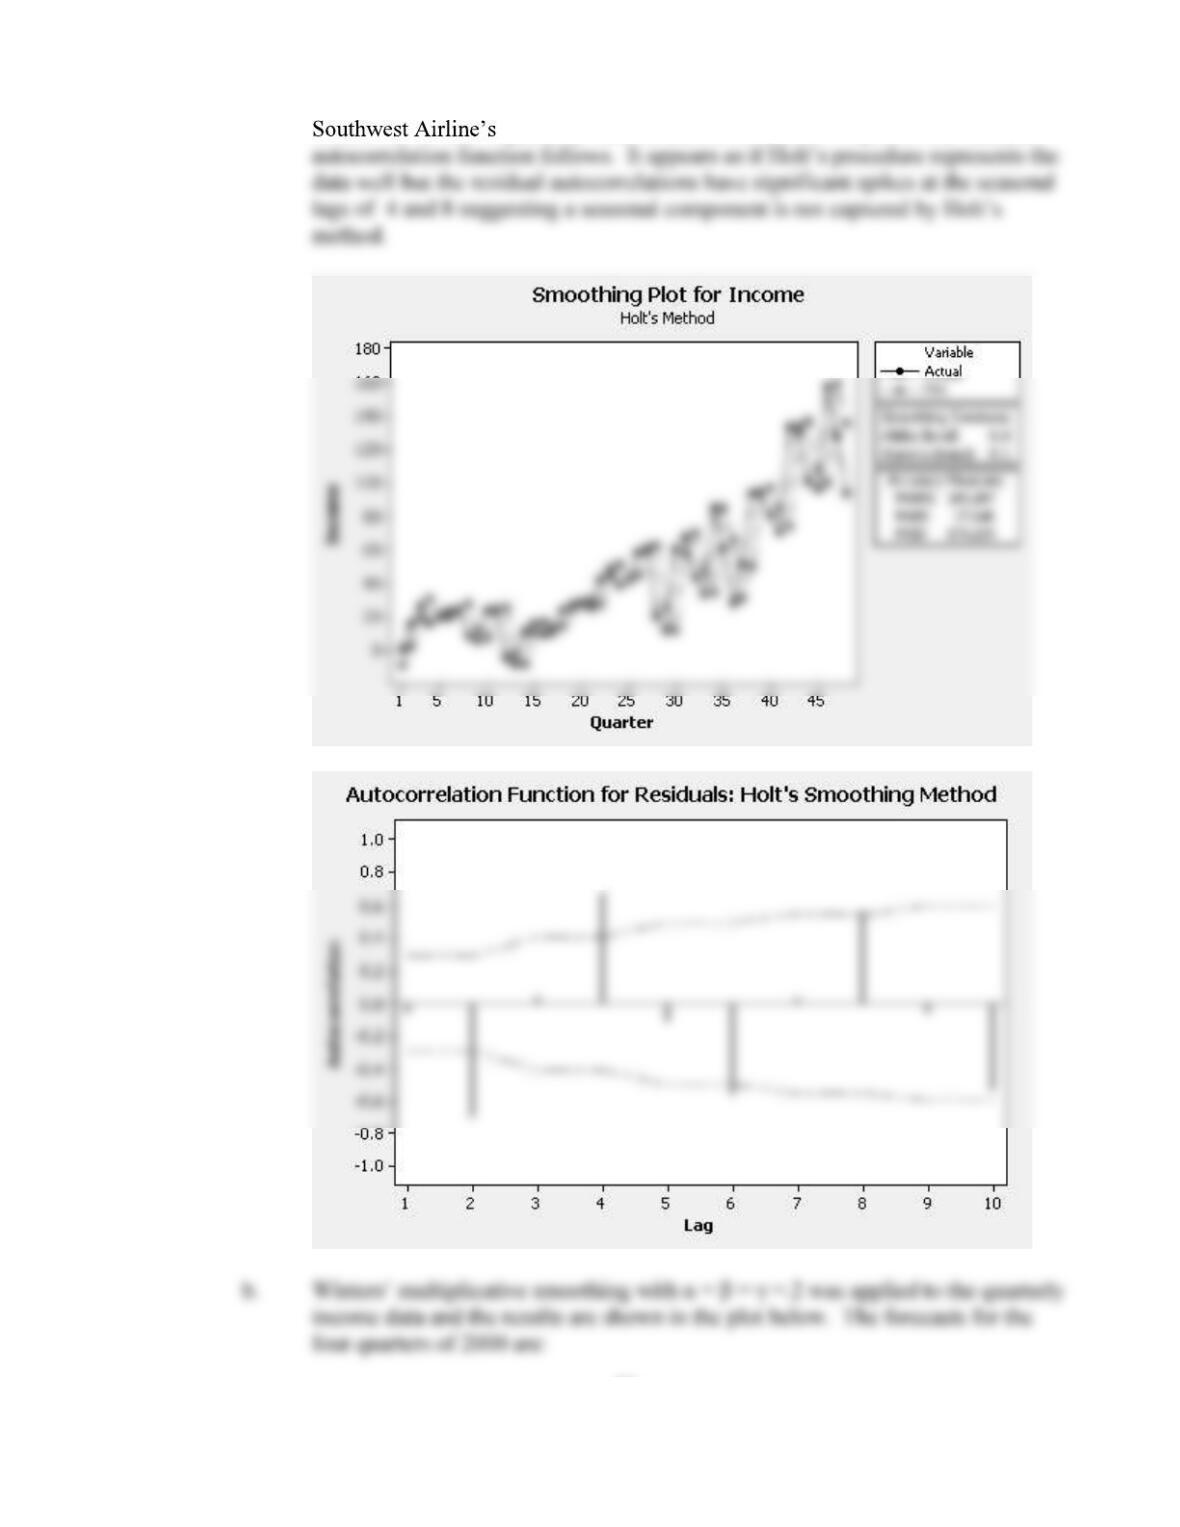
quarterly income are shown below. A plot of the residual